| Param | Original file | Final file |
|---|---|---|
| Filename | modeM0/AS1A14_021T06_9000006538_55601cztM0_level2.fits | modeM0/AS1A14_021T06_9000006538_55601cztM0_level2_quad_clean.evt |
| Size (bytes) | 403,079,040 | 95,328,000 |
| Size | 384.4 MB | 90.9 MB |
| Events in quadrant A | 3,614,230 | 611,159 |
| Events in quadrant B | 3,547,403 | 653,941 |
| Events in quadrant C | 3,116,080 | 592,101 |
| Events in quadrant D | 4,112,870 | 554,711 |
| Mode M9 | |||
|---|---|---|---|
| Quadrant | BADHDUFLAG | Total packets | Discarded packets |
| A | 0 | 8 | 0 |
| B | 0 | 8 | 0 |
| C | 0 | 8 | 0 |
| D | 0 | 8 | 0 |
| Mode M0 | |||
|---|---|---|---|
| Quadrant | BADHDUFLAG | Total packets | Discarded packets |
| A | 0 | 15789 | 1 |
| B | 0 | 15808 | 1 |
| C | 0 | 14723 | 1 |
| D | 0 | 17214 | 3 |
| Mode SS | |||
|---|---|---|---|
| Quadrant | BADHDUFLAG | Total packets | Discarded packets |
| A | 0 | 138 | 0 |
| B | 0 | 138 | 0 |
| C | 0 | 138 | 0 |
| D | 0 | 138 | 0 |
| Quadrant | Total seconds | Saturated seconds | Saturation percentage |
|---|---|---|---|
| A | 6808 | 131 | 1.924207% |
| B | 6808 | 180 | 2.643948% |
| C | 6809 | 82 | 1.204288% |
| D | 6808 | 120 | 1.762632% |
Noise dominated data is calculated using 1-second bins in cleaned event files. If a bin has >2000 counts, and if more than 50% of those come from <1% of pixels, then it is considered to be noise-dominated and hence unusable.
| Quadrant | # 1 sec bins | Bins with >0 counts | Bins with >2000 counts | High rate bins dominated by noise | Noise dominated (total time) | Noise dominated (detector-on time) | Marked lightcurve |
|---|---|---|---|---|---|---|---|
| A | 7638 | 6809 | 116 | 116 | 1.52% | 1.70% | 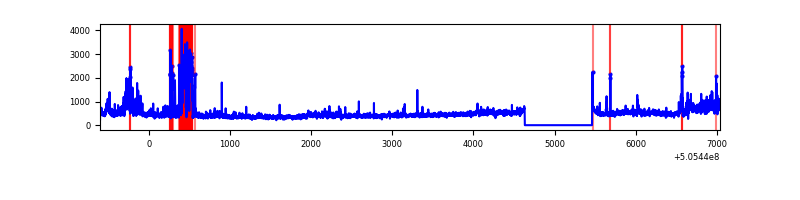 |
| B | 7638 | 6809 | 119 | 119 | 1.56% | 1.75% | 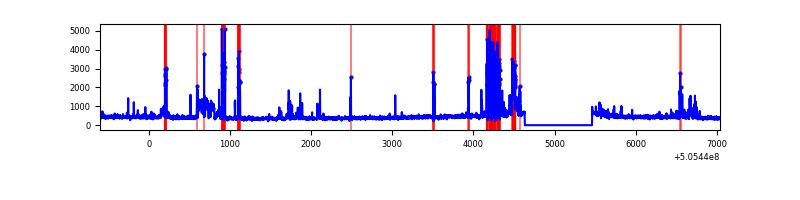 |
| C | 7639 | 6810 | 57 | 57 | 0.75% | 0.84% | 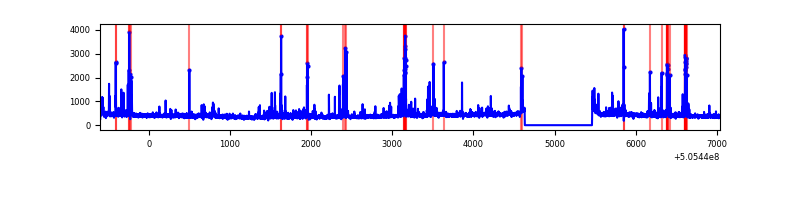 |
| D | 7638 | 6809 | 147 | 147 | 1.92% | 2.16% | 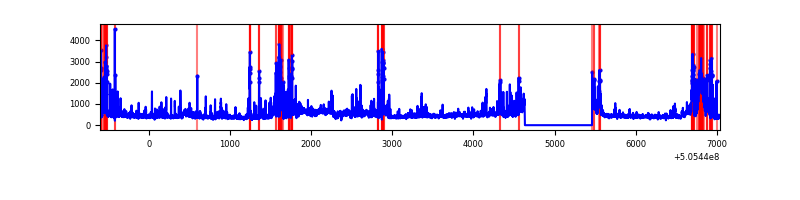 |
Top three noisy pixels from each quadrant. If the there are fewer than three noisy pixels in the level2.evt file, extra rows are filled as -1
| Pixel properties | Quadrant properties | ||||||
|---|---|---|---|---|---|---|---|
| Quadrant | DetID | PixID | Counts | Sigma | Mean | Median | Sigma |
| A | 12 | 115 | 465469 | 2743.82 | 685 | 665 | 169.4 |
| A | 3 | 14 | 382541 | 2254.28 | 685 | 665 | 169.4 |
| A | 8 | 249 | 94535 | 554.13 | 685 | 665 | 169.4 |
| B | 5 | 236 | 693118 | 4789.62 | 676 | 650 | 144.6 |
| B | 5 | 185 | 60935 | 416.98 | 676 | 650 | 144.6 |
| B | 7 | 0 | 44776 | 305.21 | 676 | 650 | 144.6 |
| C | 15 | 178 | 179884 | 974.82 | 673 | 666 | 183.8 |
| C | 10 | 19 | 76840 | 414.34 | 673 | 666 | 183.8 |
| C | 15 | 200 | 59106 | 317.87 | 673 | 666 | 183.8 |
| D | 8 | 160 | 832142 | 4380.53 | 665 | 636 | 189.8 |
| D | 11 | 129 | 207625 | 1090.46 | 665 | 636 | 189.8 |
| D | 2 | 249 | 171802 | 901.73 | 665 | 636 | 189.8 |
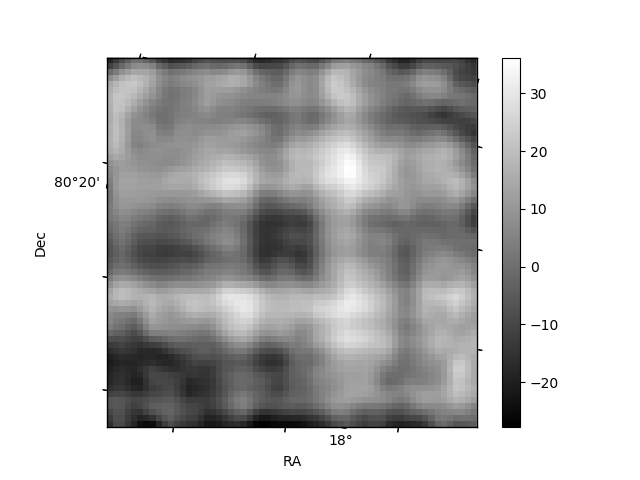
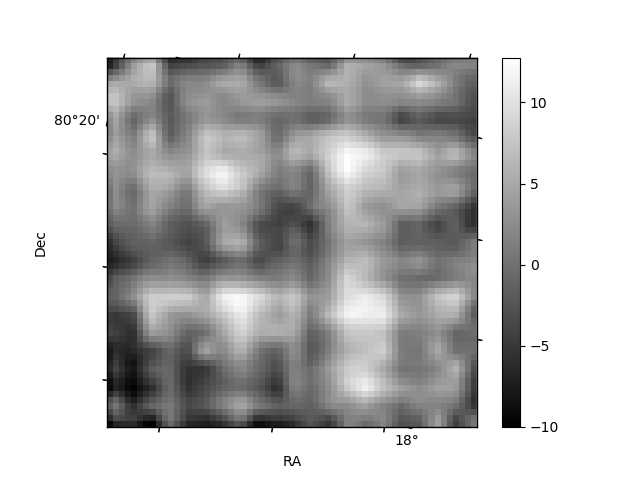
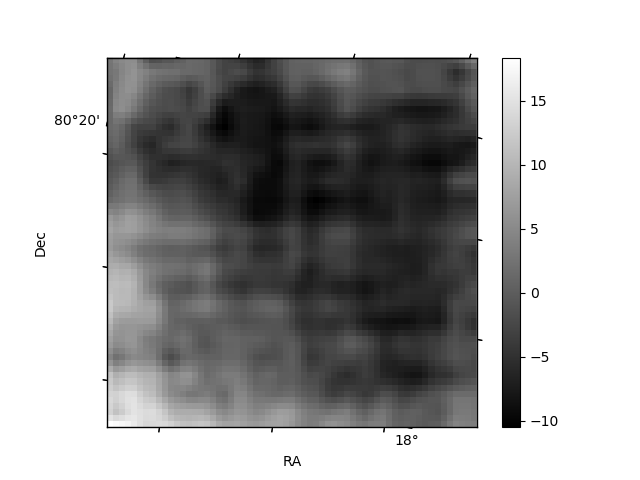
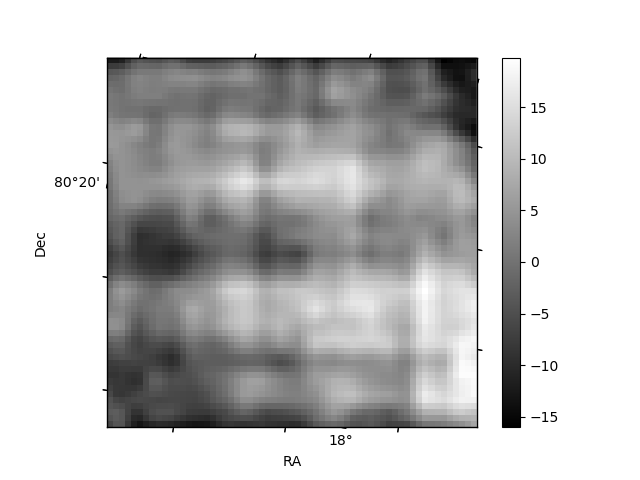
Histogram calculated using DETX and DETY for each event in the final _common_clean file
| Quadrant A | 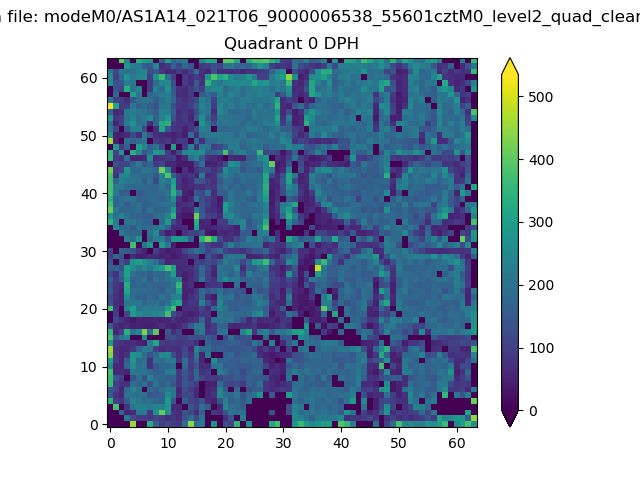 |
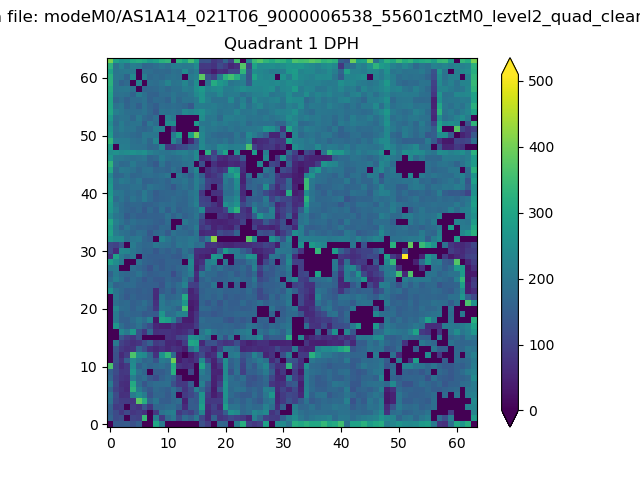 |
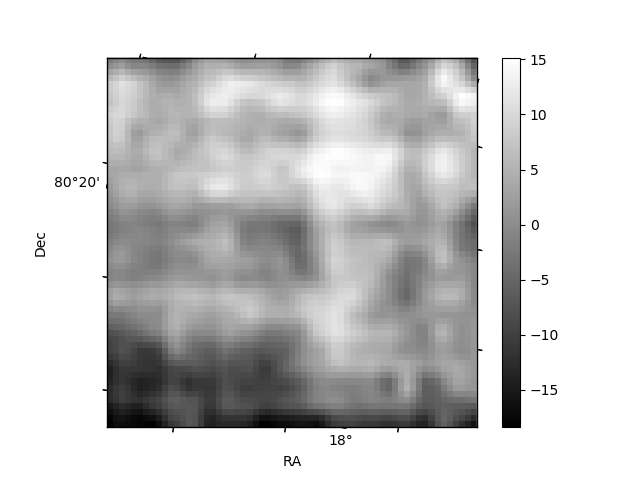
Quadrant B |
|---|---|---|---|
| Quadrant D | 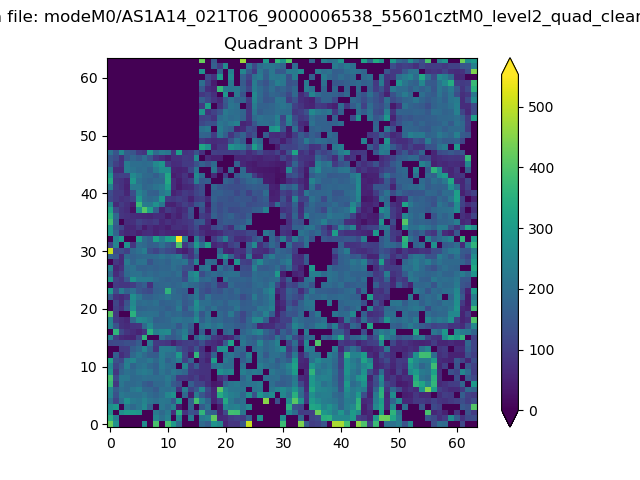 |
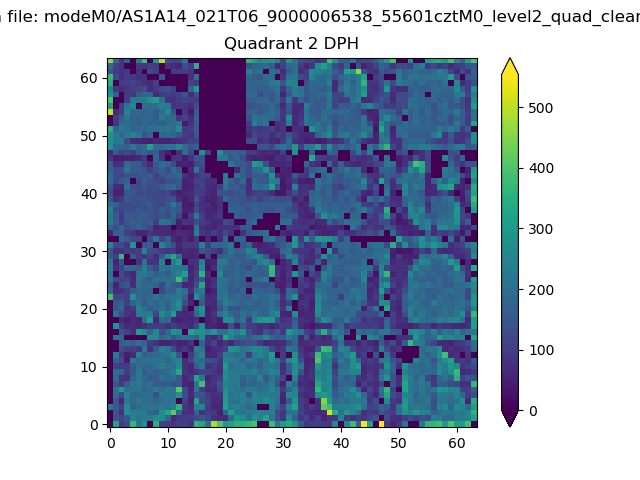 |
Quadrant C |
| Plot type | Count rate plots | Images |
|---|---|---|
| Comparison with Poisson distribution Blue bars denote a histogram of data divided into 1 sec bins. Red curve is a Poisson curve with rate = median count rate of data. |
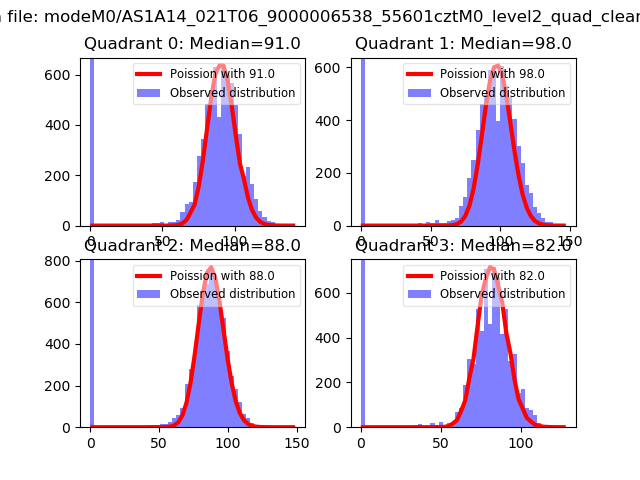 |
 |
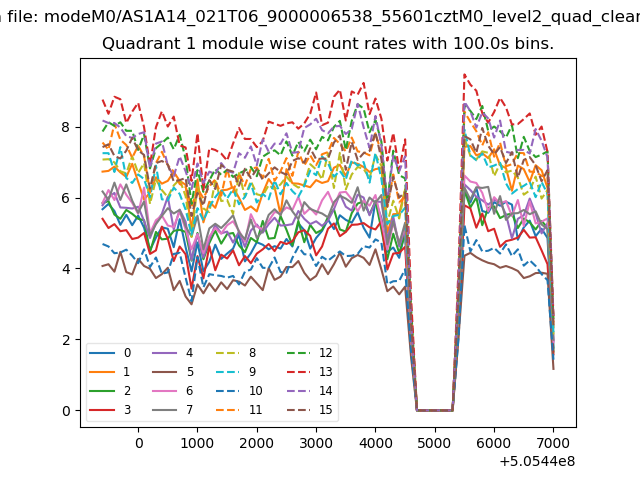
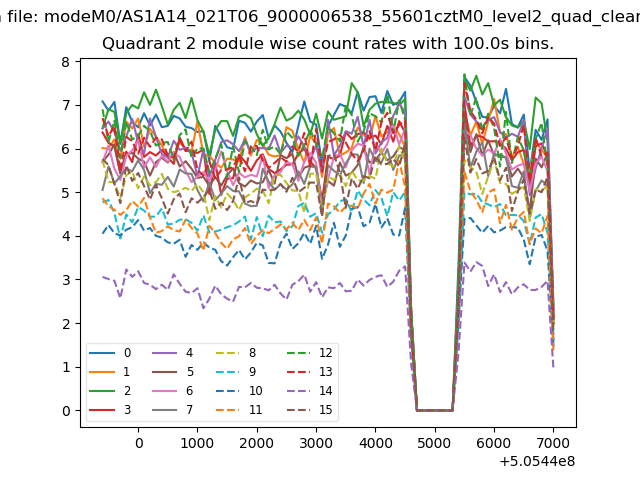
| Quadrant-wise count rates Data is divided into 100 sec bins |
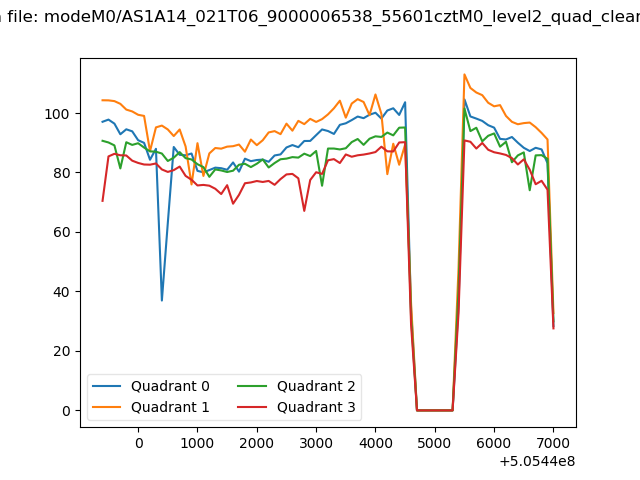 |
|
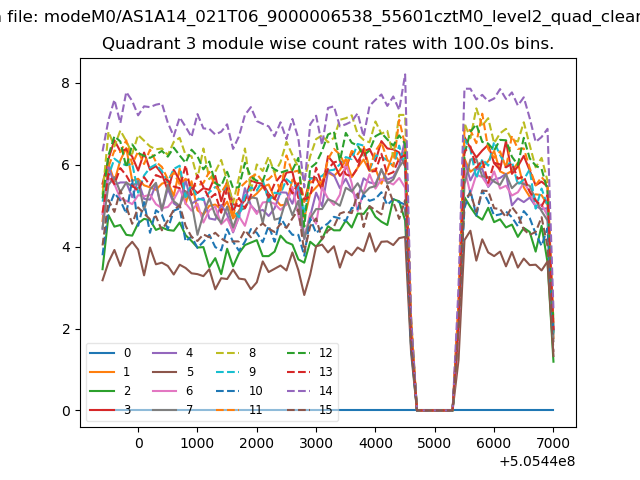
| Module-wise count rates for Quadrant A Data is divided into 100 sec bins |
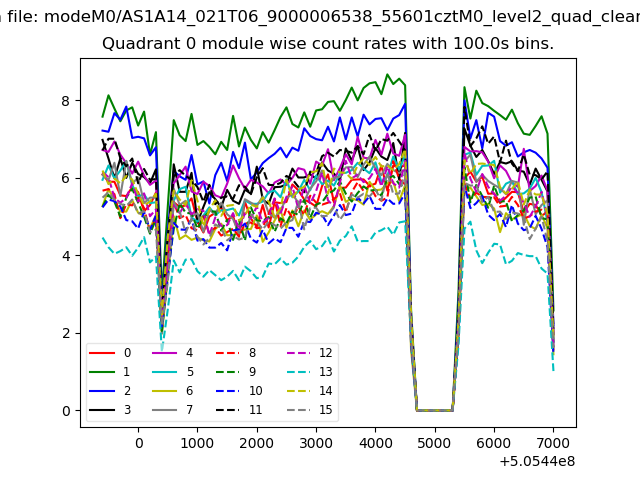 |
 |
| Module-wise count rates for Quadrant B Data is divided into 100 sec bins |
 |
 |
| Module-wise count rates for Quadrant C Data is divided into 100 sec bins |
 |
 |
| Module-wise count rates for Quadrant D Data is divided into 100 sec bins |
 |
 |
| Parameter | Plot |
|---|---|
| CZT HV Monitor | 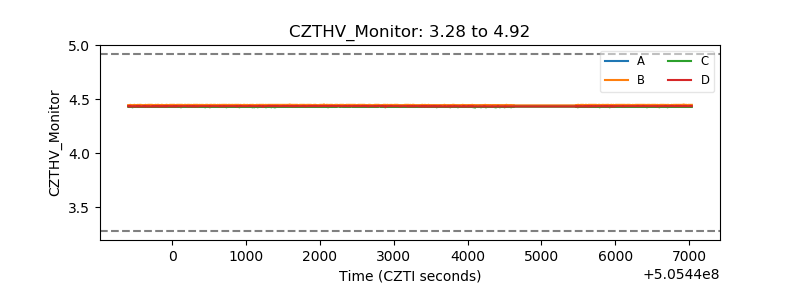 |
| D_VDD | 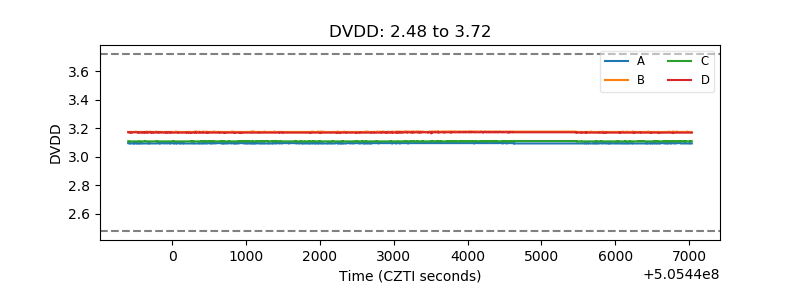 |
| Temperature 1 | 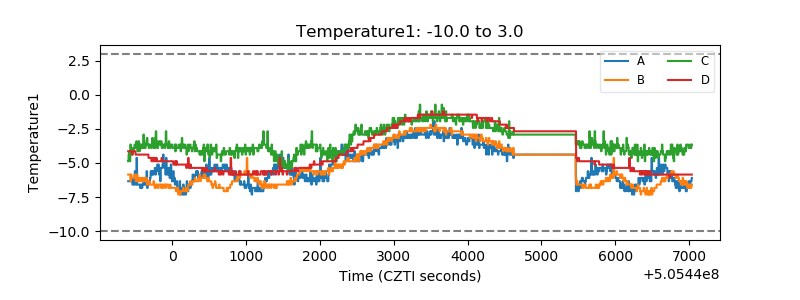 |
| Veto HV Monitor | 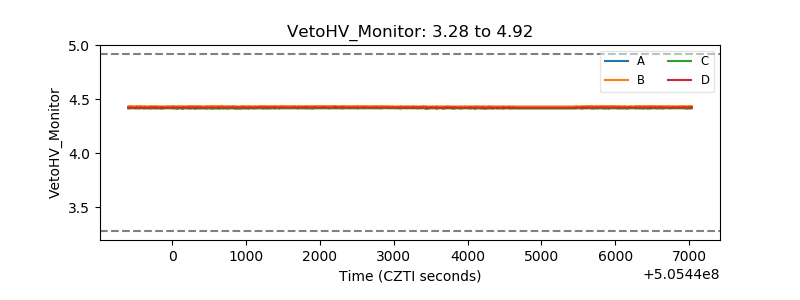 |
| Veto LLD | 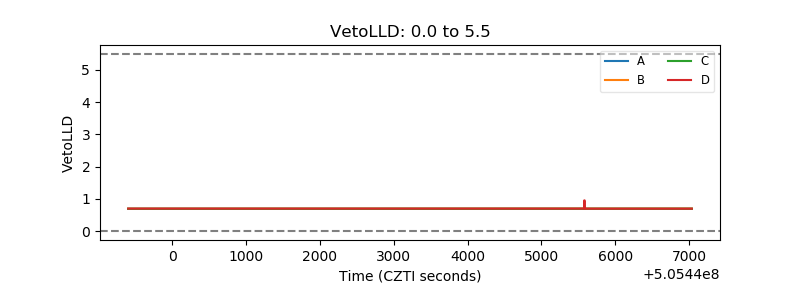 |
| Alpha Counter | 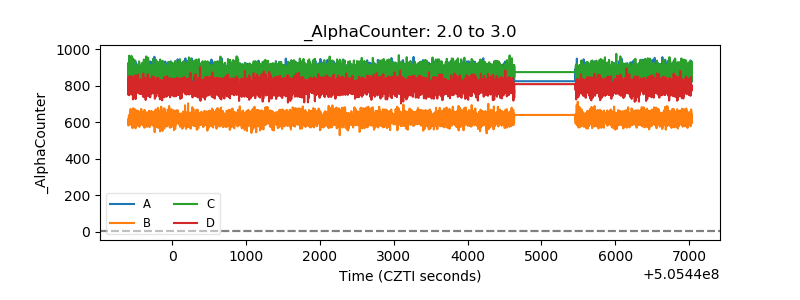 |
| _CPM_Rate | 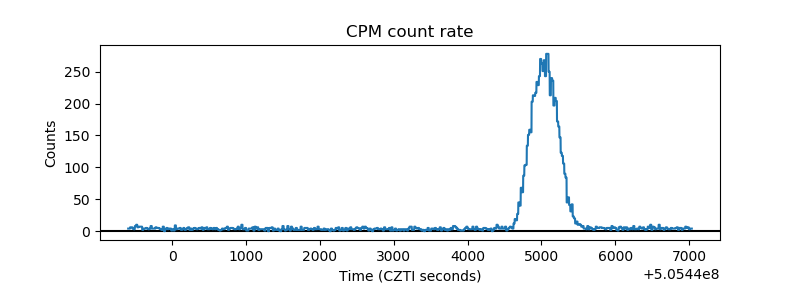 |
| CZT Counter | 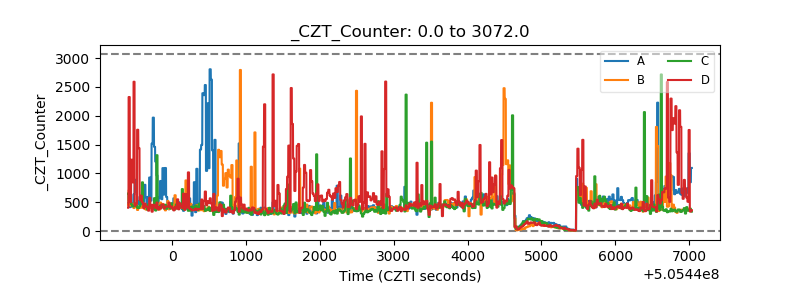 |
| +2.5 Volts monitor | 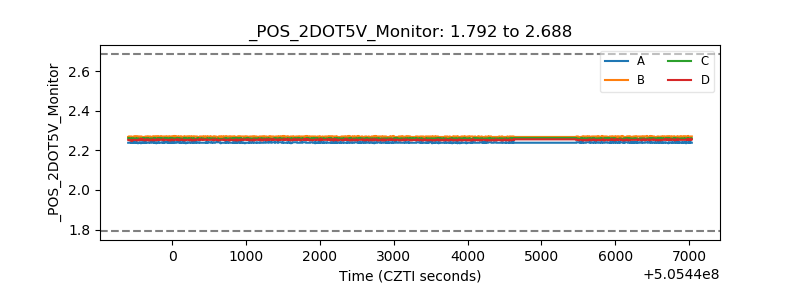 |
| +5 Volts monitor |  |
| _ROLL_ROT | 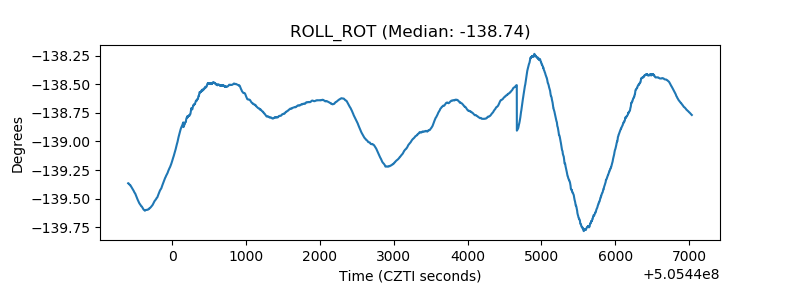 |
| _Roll_DEC | 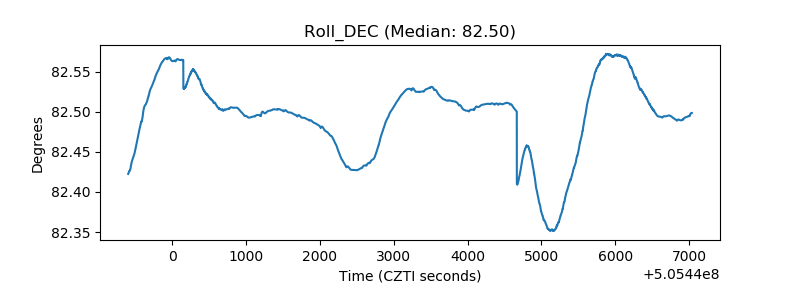 |
| _Roll_RA | 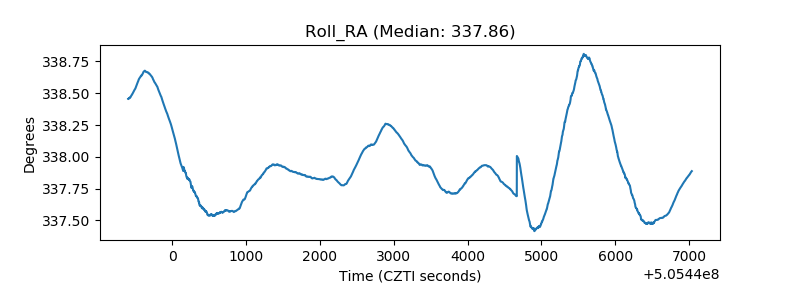 |
| Veto Counter | 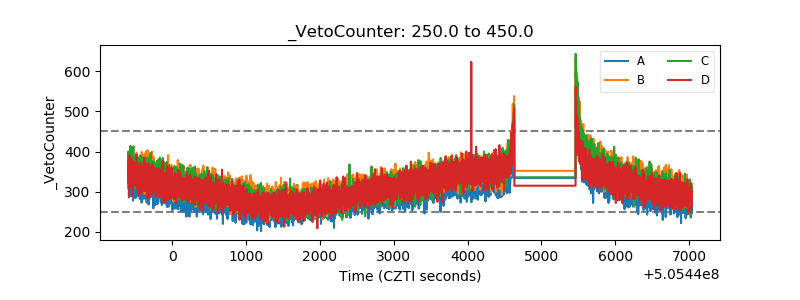 |