| Param | Original file | Final file |
|---|---|---|
| Filename | modeM0/AS1A14_021T06_9000006538_55605cztM0_level2.fits | modeM0/AS1A14_021T06_9000006538_55605cztM0_level2_quad_clean.evt |
| Size (bytes) | 498,723,840 | 85,714,560 |
| Size | 475.6 MB | 81.7 MB |
| Events in quadrant A | 8,315,344 | 467,350 |
| Events in quadrant B | 2,612,088 | 634,902 |
| Events in quadrant C | 2,899,711 | 552,627 |
| Events in quadrant D | 4,158,217 | 512,912 |
| Mode M9 | |||
|---|---|---|---|
| Quadrant | BADHDUFLAG | Total packets | Discarded packets |
| A | 0 | 11 | 0 |
| B | 0 | 11 | 0 |
| C | 0 | 11 | 0 |
| D | 0 | 11 | 0 |
| Mode M0 | |||
|---|---|---|---|
| Quadrant | BADHDUFLAG | Total packets | Discarded packets |
| A | 0 | 29024 | 2 |
| B | 0 | 12504 | 1 |
| C | 0 | 13381 | 1 |
| D | 0 | 16736 | 1 |
| Mode SS | |||
|---|---|---|---|
| Quadrant | BADHDUFLAG | Total packets | Discarded packets |
| A | 0 | 124 | 0 |
| B | 0 | 124 | 0 |
| C | 0 | 124 | 0 |
| D | 0 | 124 | 0 |
| Quadrant | Total seconds | Saturated seconds | Saturation percentage |
|---|---|---|---|
| A | 6123 | 1504 | 24.563123% |
| B | 6123 | 55 | 0.898252% |
| C | 6124 | 88 | 1.436969% |
| D | 6124 | 210 | 3.429131% |
Noise dominated data is calculated using 1-second bins in cleaned event files. If a bin has >2000 counts, and if more than 50% of those come from <1% of pixels, then it is considered to be noise-dominated and hence unusable.
| Quadrant | # 1 sec bins | Bins with >0 counts | Bins with >2000 counts | High rate bins dominated by noise | Noise dominated (total time) | Noise dominated (detector-on time) | Marked lightcurve |
|---|---|---|---|---|---|---|---|
| A | 7228 | 6124 | 1480 | 1480 | 20.48% | 24.17% | 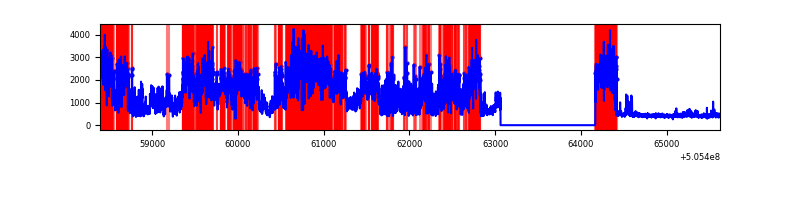 |
| B | 7228 | 6124 | 4 | 4 | 0.06% | 0.07% | 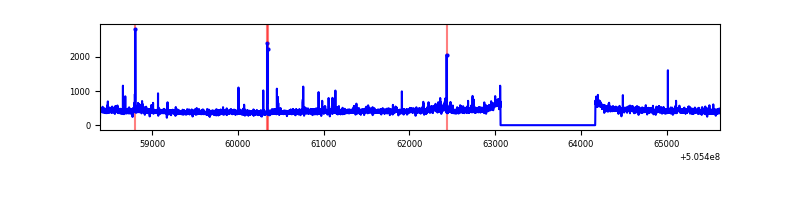 |
| C | 7229 | 6125 | 50 | 50 | 0.69% | 0.82% | 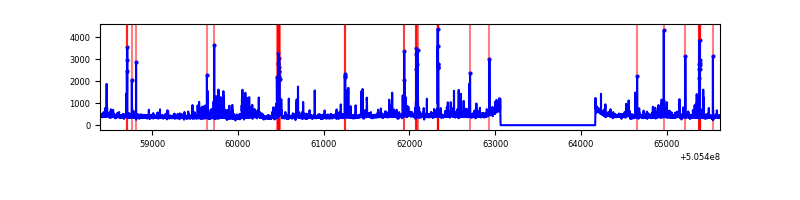 |
| D | 7229 | 6125 | 222 | 222 | 3.07% | 3.62% | 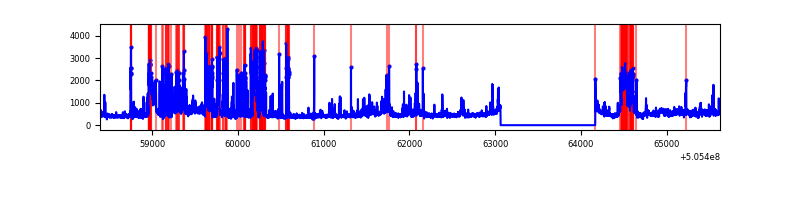 |
Top three noisy pixels from each quadrant. If the there are fewer than three noisy pixels in the level2.evt file, extra rows are filled as -1
| Pixel properties | Quadrant properties | ||||||
|---|---|---|---|---|---|---|---|
| Quadrant | DetID | PixID | Counts | Sigma | Mean | Median | Sigma |
| A | 12 | 115 | 5583549 | 38333.44 | 587 | 572 | 145.6 |
| A | 3 | 14 | 208697 | 1429.01 | 587 | 572 | 145.6 |
| A | 8 | 249 | 94314 | 643.64 | 587 | 572 | 145.6 |
| B | 5 | 248 | 48702 | 359.48 | 628 | 605 | 133.8 |
| B | 10 | 247 | 29455 | 215.63 | 628 | 605 | 133.8 |
| B | 12 | 111 | 15926 | 114.51 | 628 | 605 | 133.8 |
| C | 15 | 178 | 124699 | 741.66 | 609 | 601 | 167.3 |
| C | 10 | 19 | 114180 | 678.79 | 609 | 601 | 167.3 |
| C | 13 | 3 | 92653 | 550.14 | 609 | 601 | 167.3 |
| D | 8 | 160 | 852333 | 4975.34 | 606 | 578 | 171.2 |
| D | 2 | 62 | 386836 | 2256.24 | 606 | 578 | 171.2 |
| D | 11 | 129 | 317175 | 1849.33 | 606 | 578 | 171.2 |
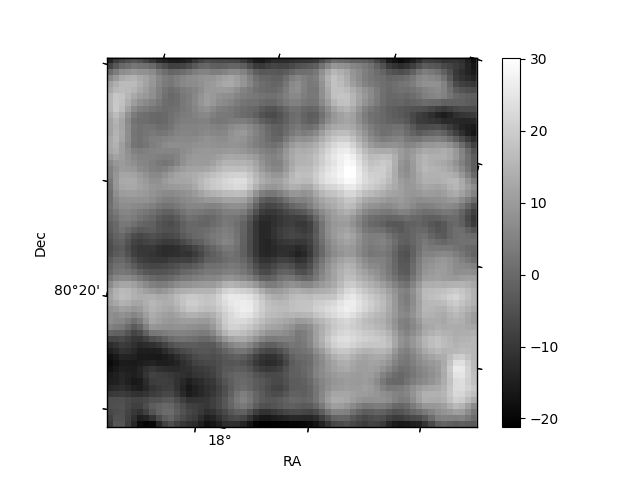
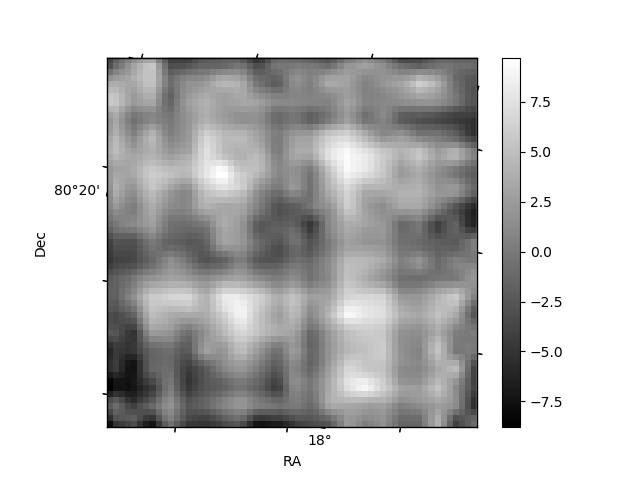
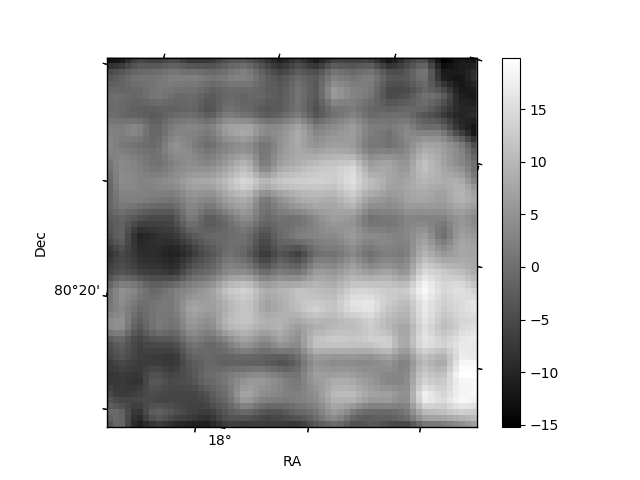
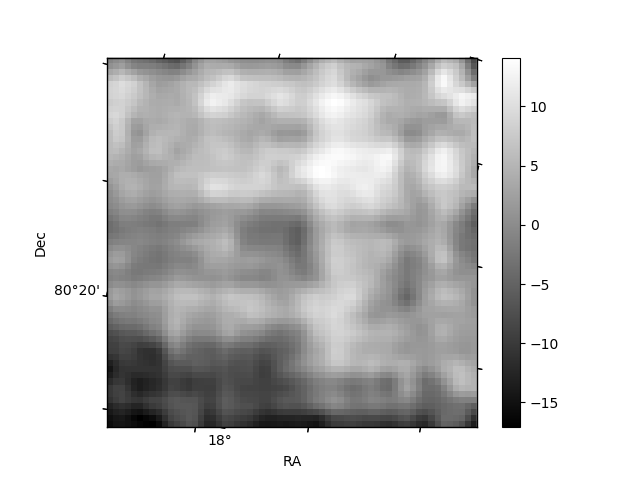
Histogram calculated using DETX and DETY for each event in the final _common_clean file
| Quadrant A | 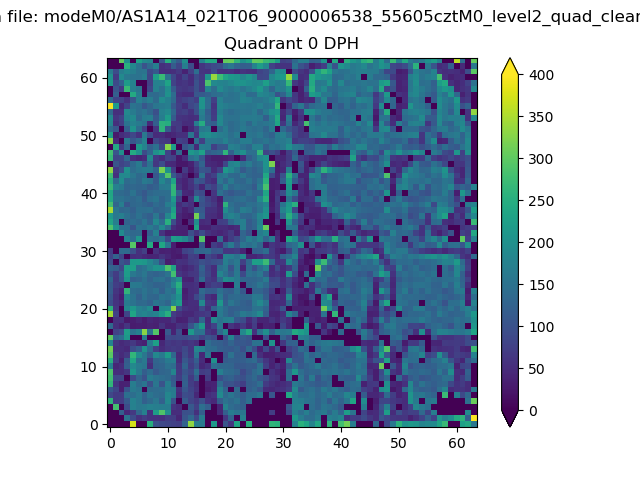 |
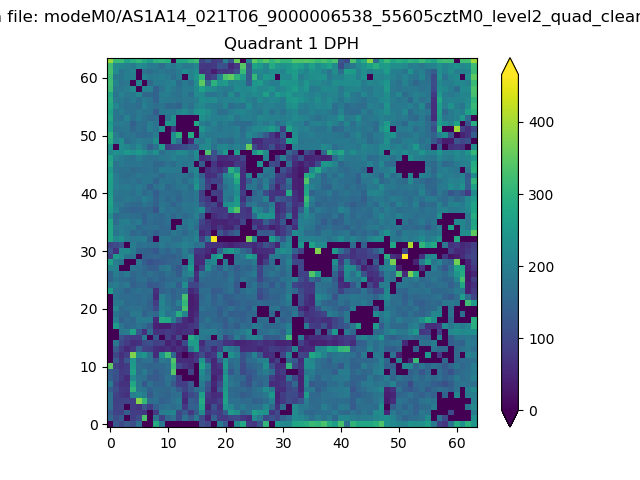 |
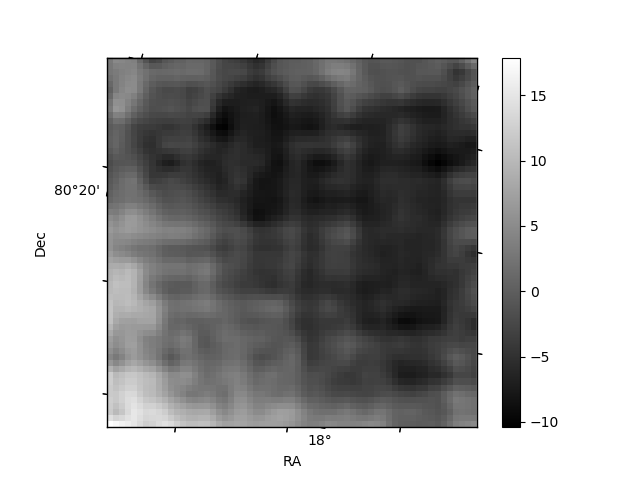
Quadrant B |
|---|---|---|---|
| Quadrant D | 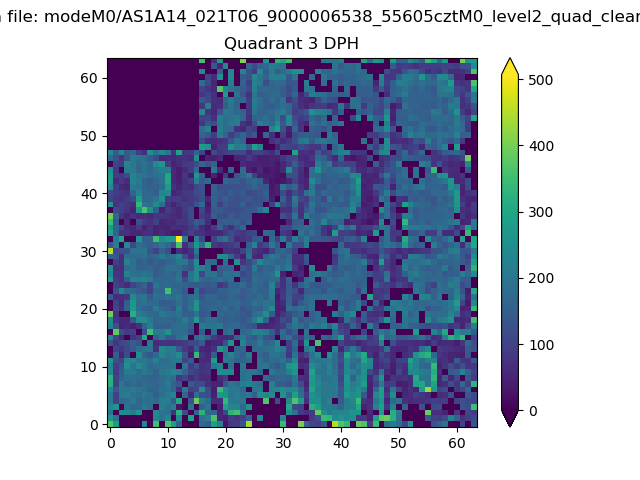 |
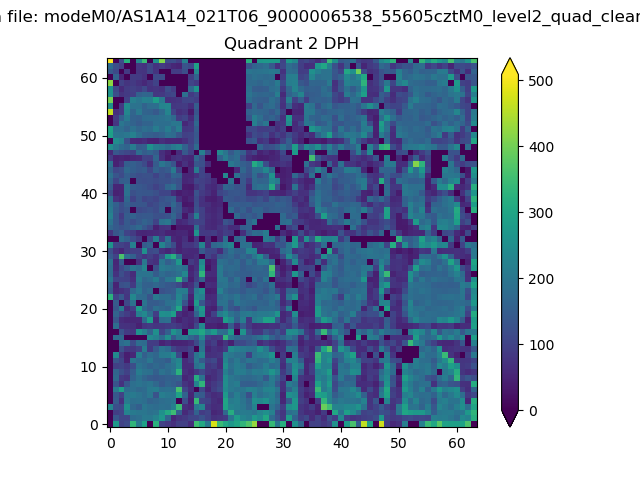 |
Quadrant C |
| Plot type | Count rate plots | Images |
|---|---|---|
| Comparison with Poisson distribution Blue bars denote a histogram of data divided into 1 sec bins. Red curve is a Poisson curve with rate = median count rate of data. |
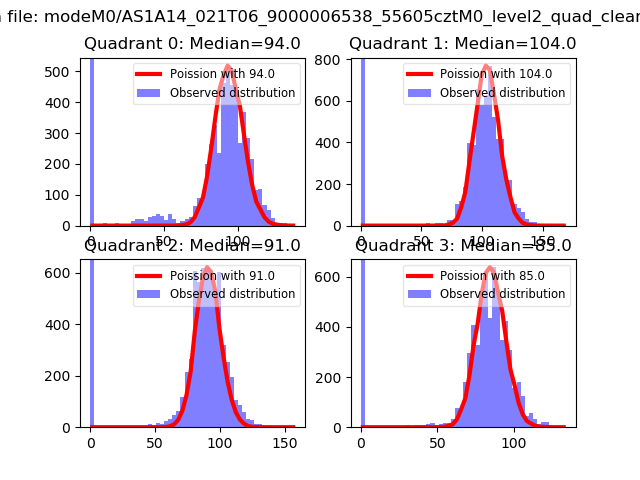 |
 |
| Quadrant-wise count rates Data is divided into 100 sec bins |
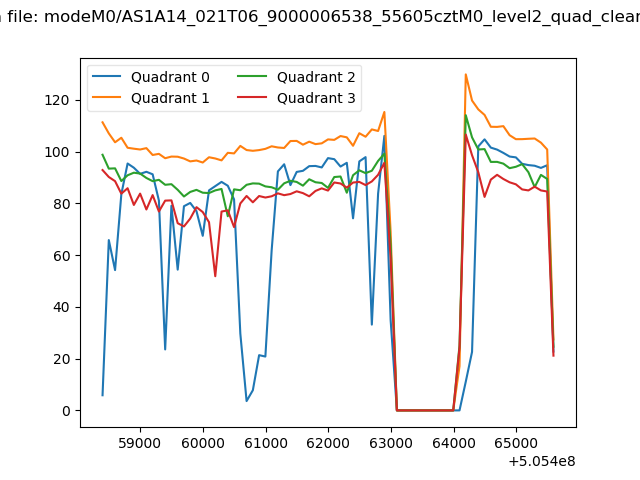 |
|
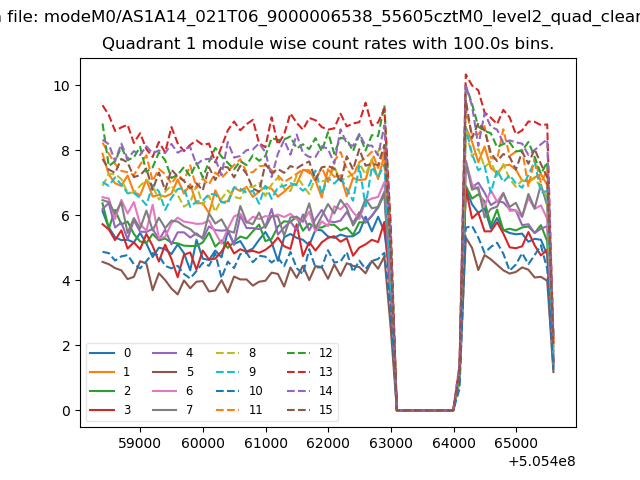
| Module-wise count rates for Quadrant A Data is divided into 100 sec bins |
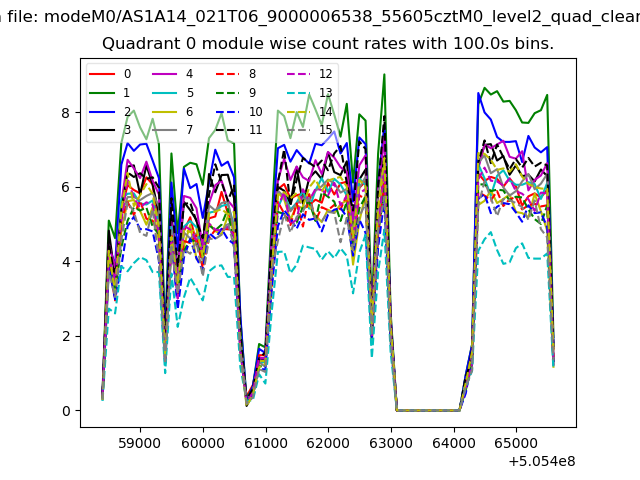 |
 |
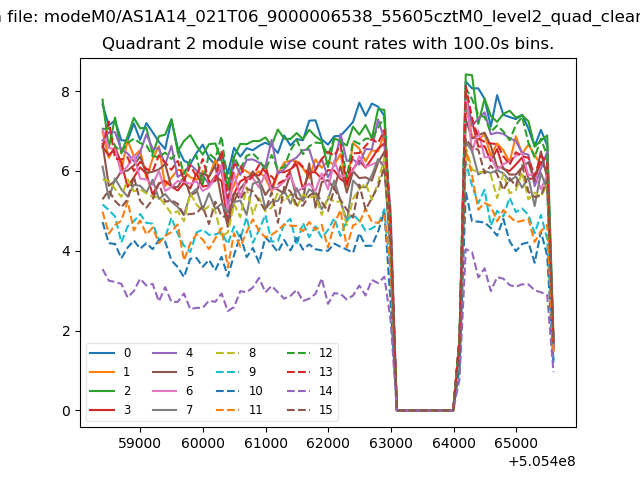
| Module-wise count rates for Quadrant B Data is divided into 100 sec bins |
 |
 |
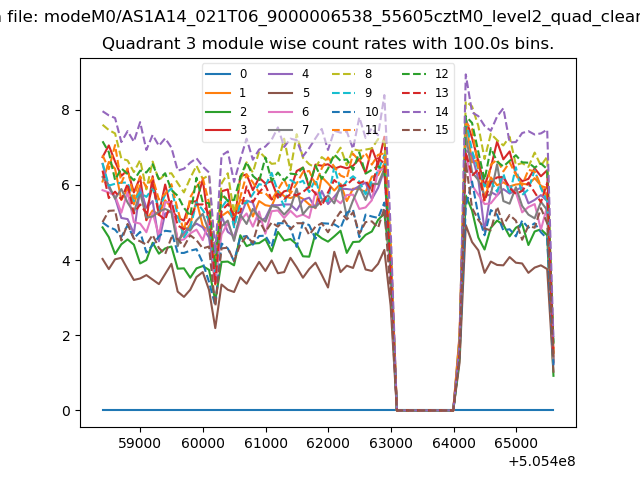
| Module-wise count rates for Quadrant C Data is divided into 100 sec bins |
 |
 |
| Module-wise count rates for Quadrant D Data is divided into 100 sec bins |
 |
 |
| Parameter | Plot |
|---|---|
| CZT HV Monitor | 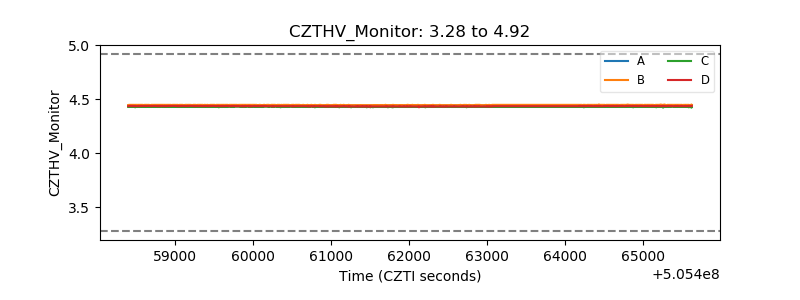 |
| D_VDD | 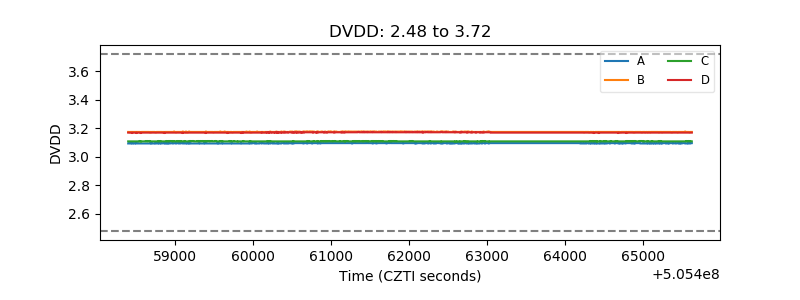 |
| Temperature 1 | 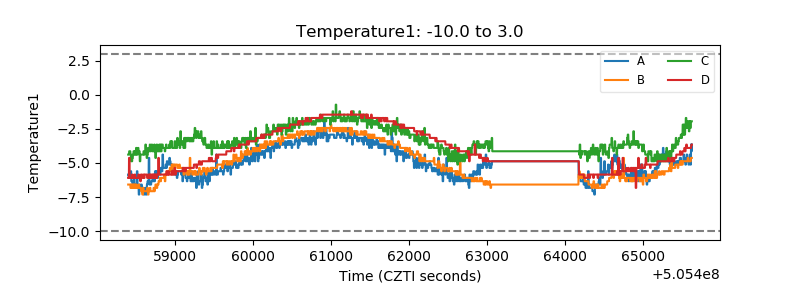 |
| Veto HV Monitor | 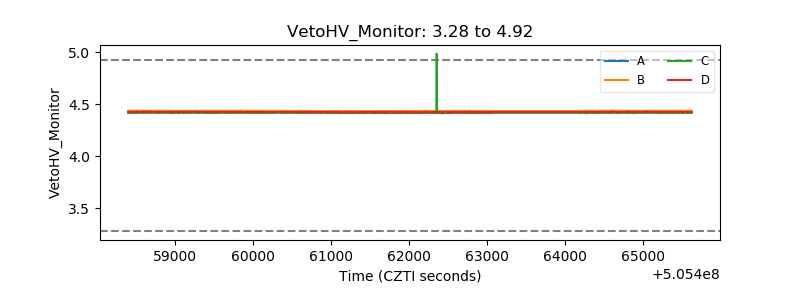 |
| Veto LLD | 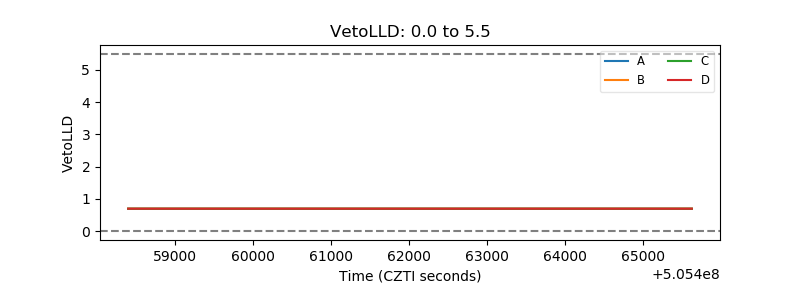 |
| Alpha Counter | 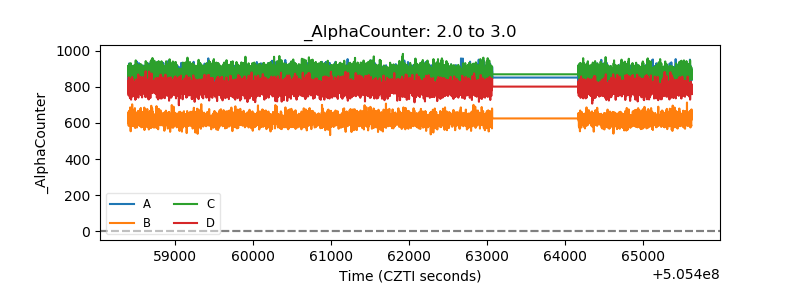 |
| _CPM_Rate | 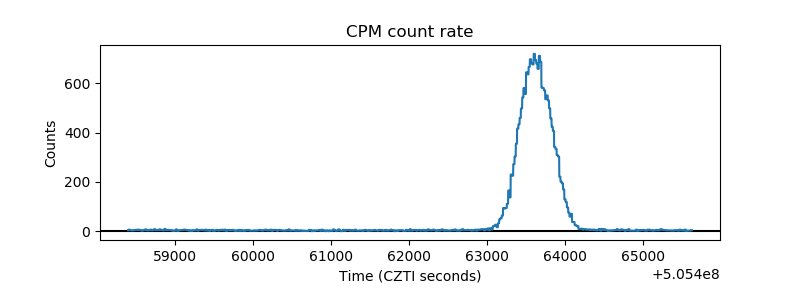 |
| CZT Counter | 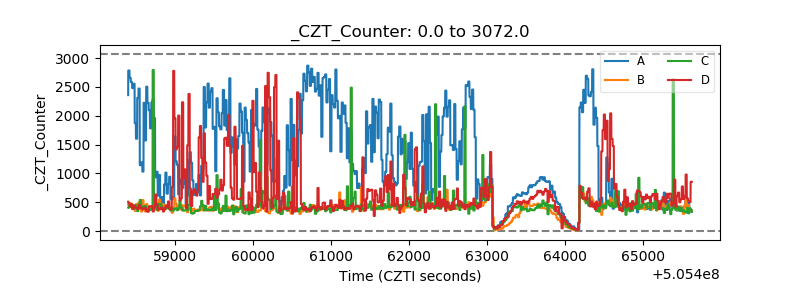 |
| +2.5 Volts monitor | 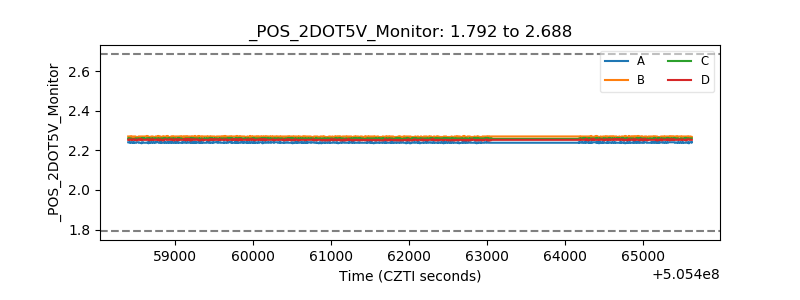 |
| +5 Volts monitor | 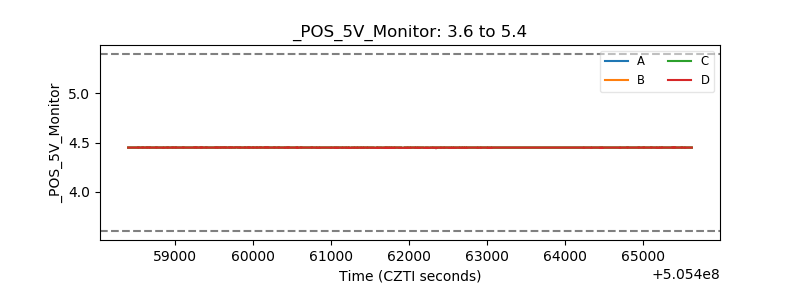 |
| _ROLL_ROT | 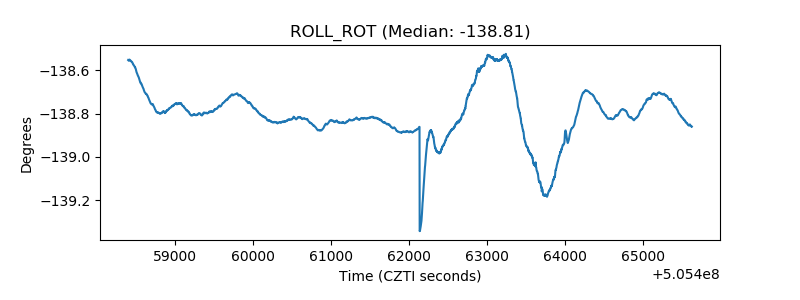 |
| _Roll_DEC | 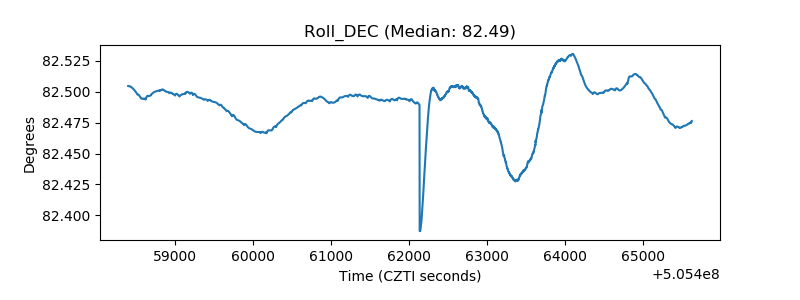 |
| _Roll_RA | 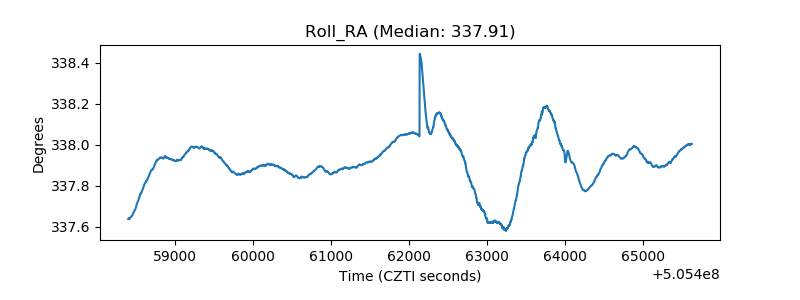 |
| Veto Counter | 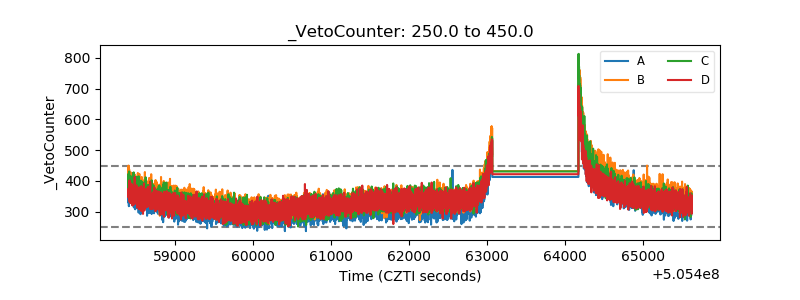 |