| Param | Original file | Final file |
|---|---|---|
| Filename | modeM0/AS1A14_021T06_9000006538_55608cztM0_level2.fits | modeM0/AS1A14_021T06_9000006538_55608cztM0_level2_quad_clean.evt |
| Size (bytes) | 393,088,320 | 94,553,280 |
| Size | 374.9 MB | 90.2 MB |
| Events in quadrant A | 3,941,907 | 617,161 |
| Events in quadrant B | 2,863,365 | 662,942 |
| Events in quadrant C | 3,029,499 | 583,156 |
| Events in quadrant D | 4,203,032 | 540,061 |
| Mode M9 | |||
|---|---|---|---|
| Quadrant | BADHDUFLAG | Total packets | Discarded packets |
| A | 0 | 9 | 0 |
| B | 0 | 9 | 0 |
| C | 0 | 9 | 0 |
| D | 0 | 9 | 0 |
| Mode M0 | |||
|---|---|---|---|
| Quadrant | BADHDUFLAG | Total packets | Discarded packets |
| A | 0 | 16222 | 1 |
| B | 0 | 13681 | 1 |
| C | 0 | 14339 | 1 |
| D | 0 | 17178 | 5 |
| Mode SS | |||
|---|---|---|---|
| Quadrant | BADHDUFLAG | Total packets | Discarded packets |
| A | 0 | 134 | 0 |
| B | 0 | 134 | 0 |
| C | 0 | 134 | 0 |
| D | 0 | 134 | 0 |
| Quadrant | Total seconds | Saturated seconds | Saturation percentage |
|---|---|---|---|
| A | 6592 | 89 | 1.350121% |
| B | 6593 | 71 | 1.076900% |
| C | 6593 | 66 | 1.001062% |
| D | 6592 | 228 | 3.458738% |
Noise dominated data is calculated using 1-second bins in cleaned event files. If a bin has >2000 counts, and if more than 50% of those come from <1% of pixels, then it is considered to be noise-dominated and hence unusable.
| Quadrant | # 1 sec bins | Bins with >0 counts | Bins with >2000 counts | High rate bins dominated by noise | Noise dominated (total time) | Noise dominated (detector-on time) | Marked lightcurve |
|---|---|---|---|---|---|---|---|
| A | 7492 | 6593 | 18 | 18 | 0.24% | 0.27% | 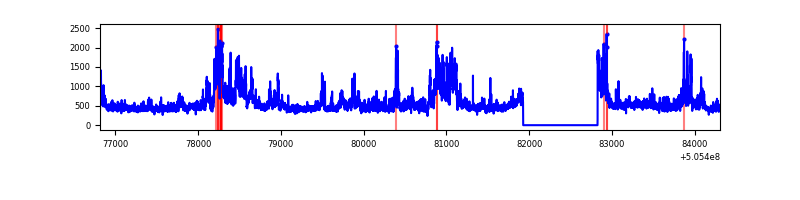 |
| B | 7493 | 6594 | 26 | 26 | 0.35% | 0.39% | 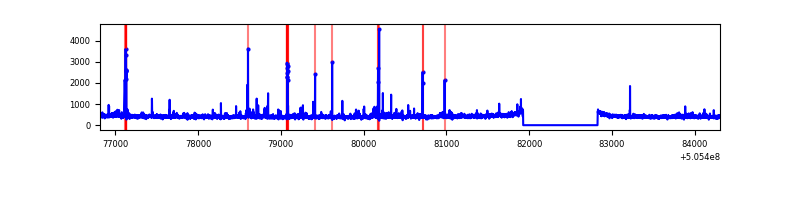 |
| C | 7493 | 6594 | 49 | 49 | 0.65% | 0.74% | 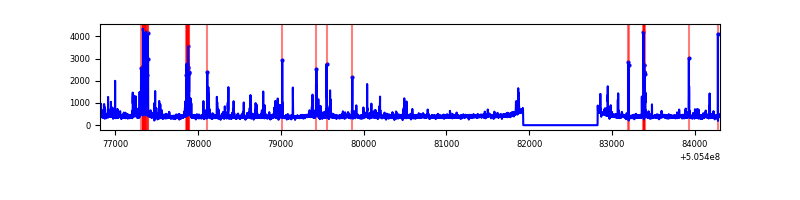 |
| D | 7492 | 6593 | 171 | 171 | 2.28% | 2.59% | 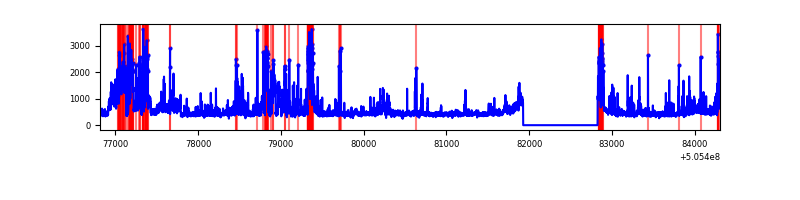 |
Top three noisy pixels from each quadrant. If the there are fewer than three noisy pixels in the level2.evt file, extra rows are filled as -1
| Pixel properties | Quadrant properties | ||||||
|---|---|---|---|---|---|---|---|
| Quadrant | DetID | PixID | Counts | Sigma | Mean | Median | Sigma |
| A | 12 | 115 | 875971 | 5258.38 | 677 | 660 | 166.5 |
| A | 8 | 249 | 176810 | 1058.21 | 677 | 660 | 166.5 |
| A | 3 | 14 | 112393 | 671.23 | 677 | 660 | 166.5 |
| B | 4 | 67 | 35470 | 245.84 | 664 | 638 | 141.7 |
| B | 7 | 252 | 29451 | 203.36 | 664 | 638 | 141.7 |
| B | 0 | 143 | 27821 | 191.86 | 664 | 638 | 141.7 |
| C | 13 | 3 | 197640 | 1105.48 | 648 | 639 | 178.2 |
| C | 10 | 19 | 114100 | 636.69 | 648 | 639 | 178.2 |
| C | 12 | 250 | 50988 | 282.53 | 648 | 639 | 178.2 |
| D | 11 | 129 | 586789 | 3225.28 | 647 | 618 | 181.7 |
| D | 2 | 62 | 529343 | 2909.19 | 647 | 618 | 181.7 |
| D | 2 | 249 | 106078 | 580.27 | 647 | 618 | 181.7 |
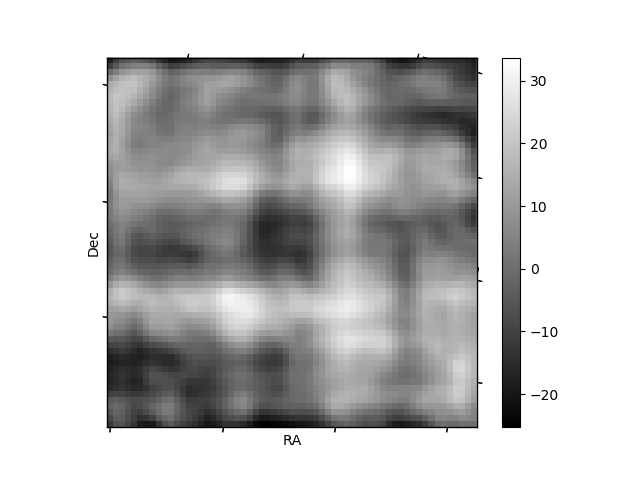
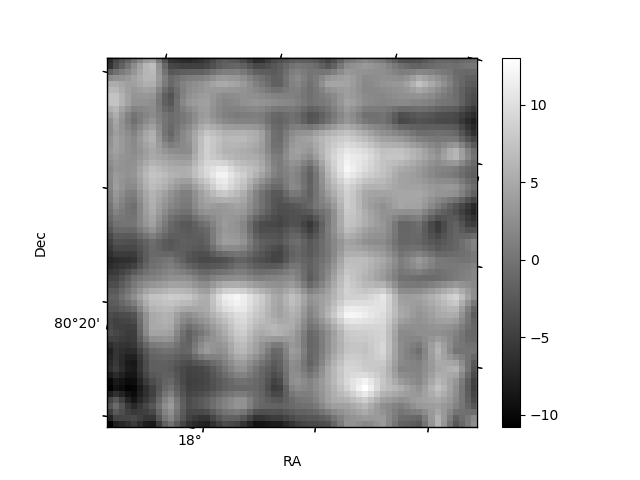
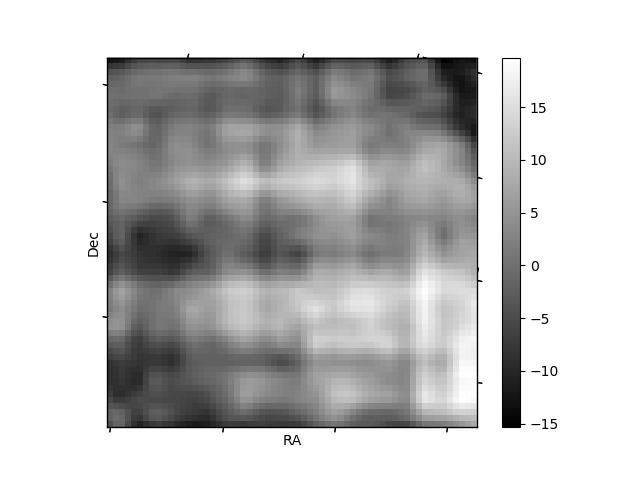
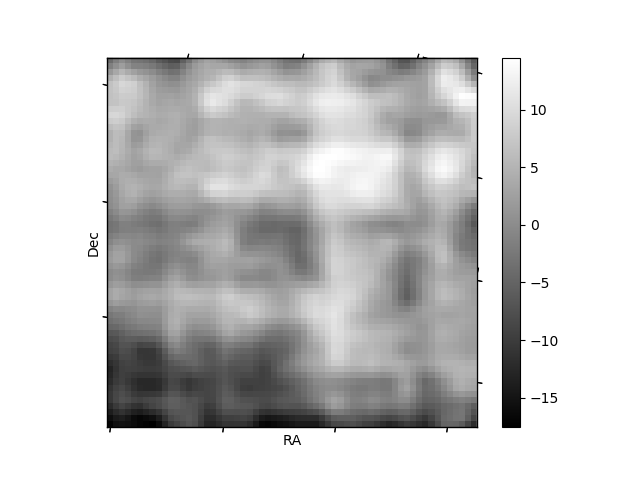
Histogram calculated using DETX and DETY for each event in the final _common_clean file
| Quadrant A | 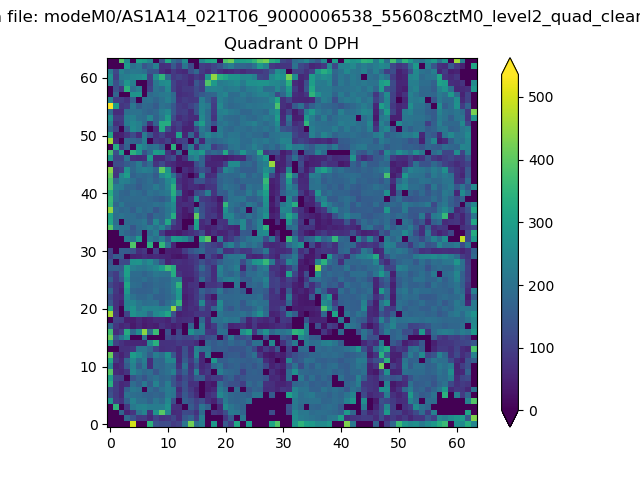 |
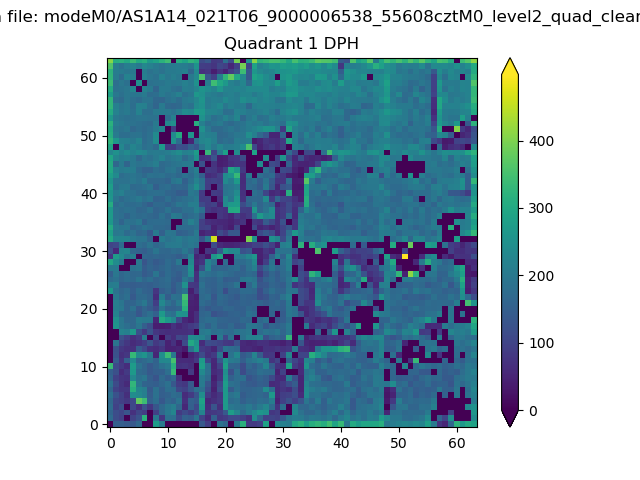 |
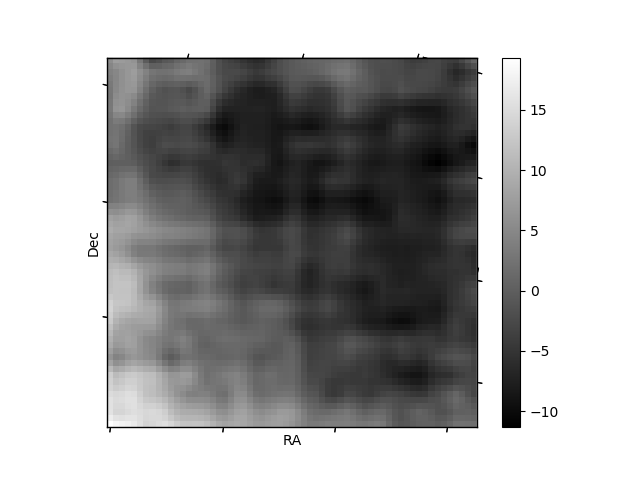
Quadrant B |
|---|---|---|---|
| Quadrant D | 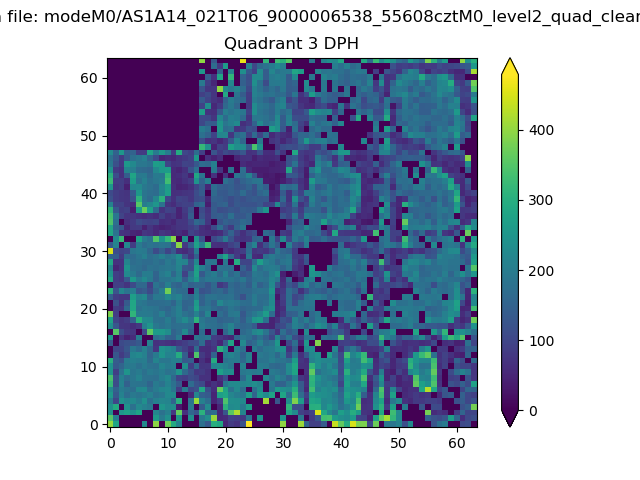 |
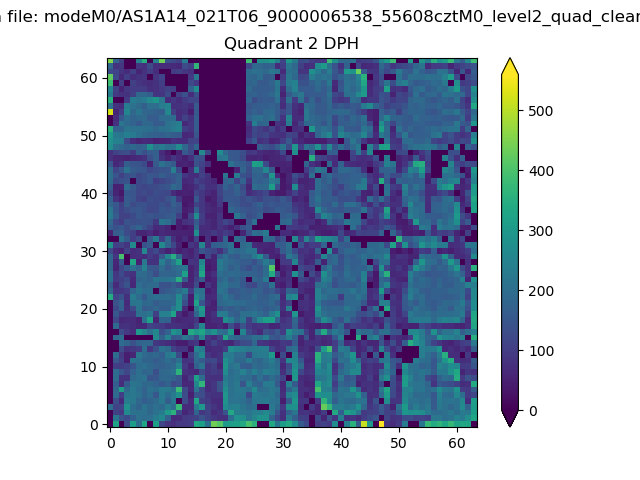 |
Quadrant C |
| Plot type | Count rate plots | Images |
|---|---|---|
| Comparison with Poisson distribution Blue bars denote a histogram of data divided into 1 sec bins. Red curve is a Poisson curve with rate = median count rate of data. |
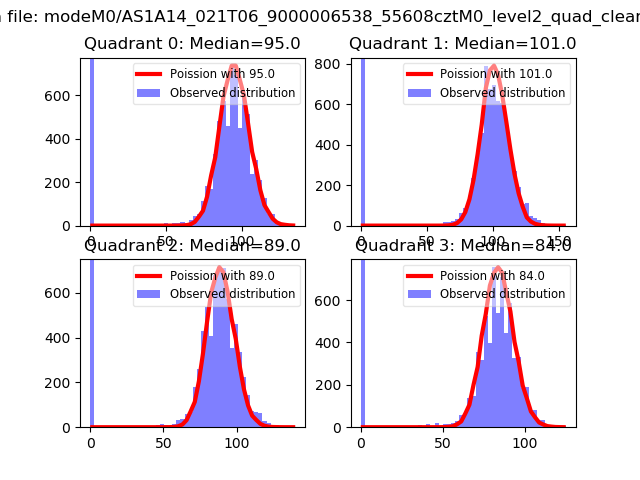 |
 |
| Quadrant-wise count rates Data is divided into 100 sec bins |
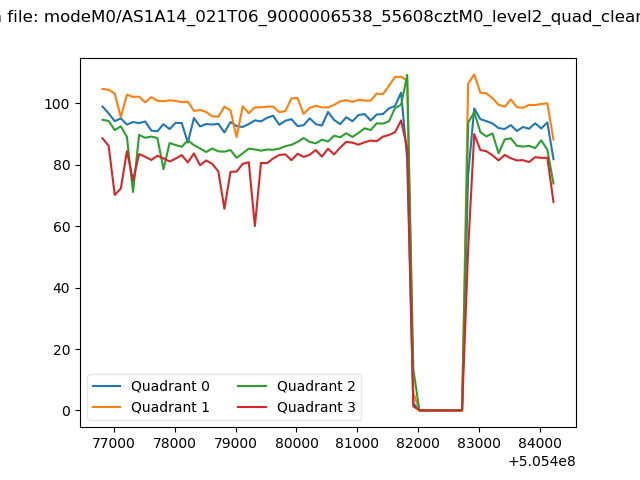 |
|
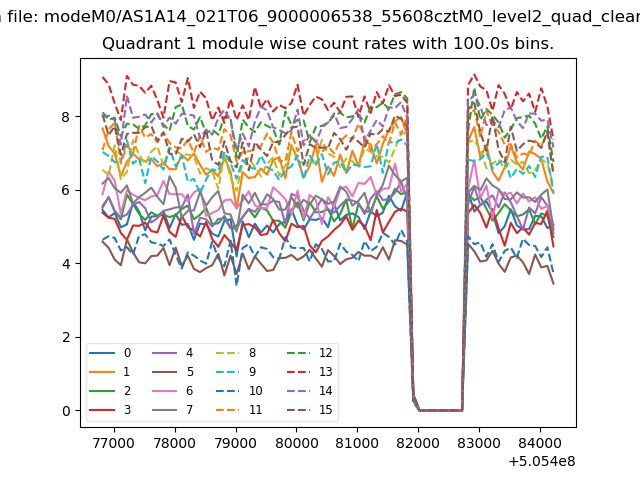
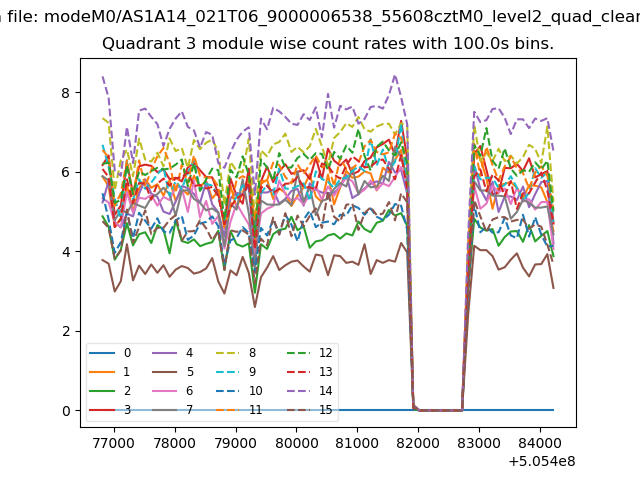
| Module-wise count rates for Quadrant A Data is divided into 100 sec bins |
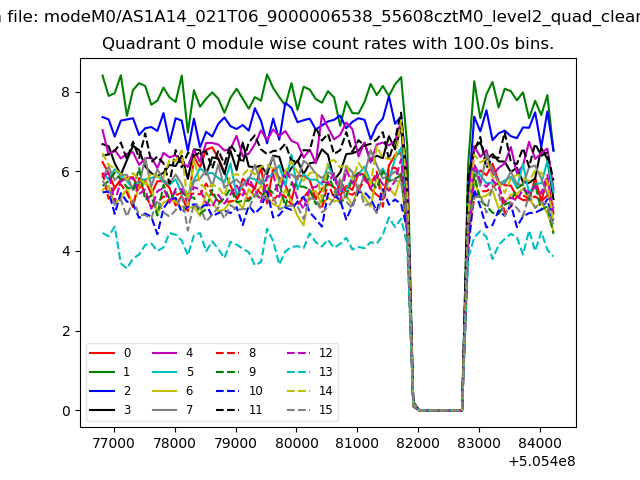 |
 |
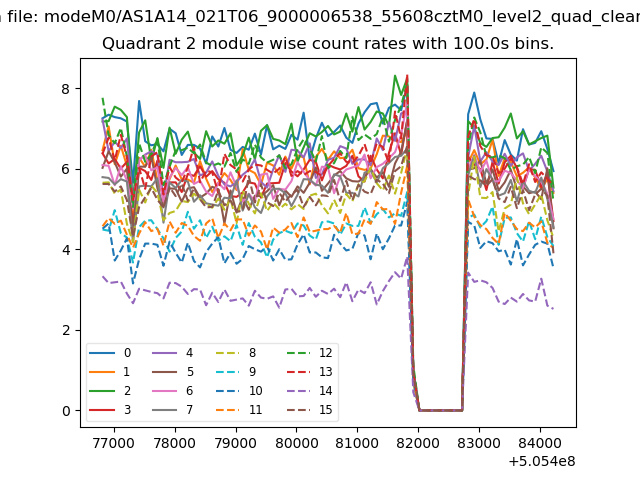
| Module-wise count rates for Quadrant B Data is divided into 100 sec bins |
 |
 |
| Module-wise count rates for Quadrant C Data is divided into 100 sec bins |
 |
 |
| Module-wise count rates for Quadrant D Data is divided into 100 sec bins |
 |
 |
| Parameter | Plot |
|---|---|
| CZT HV Monitor | 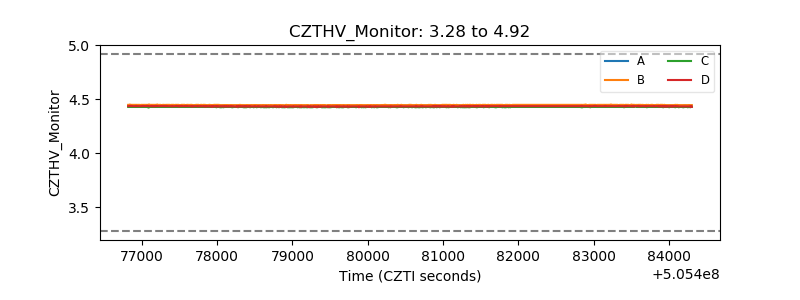 |
| D_VDD | 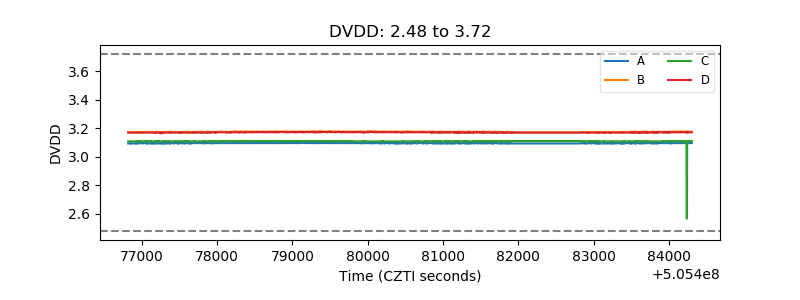 |
| Temperature 1 | 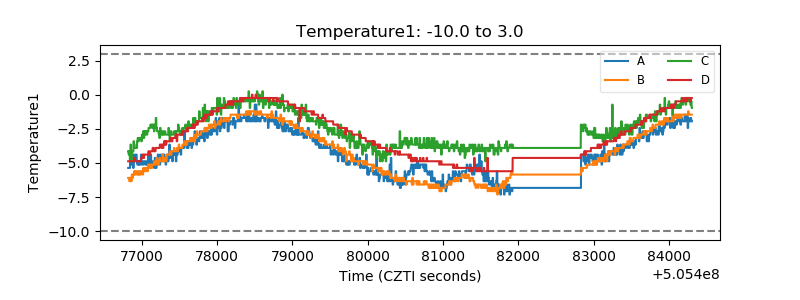 |
| Veto HV Monitor |  |
| Veto LLD | 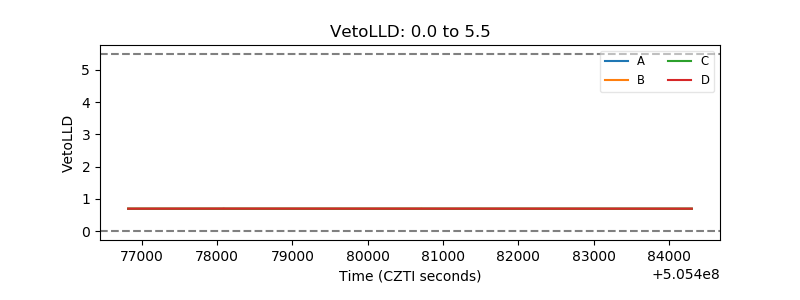 |
| Alpha Counter | 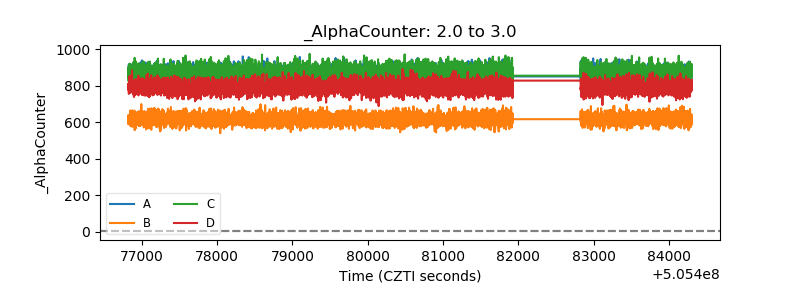 |
| _CPM_Rate | 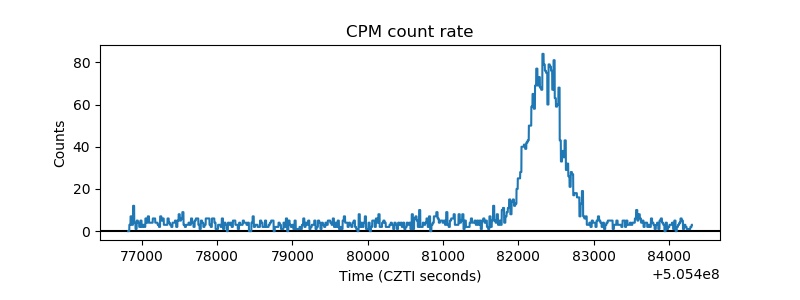 |
| CZT Counter | 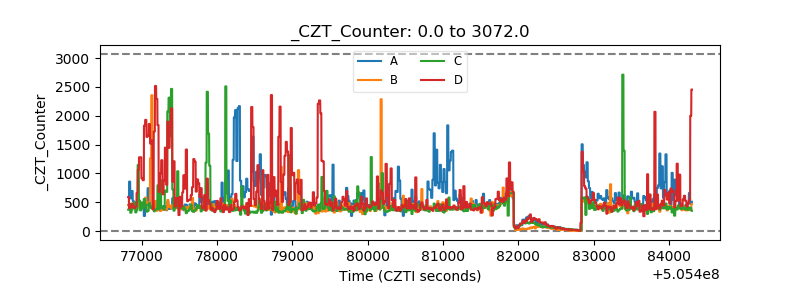 |
| +2.5 Volts monitor |  |
| +5 Volts monitor |  |
| _ROLL_ROT | 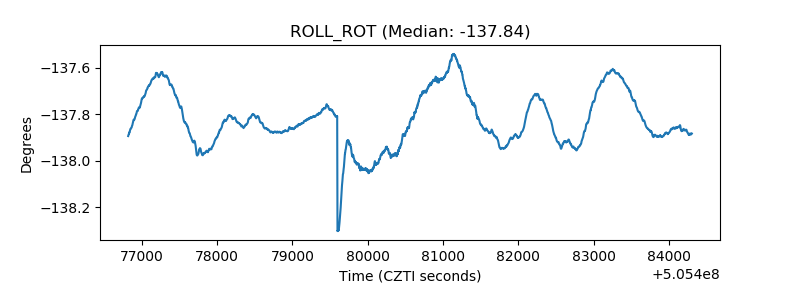 |
| _Roll_DEC | 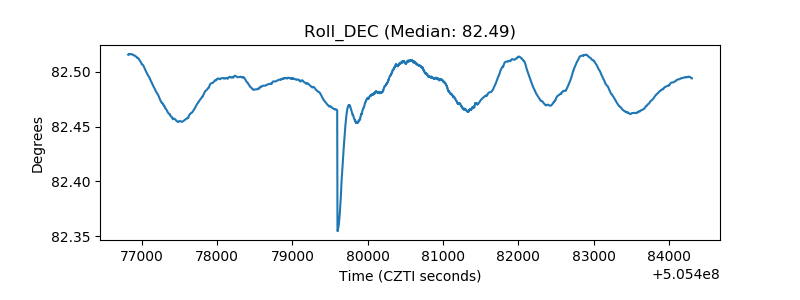 |
| _Roll_RA | 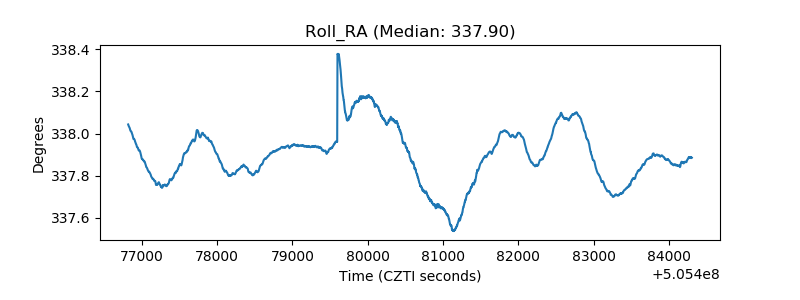 |
| Veto Counter | 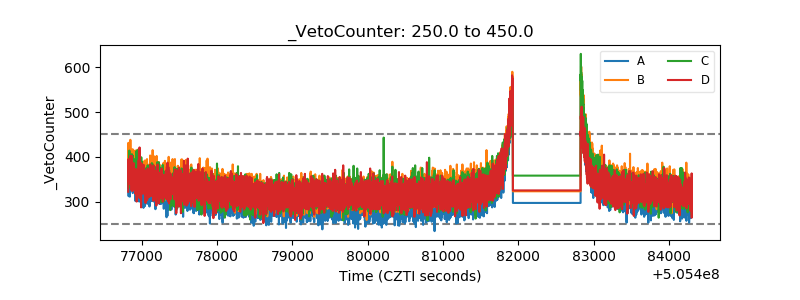 |