| Param | Original file | Final file |
|---|---|---|
| Filename | modeM0/AS1A14_021T06_9000006538_55610cztM0_level2.fits | modeM0/AS1A14_021T06_9000006538_55610cztM0_level2_quad_clean.evt |
| Size (bytes) | 454,063,680 | 106,369,920 |
| Size | 433.0 MB | 101.4 MB |
| Events in quadrant A | 3,830,368 | 695,053 |
| Events in quadrant B | 3,776,459 | 733,475 |
| Events in quadrant C | 4,109,785 | 648,719 |
| Events in quadrant D | 4,506,324 | 619,932 |
| Mode M0 | |||
|---|---|---|---|
| Quadrant | BADHDUFLAG | Total packets | Discarded packets |
| A | 0 | 16756 | 0 |
| B | 0 | 17080 | 0 |
| C | 0 | 17843 | 0 |
| D | 0 | 18658 | 0 |
| Mode SS | |||
|---|---|---|---|
| Quadrant | BADHDUFLAG | Total packets | Discarded packets |
| A | 0 | 150 | 0 |
| B | 0 | 150 | 0 |
| C | 0 | 150 | 0 |
| D | 0 | 150 | 0 |
| Quadrant | Total seconds | Saturated seconds | Saturation percentage |
|---|---|---|---|
| A | 7526 | 59 | 0.783949% |
| B | 7526 | 189 | 2.511294% |
| C | 7526 | 129 | 1.714058% |
| D | 7526 | 80 | 1.062982% |
Noise dominated data is calculated using 1-second bins in cleaned event files. If a bin has >2000 counts, and if more than 50% of those come from <1% of pixels, then it is considered to be noise-dominated and hence unusable.
| Quadrant | # 1 sec bins | Bins with >0 counts | Bins with >2000 counts | High rate bins dominated by noise | Noise dominated (total time) | Noise dominated (detector-on time) | Marked lightcurve |
|---|---|---|---|---|---|---|---|
| A | 7526 | 7526 | 47 | 47 | 0.62% | 0.62% | 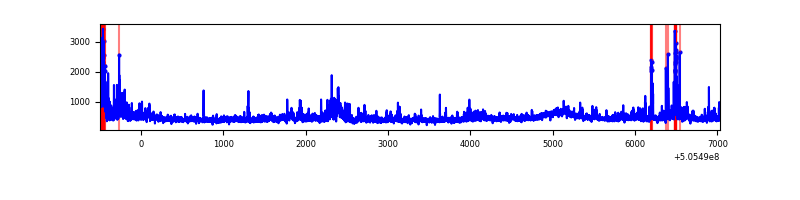 |
| B | 7526 | 7526 | 139 | 139 | 1.85% | 1.85% | 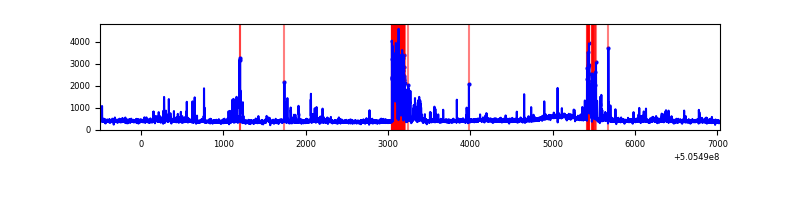 |
| C | 7526 | 7526 | 107 | 107 | 1.42% | 1.42% | 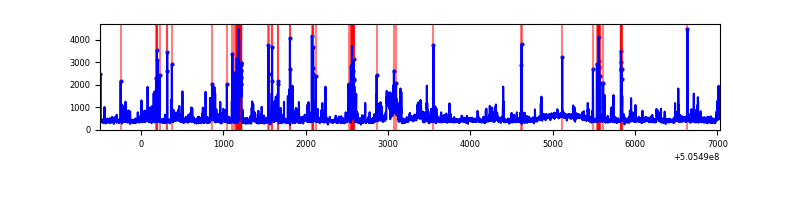 |
| D | 7526 | 7526 | 66 | 66 | 0.88% | 0.88% | 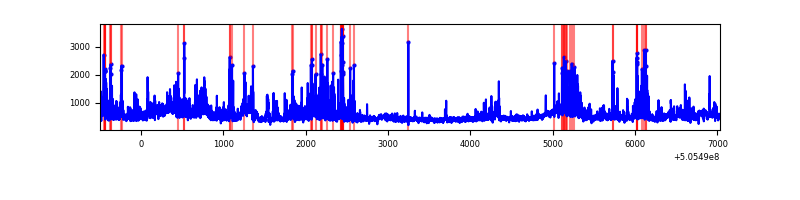 |
Top three noisy pixels from each quadrant. If the there are fewer than three noisy pixels in the level2.evt file, extra rows are filled as -1
| Pixel properties | Quadrant properties | ||||||
|---|---|---|---|---|---|---|---|
| Quadrant | DetID | PixID | Counts | Sigma | Mean | Median | Sigma |
| A | 12 | 115 | 241951 | 1257.21 | 778 | 758 | 191.8 |
| A | 8 | 249 | 197772 | 1026.93 | 778 | 758 | 191.8 |
| A | 4 | 159 | 150678 | 781.45 | 778 | 758 | 191.8 |
| B | 5 | 185 | 454561 | 2790.83 | 762 | 734 | 162.6 |
| B | 0 | 173 | 169520 | 1037.96 | 762 | 734 | 162.6 |
| B | 10 | 247 | 68528 | 416.9 | 762 | 734 | 162.6 |
| C | 9 | 38 | 443831 | 2172.25 | 752 | 746 | 204.0 |
| C | 13 | 3 | 278365 | 1361.04 | 752 | 746 | 204.0 |
| C | 12 | 252 | 93734 | 455.88 | 752 | 746 | 204.0 |
| D | 15 | 125 | 449392 | 2107.6 | 755 | 721 | 212.9 |
| D | 2 | 16 | 274457 | 1285.85 | 755 | 721 | 212.9 |
| D | 2 | 31 | 200449 | 938.21 | 755 | 721 | 212.9 |
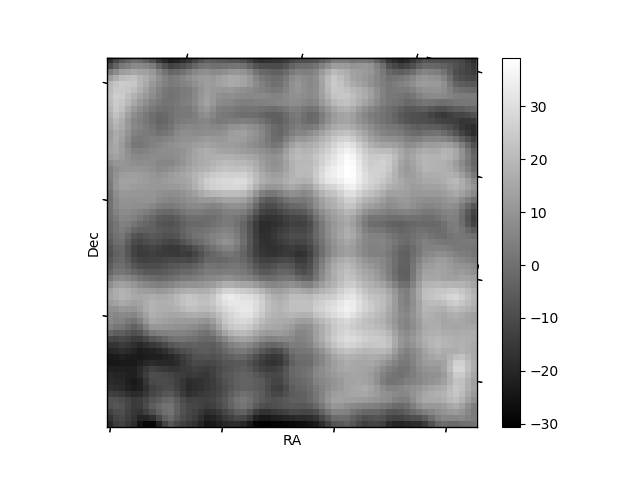
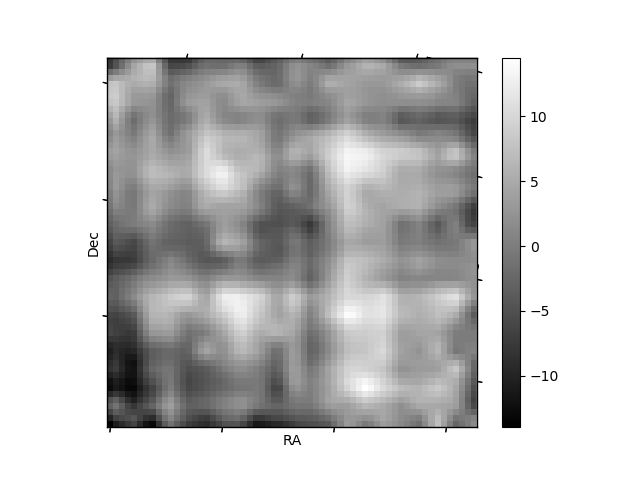
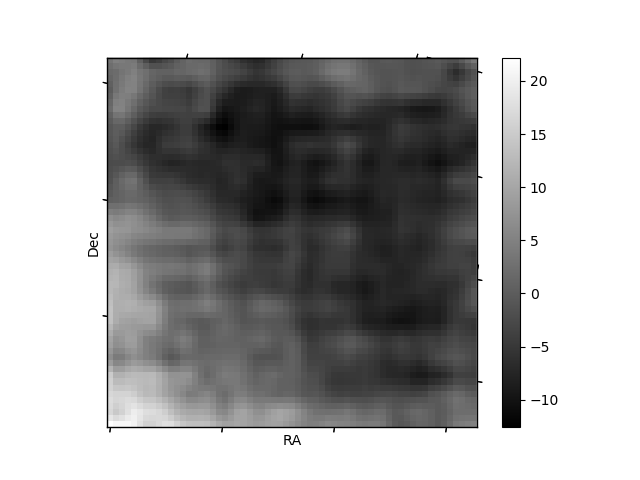
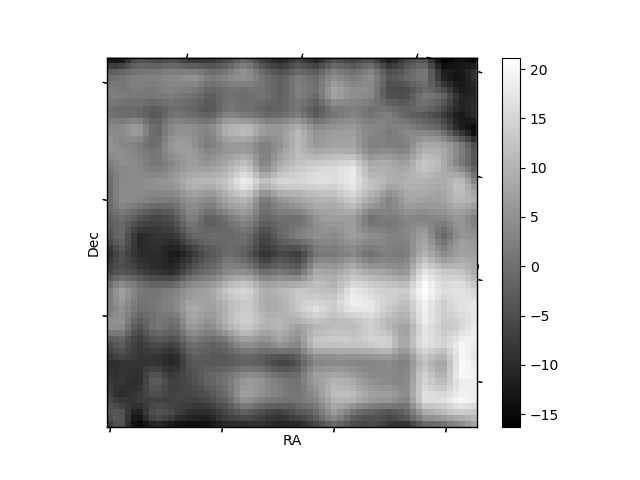
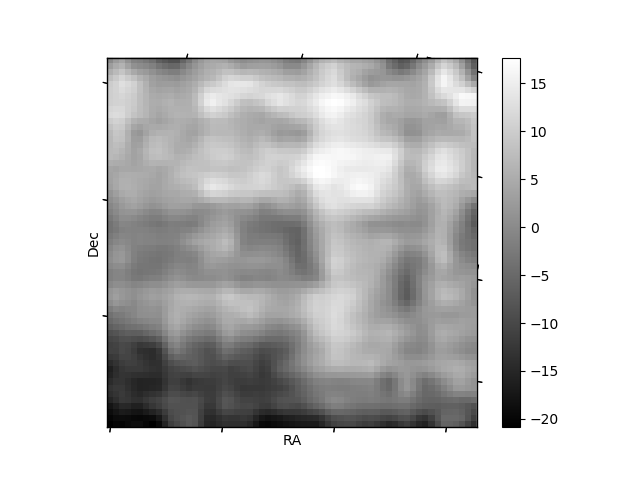
Histogram calculated using DETX and DETY for each event in the final _common_clean file
| Quadrant A | 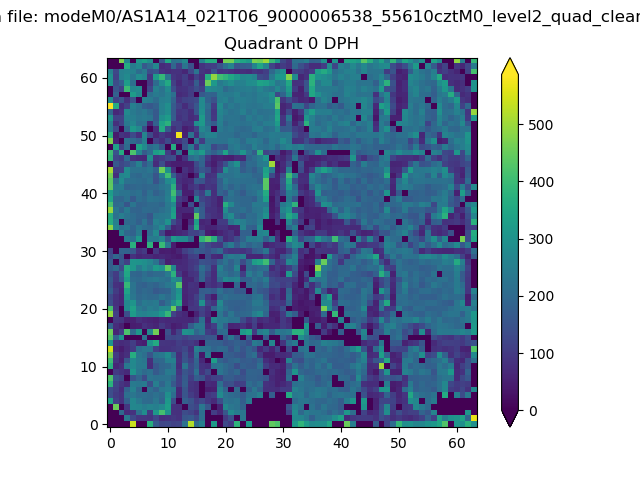 |
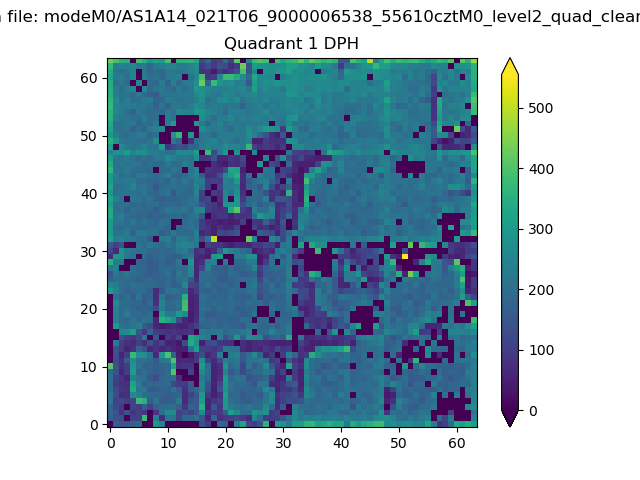 |
Quadrant B |
|---|---|---|---|
| Quadrant D | 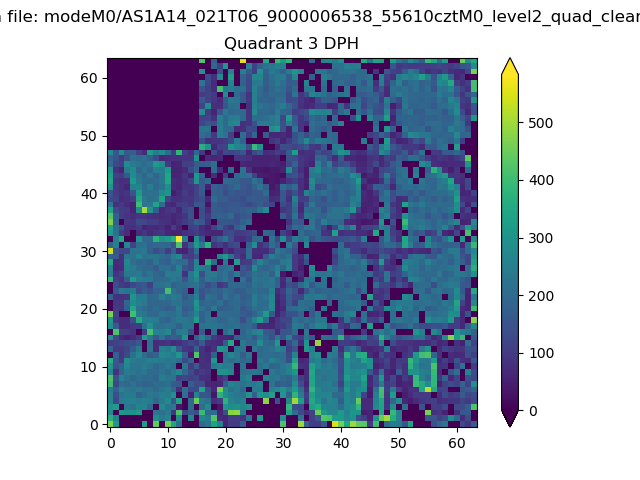 |
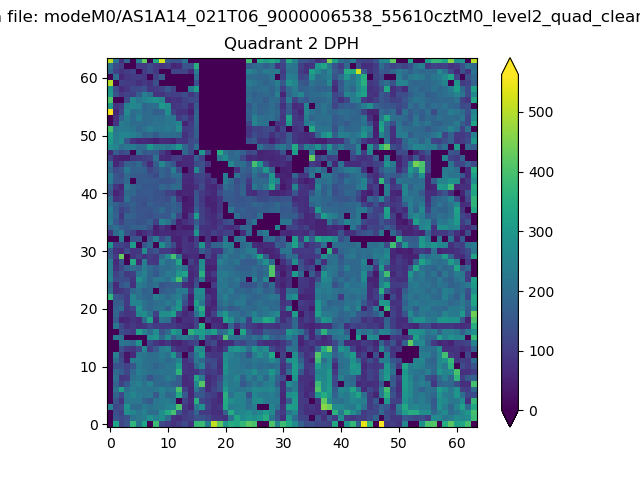 |
Quadrant C |
| Plot type | Count rate plots | Images |
|---|---|---|
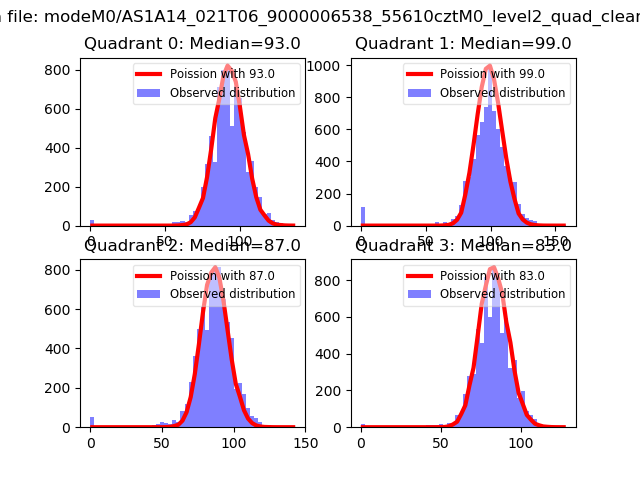
| Comparison with Poisson distribution Blue bars denote a histogram of data divided into 1 sec bins. Red curve is a Poisson curve with rate = median count rate of data. |
 |
 |
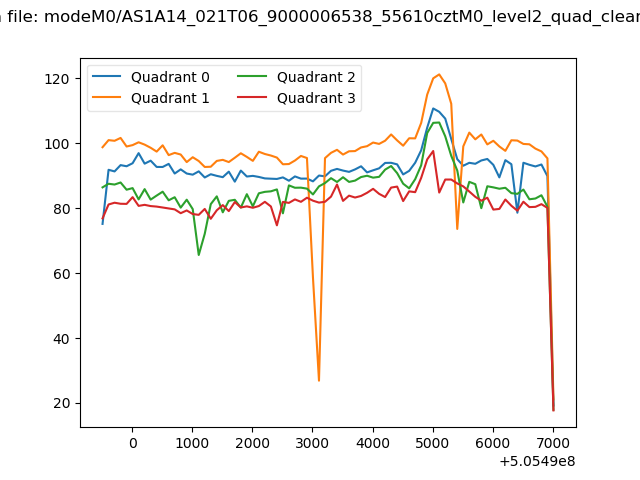
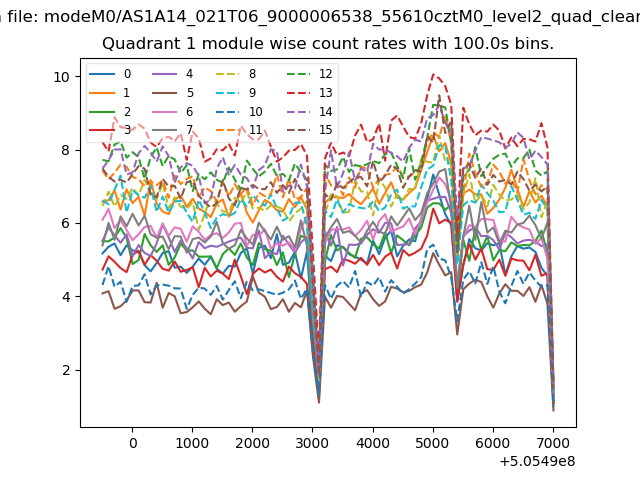
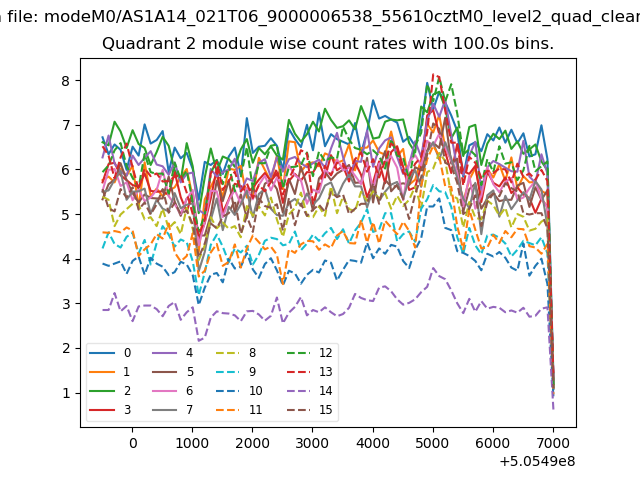
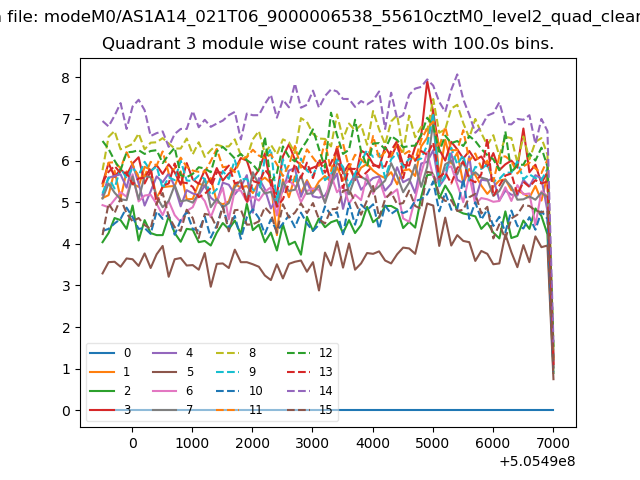
| Quadrant-wise count rates Data is divided into 100 sec bins |
 |
|
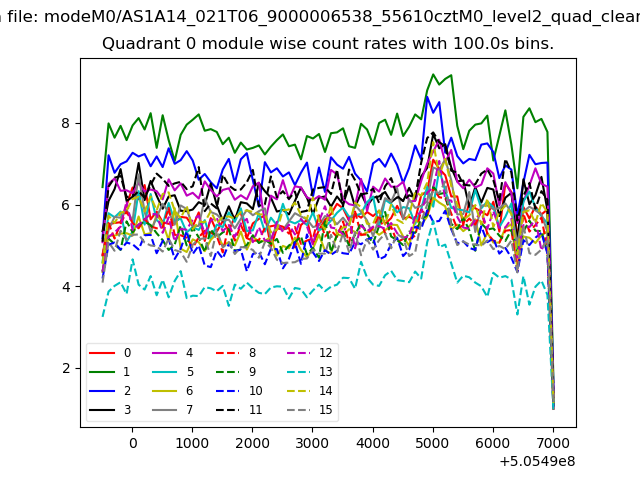
| Module-wise count rates for Quadrant A Data is divided into 100 sec bins |
 |
 |
| Module-wise count rates for Quadrant B Data is divided into 100 sec bins |
 |
 |
| Module-wise count rates for Quadrant C Data is divided into 100 sec bins |
 |
 |
| Module-wise count rates for Quadrant D Data is divided into 100 sec bins |
 |
 |
| Parameter | Plot |
|---|---|
| CZT HV Monitor | 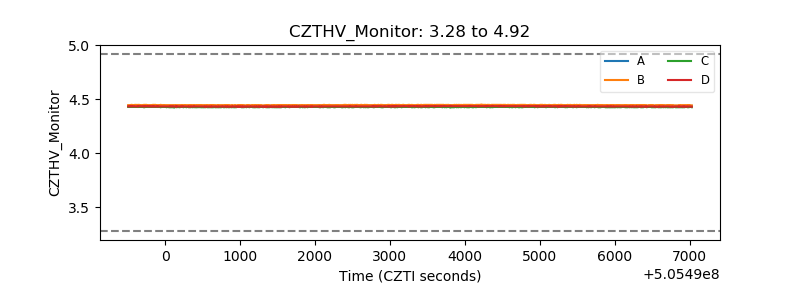 |
| D_VDD | 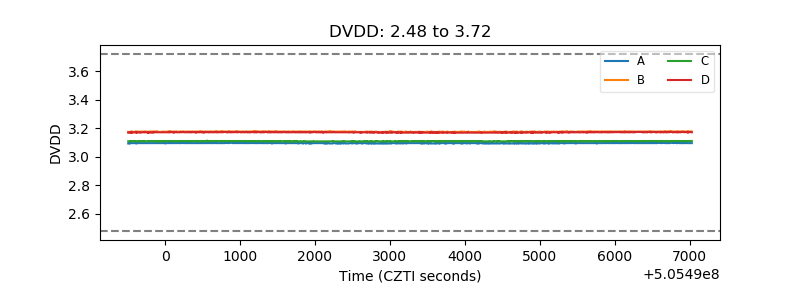 |
| Temperature 1 | 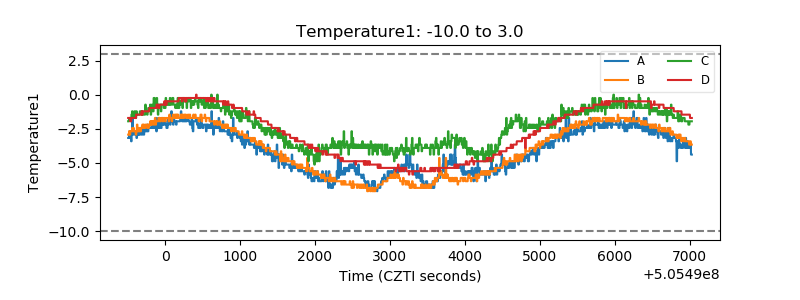 |
| Veto HV Monitor | 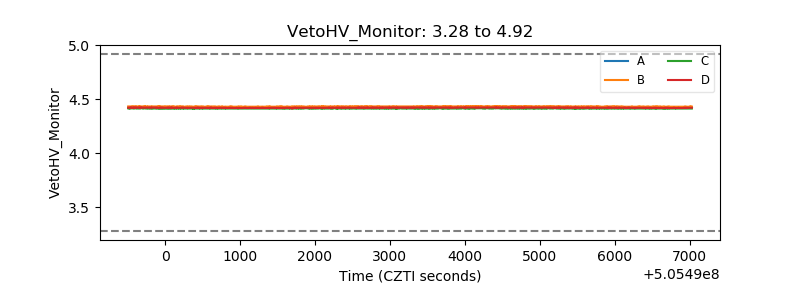 |
| Veto LLD | 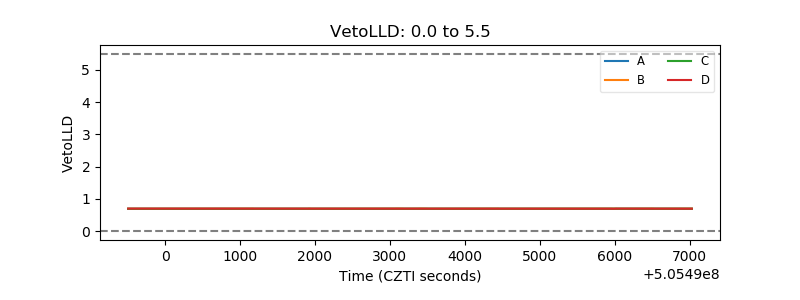 |
| Alpha Counter | 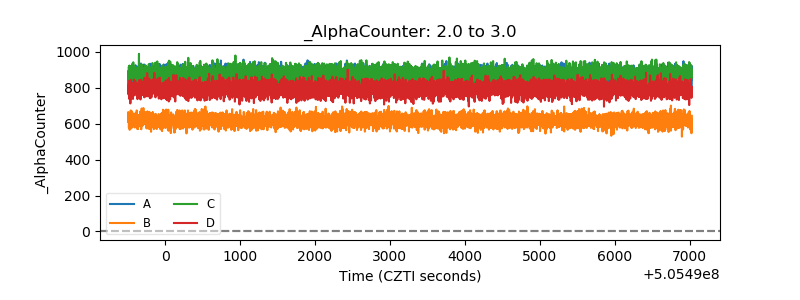 |
| _CPM_Rate | 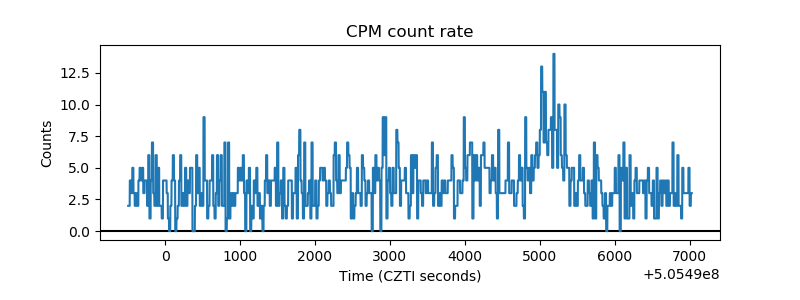 |
| CZT Counter | 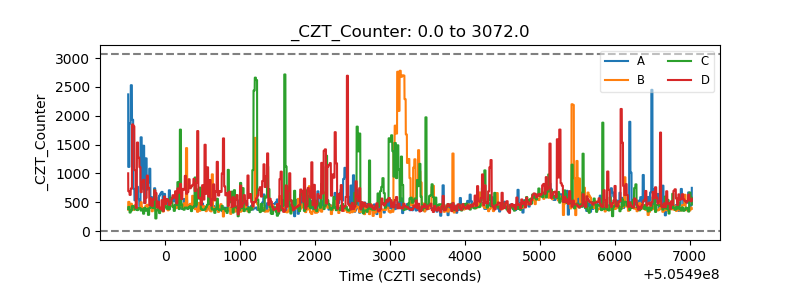 |
| +2.5 Volts monitor | 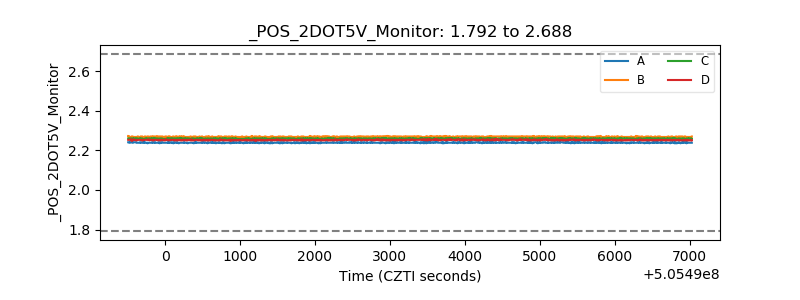 |
| +5 Volts monitor | 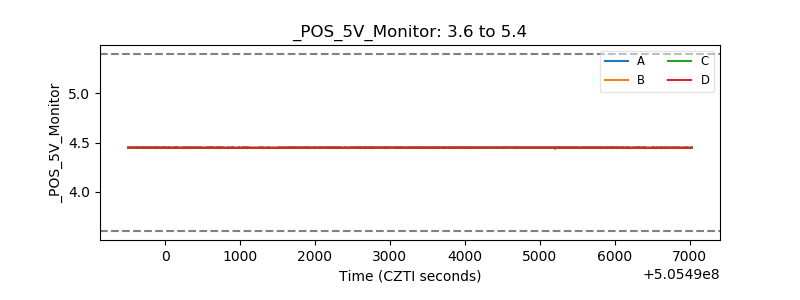 |
| _ROLL_ROT | 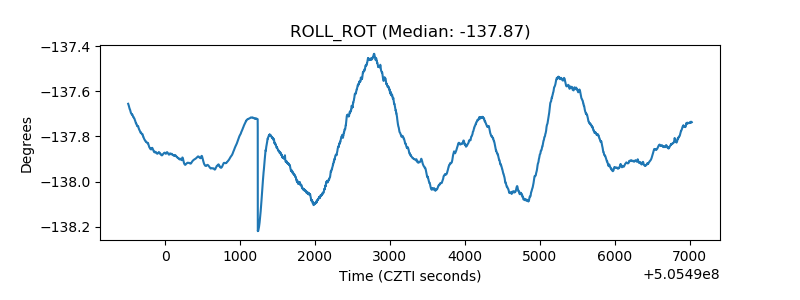 |
| _Roll_DEC | 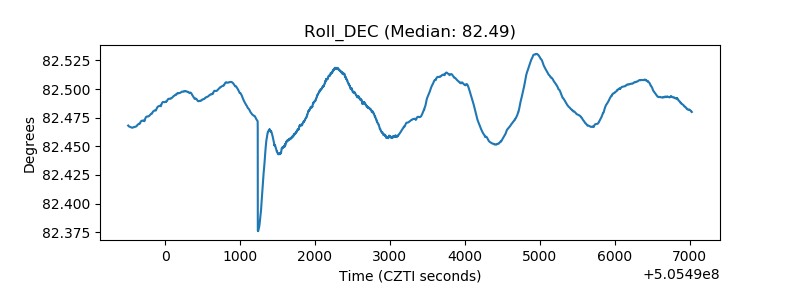 |
| _Roll_RA | 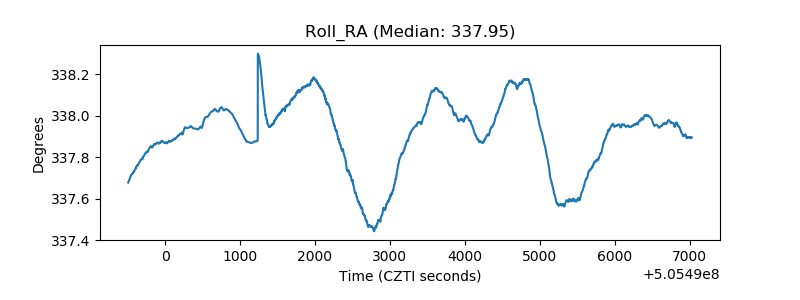 |
| Veto Counter | 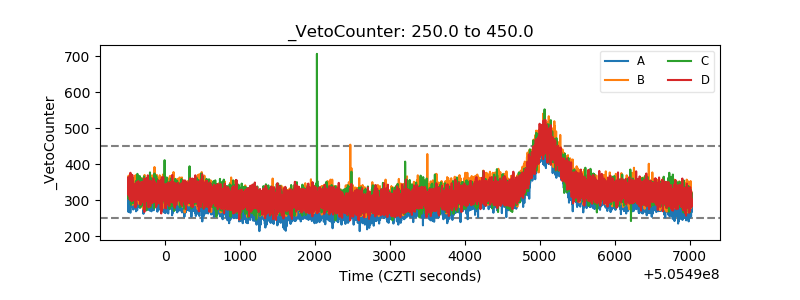 |