| Param | Original file | Final file |
|---|---|---|
| Filename | modeM0/AS1A14_021T06_9000006538_55616cztM0_level2.fits | modeM0/AS1A14_021T06_9000006538_55616cztM0_level2_quad_clean.evt |
| Size (bytes) | 573,168,960 | 99,308,160 |
| Size | 546.6 MB | 94.7 MB |
| Events in quadrant A | 9,517,456 | 503,203 |
| Events in quadrant B | 3,144,956 | 732,189 |
| Events in quadrant C | 3,628,621 | 650,696 |
| Events in quadrant D | 4,354,173 | 608,592 |
| Mode M9 | |||
|---|---|---|---|
| Quadrant | BADHDUFLAG | Total packets | Discarded packets |
| A | 0 | 16 | 0 |
| B | 0 | 16 | 0 |
| C | 0 | 16 | 0 |
| D | 0 | 16 | 0 |
| Mode M0 | |||
|---|---|---|---|
| Quadrant | BADHDUFLAG | Total packets | Discarded packets |
| A | 0 | 33375 | 2 |
| B | 0 | 15069 | 2 |
| C | 0 | 16483 | 2 |
| D | 0 | 18154 | 2 |
| Mode SS | |||
|---|---|---|---|
| Quadrant | BADHDUFLAG | Total packets | Discarded packets |
| A | 0 | 152 | 0 |
| B | 0 | 152 | 0 |
| C | 0 | 152 | 0 |
| D | 0 | 152 | 0 |
| Quadrant | Total seconds | Saturated seconds | Saturation percentage |
|---|---|---|---|
| A | 7355 | 2173 | 29.544528% |
| B | 7356 | 51 | 0.693312% |
| C | 7356 | 90 | 1.223491% |
| D | 7356 | 163 | 2.215878% |
Noise dominated data is calculated using 1-second bins in cleaned event files. If a bin has >2000 counts, and if more than 50% of those come from <1% of pixels, then it is considered to be noise-dominated and hence unusable.
| Quadrant | # 1 sec bins | Bins with >0 counts | Bins with >2000 counts | High rate bins dominated by noise | Noise dominated (total time) | Noise dominated (detector-on time) | Marked lightcurve |
|---|---|---|---|---|---|---|---|
| A | 8980 | 7357 | 1937 | 1937 | 21.57% | 26.33% | 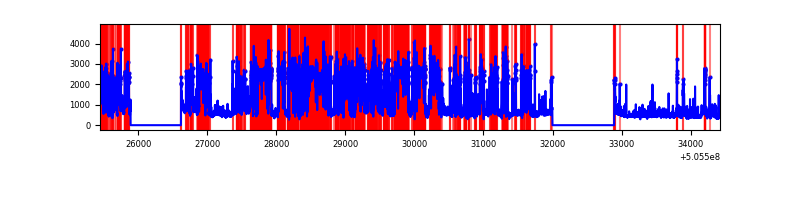 |
| B | 8981 | 7358 | 4 | 4 | 0.04% | 0.05% | 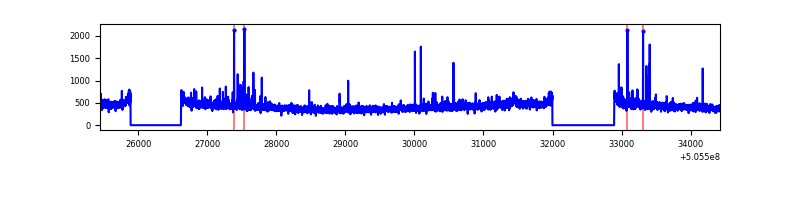 |
| C | 8981 | 7358 | 59 | 59 | 0.66% | 0.80% | 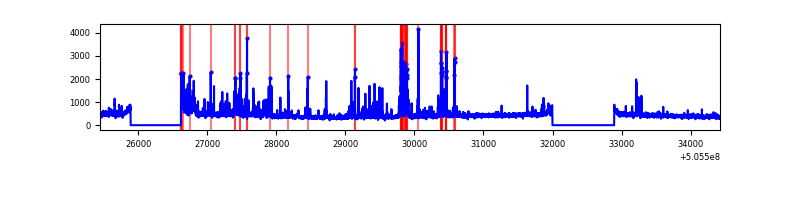 |
| D | 8981 | 7358 | 199 | 199 | 2.22% | 2.70% | 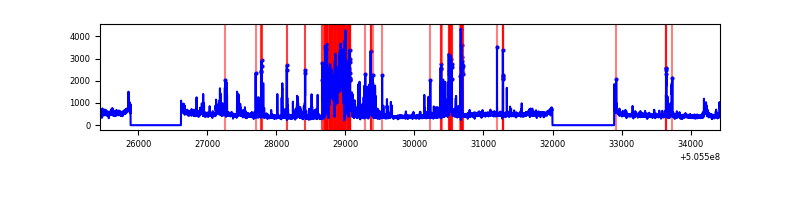 |
Top three noisy pixels from each quadrant. If the there are fewer than three noisy pixels in the level2.evt file, extra rows are filled as -1
| Pixel properties | Quadrant properties | ||||||
|---|---|---|---|---|---|---|---|
| Quadrant | DetID | PixID | Counts | Sigma | Mean | Median | Sigma |
| A | 15 | 32 | 6616892 | 40312.83 | 659 | 640 | 164.1 |
| A | 8 | 249 | 91527 | 553.77 | 659 | 640 | 164.1 |
| A | 0 | 8 | 60926 | 367.32 | 659 | 640 | 164.1 |
| B | 10 | 247 | 47518 | 286.12 | 759 | 731 | 163.5 |
| B | 7 | 0 | 30166 | 180.01 | 759 | 731 | 163.5 |
| B | 5 | 185 | 21960 | 129.82 | 759 | 731 | 163.5 |
| C | 9 | 38 | 218728 | 1061.24 | 748 | 739 | 205.4 |
| C | 12 | 2 | 201700 | 978.34 | 748 | 739 | 205.4 |
| C | 6 | 9 | 66173 | 318.55 | 748 | 739 | 205.4 |
| D | 8 | 245 | 835874 | 4030.15 | 739 | 706 | 207.2 |
| D | 11 | 129 | 265713 | 1278.81 | 739 | 706 | 207.2 |
| D | 7 | 70 | 108785 | 521.54 | 739 | 706 | 207.2 |
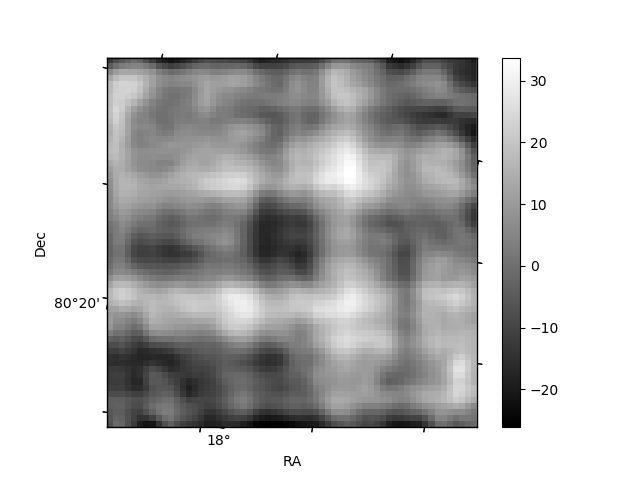
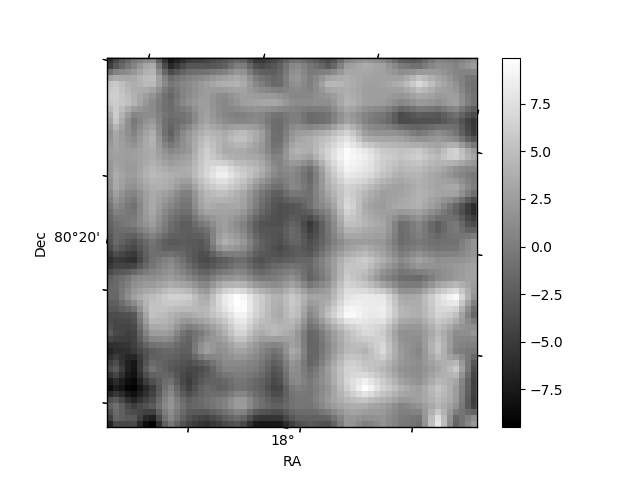
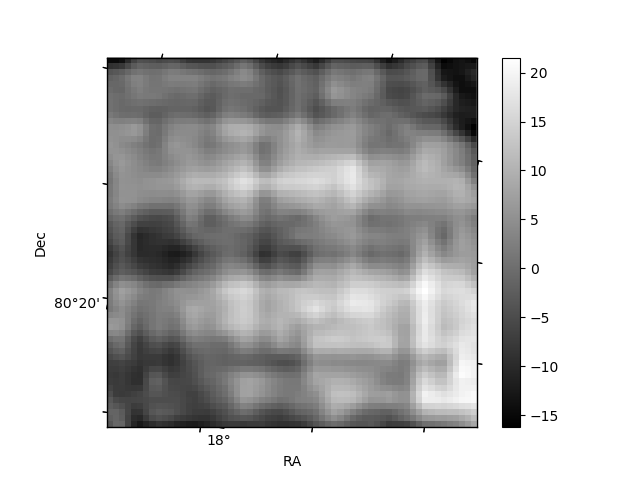
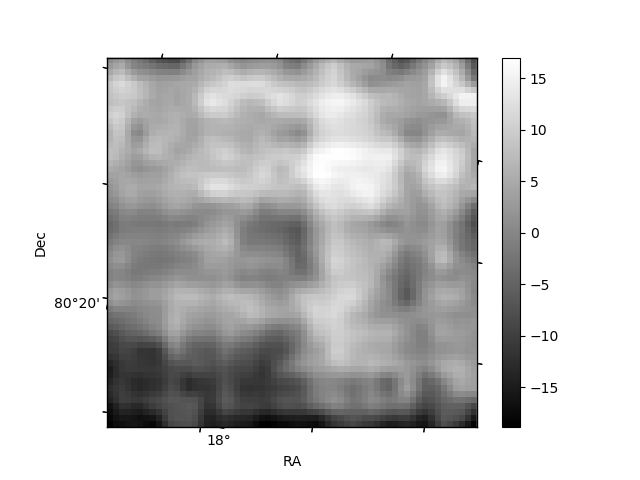
Histogram calculated using DETX and DETY for each event in the final _common_clean file
| Quadrant A | 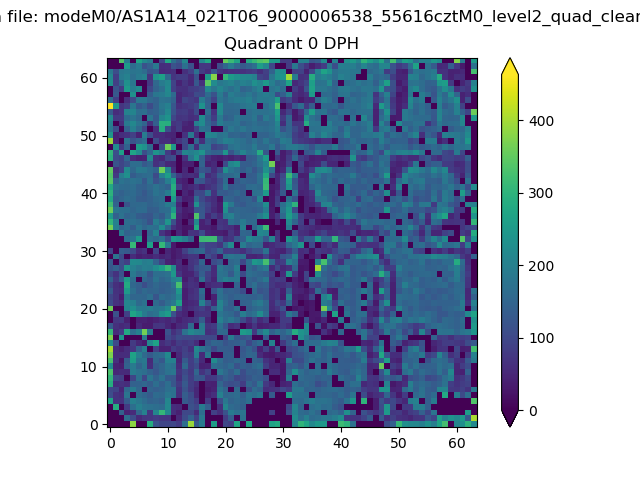 |
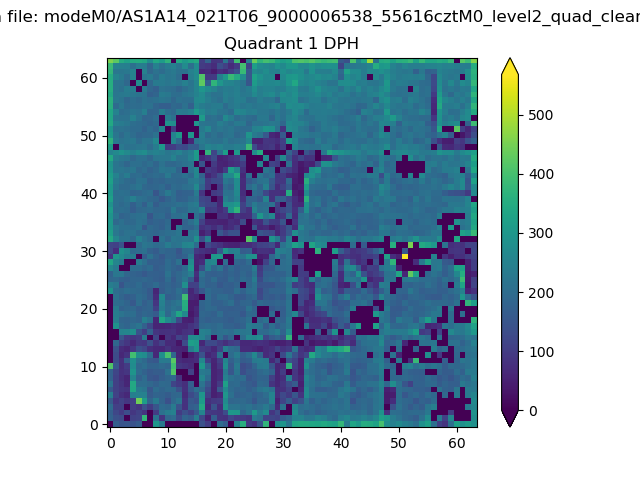 |
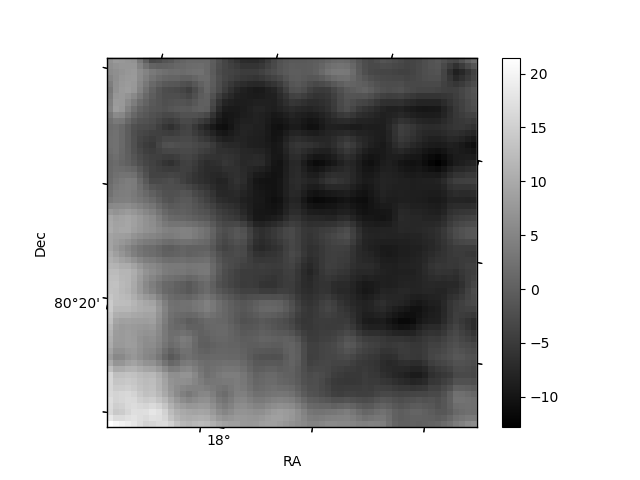
Quadrant B |
|---|---|---|---|
| Quadrant D | 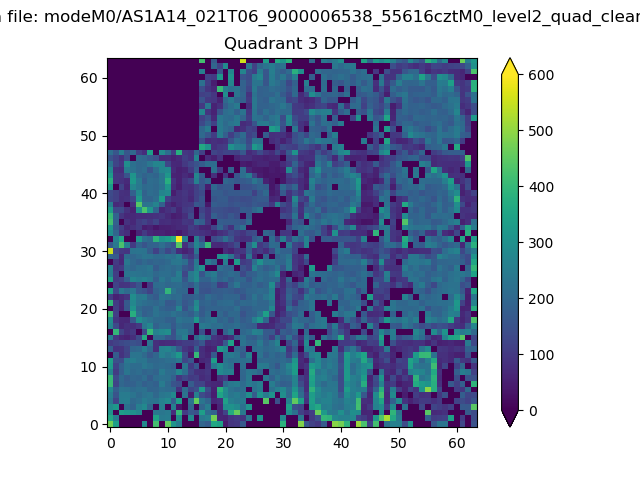 |
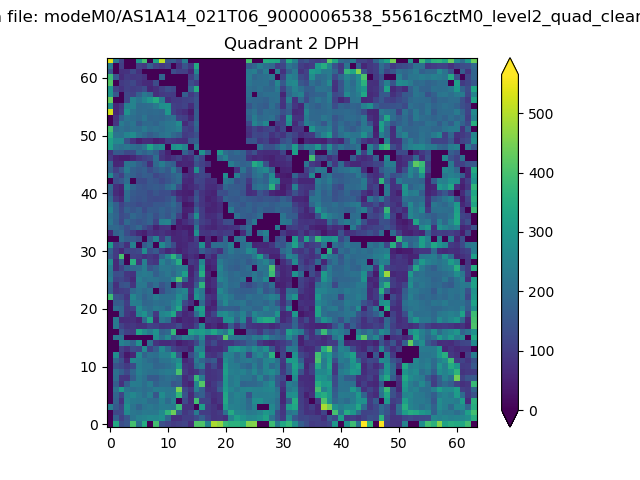 |
Quadrant C |
| Plot type | Count rate plots | Images |
|---|---|---|
| Comparison with Poisson distribution Blue bars denote a histogram of data divided into 1 sec bins. Red curve is a Poisson curve with rate = median count rate of data. |
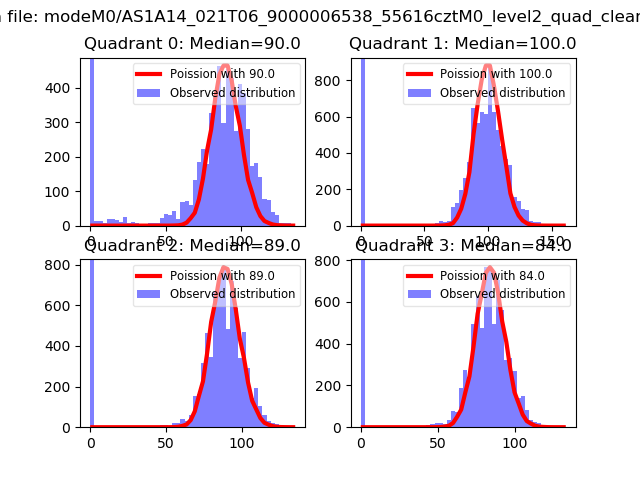 |
 |
| Quadrant-wise count rates Data is divided into 100 sec bins |
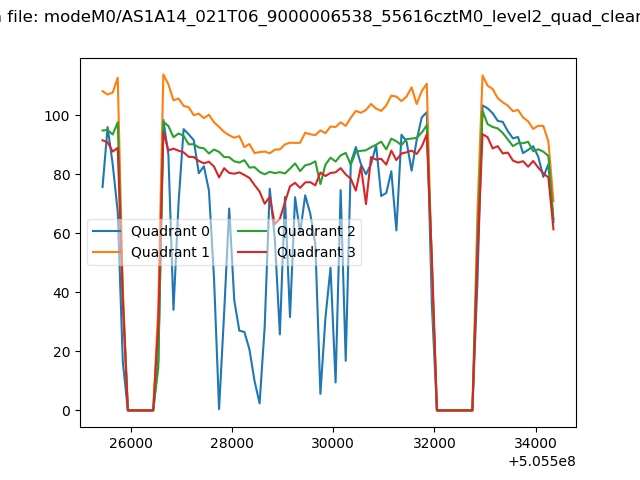 |
|
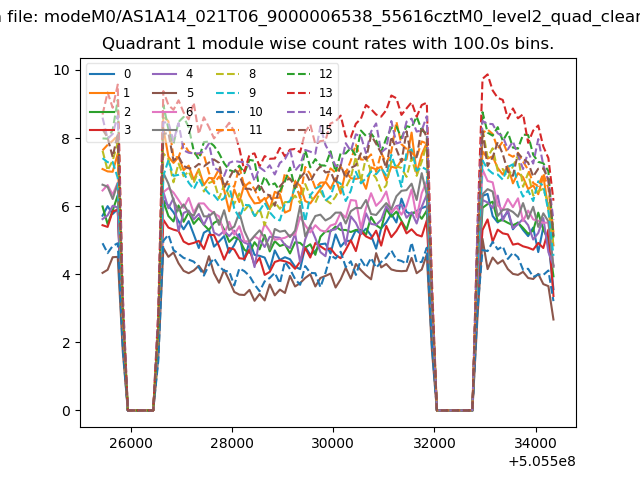
| Module-wise count rates for Quadrant A Data is divided into 100 sec bins |
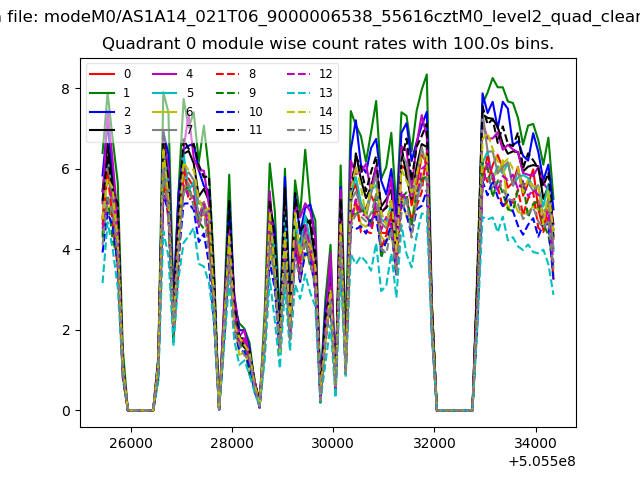 |
 |
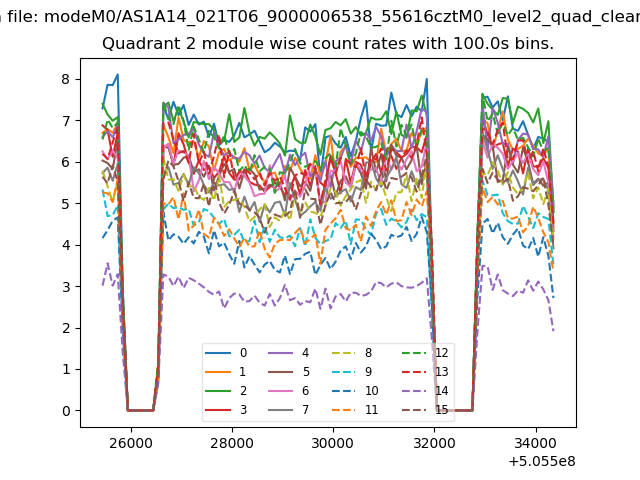
| Module-wise count rates for Quadrant B Data is divided into 100 sec bins |
 |
 |
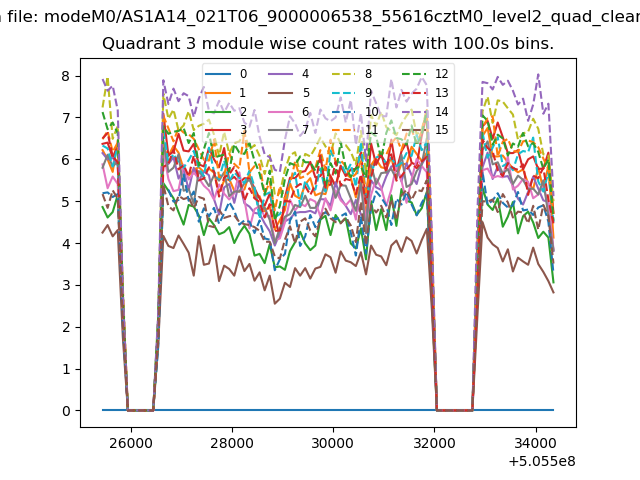
| Module-wise count rates for Quadrant C Data is divided into 100 sec bins |
 |
 |
| Module-wise count rates for Quadrant D Data is divided into 100 sec bins |
 |
 |
| Parameter | Plot |
|---|---|
| CZT HV Monitor | 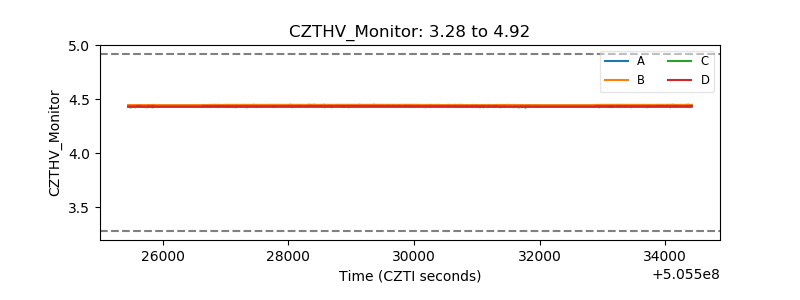 |
| D_VDD | 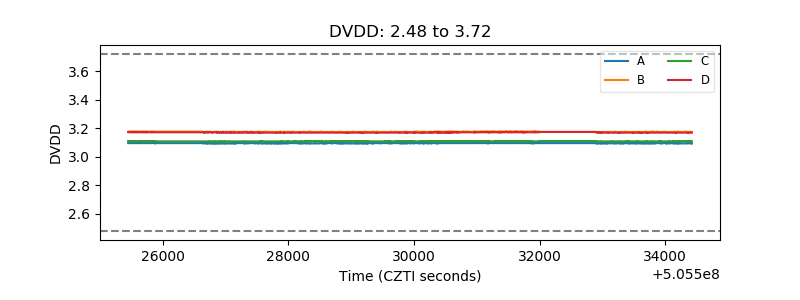 |
| Temperature 1 | 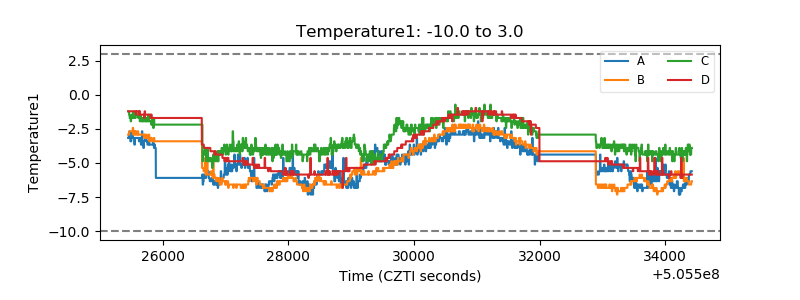 |
| Veto HV Monitor | 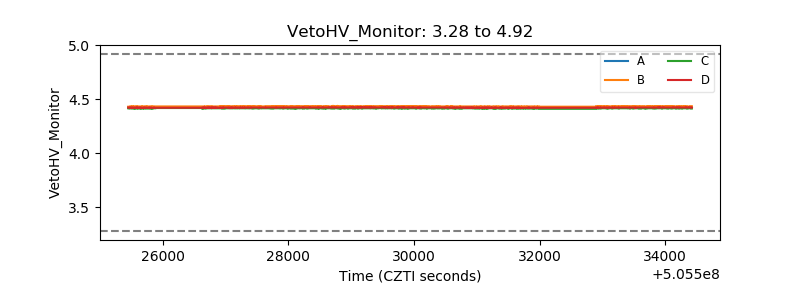 |
| Veto LLD | 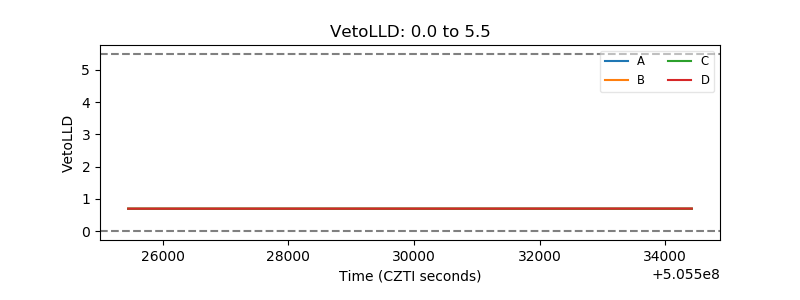 |
| Alpha Counter | 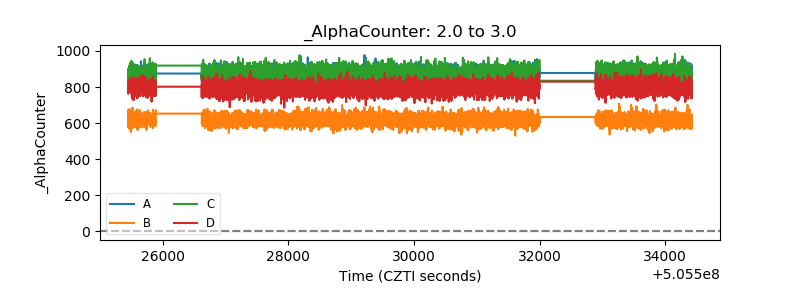 |
| _CPM_Rate | 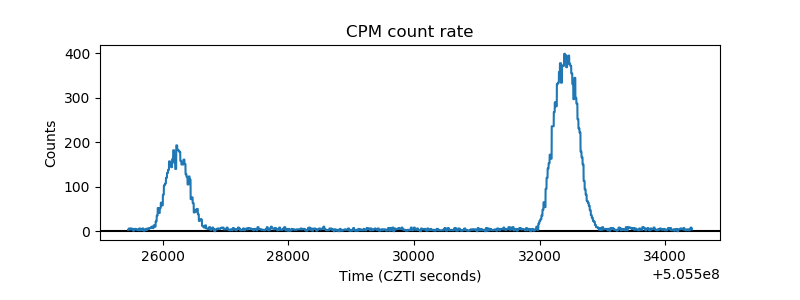 |
| CZT Counter | 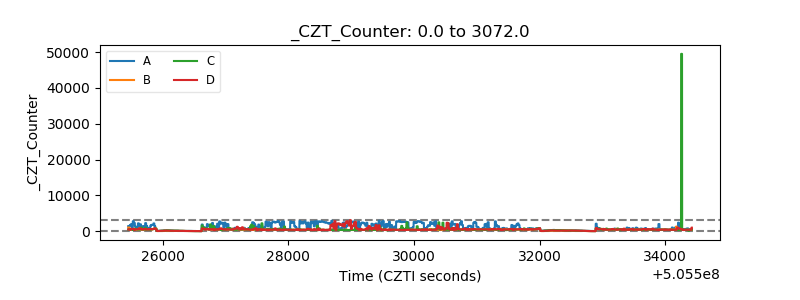 |
| +2.5 Volts monitor | 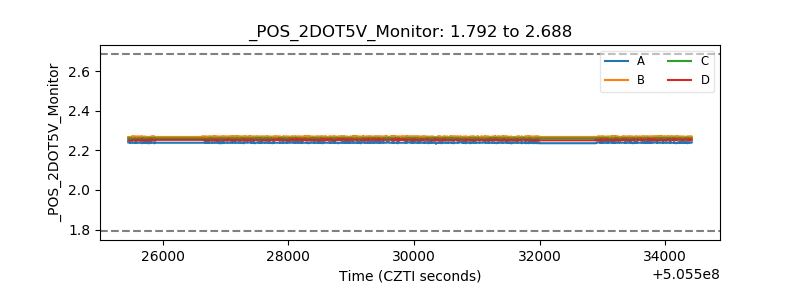 |
| +5 Volts monitor | 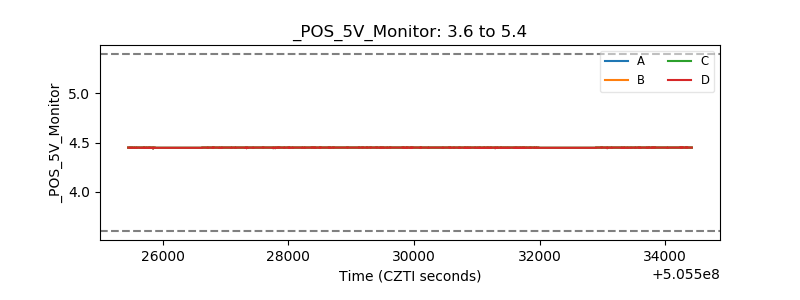 |
| _ROLL_ROT | 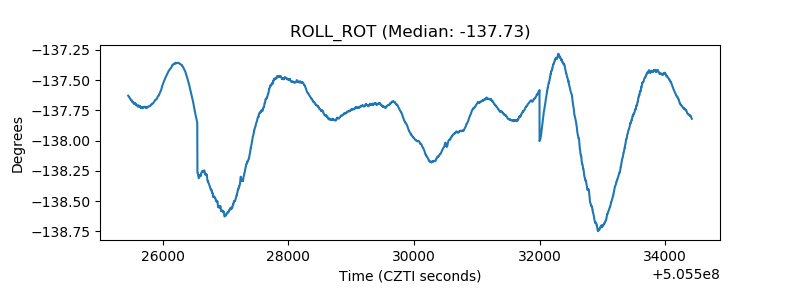 |
| _Roll_DEC | 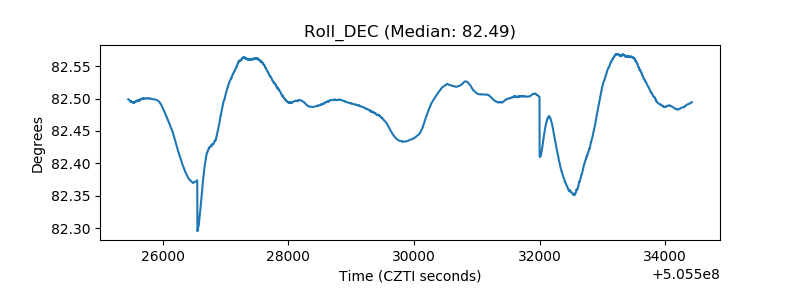 |
| _Roll_RA | 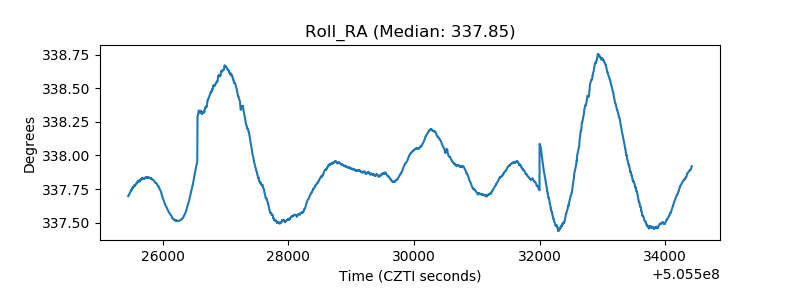 |
| Veto Counter | 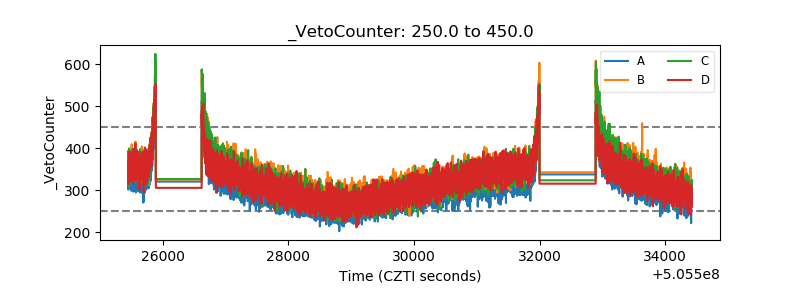 |