| Param | Original file | Final file |
|---|---|---|
| Filename | modeM0/AS1A14_021T06_9000006538_55618cztM0_level2.fits | modeM0/AS1A14_021T06_9000006538_55618cztM0_level2_quad_clean.evt |
| Size (bytes) | 2,518,701,120 | 465,235,200 |
| Size | 2.3 GB | 443.7 MB |
| Events in quadrant A | 36,377,963 | 2,697,126 |
| Events in quadrant B | 14,766,374 | 3,350,472 |
| Events in quadrant C | 18,989,199 | 2,933,467 |
| Events in quadrant D | 20,477,085 | 2,770,706 |
| Mode M9 | |||
|---|---|---|---|
| Quadrant | BADHDUFLAG | Total packets | Discarded packets |
| A | 0 | 35 | 0 |
| B | 0 | 35 | 0 |
| C | 0 | 35 | 0 |
| D | 0 | 35 | 0 |
| Mode M0 | |||
|---|---|---|---|
| Quadrant | BADHDUFLAG | Total packets | Discarded packets |
| A | 0 | 132018 | 4 |
| B | 0 | 70690 | 4 |
| C | 0 | 82624 | 4 |
| D | 0 | 85740 | 4 |
| Mode SS | |||
|---|---|---|---|
| Quadrant | BADHDUFLAG | Total packets | Discarded packets |
| A | 0 | 692 | 0 |
| B | 0 | 692 | 0 |
| C | 0 | 692 | 0 |
| D | 0 | 692 | 0 |
| Quadrant | Total seconds | Saturated seconds | Saturation percentage |
|---|---|---|---|
| A | 33956 | 5706 | 16.804099% |
| B | 33956 | 266 | 0.783367% |
| C | 33956 | 883 | 2.600424% |
| D | 33957 | 879 | 2.588568% |
Noise dominated data is calculated using 1-second bins in cleaned event files. If a bin has >2000 counts, and if more than 50% of those come from <1% of pixels, then it is considered to be noise-dominated and hence unusable.
| Quadrant | # 1 sec bins | Bins with >0 counts | Bins with >2000 counts | High rate bins dominated by noise | Noise dominated (total time) | Noise dominated (detector-on time) | Marked lightcurve |
|---|---|---|---|---|---|---|---|
| A | 37606 | 33960 | 4932 | 4932 | 13.11% | 14.52% | 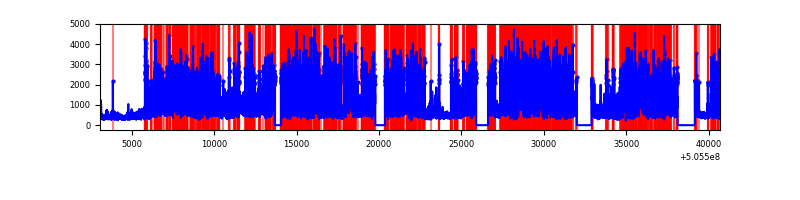 |
| B | 37606 | 33961 | 83 | 83 | 0.22% | 0.24% | 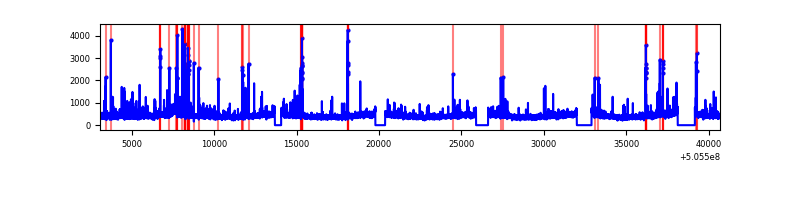 |
| C | 37606 | 33961 | 772 | 772 | 2.05% | 2.27% | 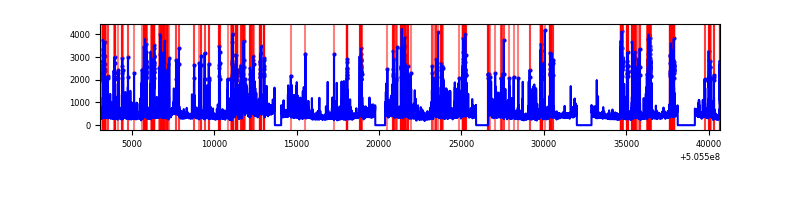 |
| D | 37607 | 33962 | 913 | 913 | 2.43% | 2.69% | 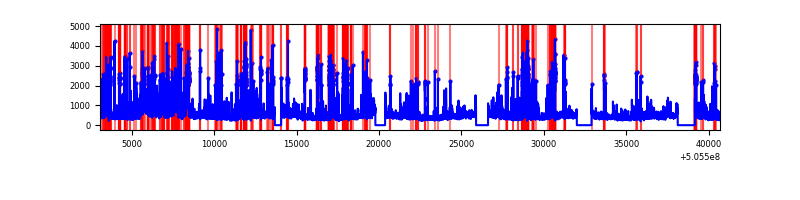 |
Top three noisy pixels from each quadrant. If the there are fewer than three noisy pixels in the level2.evt file, extra rows are filled as -1
| Pixel properties | Quadrant properties | ||||||
|---|---|---|---|---|---|---|---|
| Quadrant | DetID | PixID | Counts | Sigma | Mean | Median | Sigma |
| A | 15 | 32 | 20924150 | 26316.67 | 3237 | 3164 | 795.0 |
| A | 8 | 249 | 1564215 | 1963.66 | 3237 | 3164 | 795.0 |
| A | 12 | 115 | 340871 | 424.8 | 3237 | 3164 | 795.0 |
| B | 5 | 185 | 442607 | 601.73 | 3444 | 3314 | 730.1 |
| B | 10 | 247 | 179799 | 241.74 | 3444 | 3314 | 730.1 |
| B | 0 | 199 | 119104 | 158.6 | 3444 | 3314 | 730.1 |
| C | 9 | 38 | 2476789 | 2700.06 | 3360 | 3321 | 916.1 |
| C | 12 | 2 | 1032807 | 1123.79 | 3360 | 3321 | 916.1 |
| C | 10 | 19 | 603062 | 654.68 | 3360 | 3321 | 916.1 |
| D | 8 | 245 | 2104942 | 2236.11 | 3349 | 3200 | 939.9 |
| D | 11 | 129 | 1452287 | 1541.73 | 3349 | 3200 | 939.9 |
| D | 8 | 160 | 591452 | 625.86 | 3349 | 3200 | 939.9 |
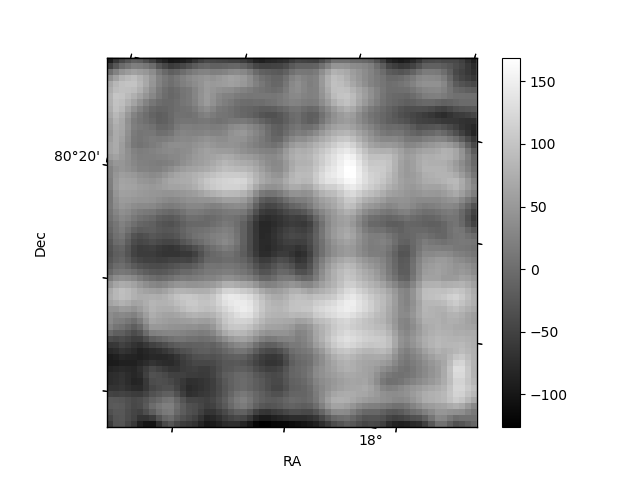
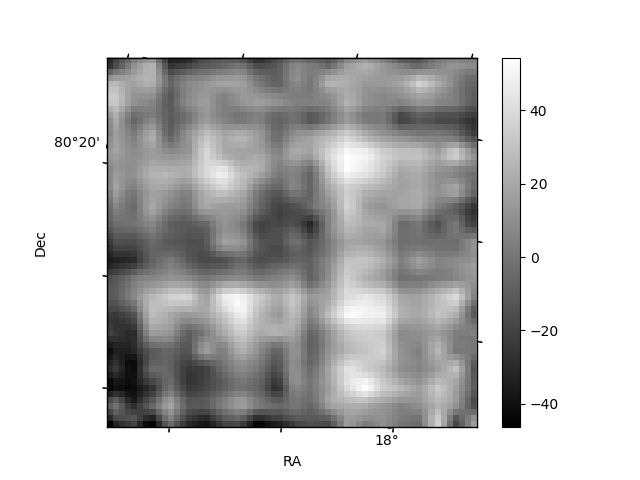
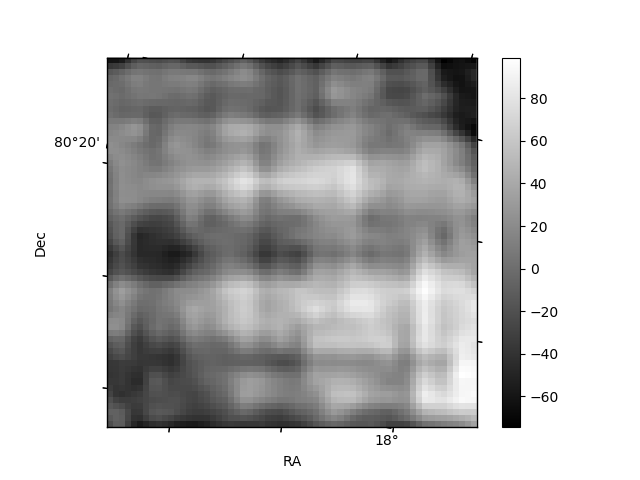
Histogram calculated using DETX and DETY for each event in the final _common_clean file
| Quadrant A | 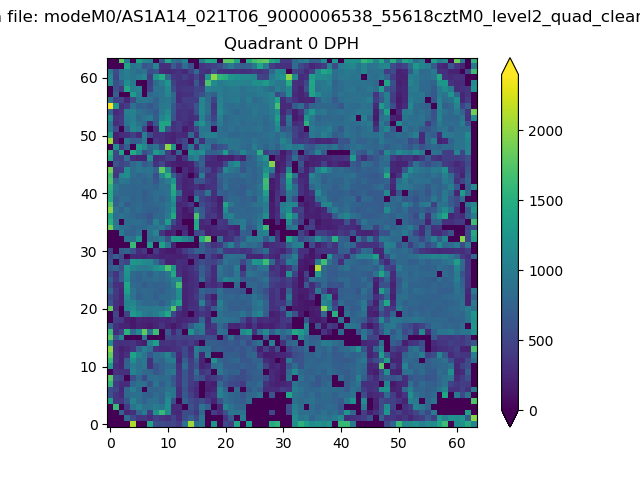 |
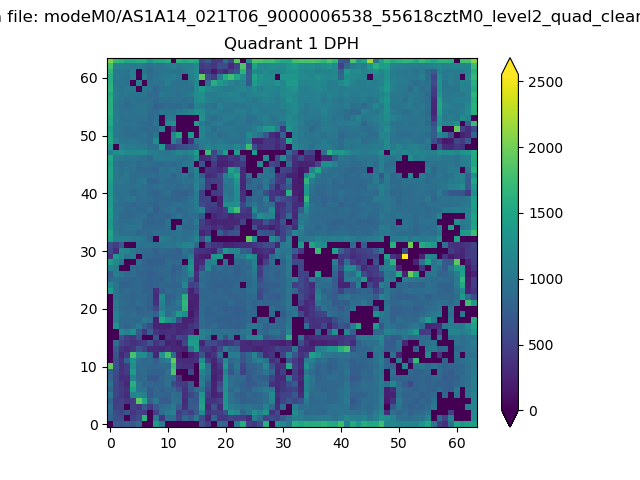 |
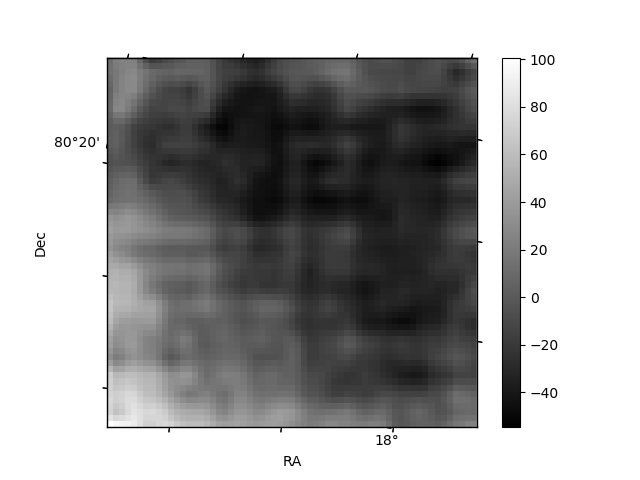
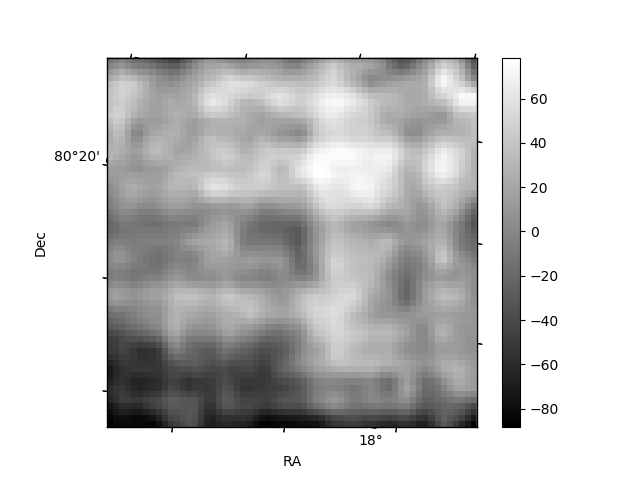
Quadrant B |
|---|---|---|---|
| Quadrant D | 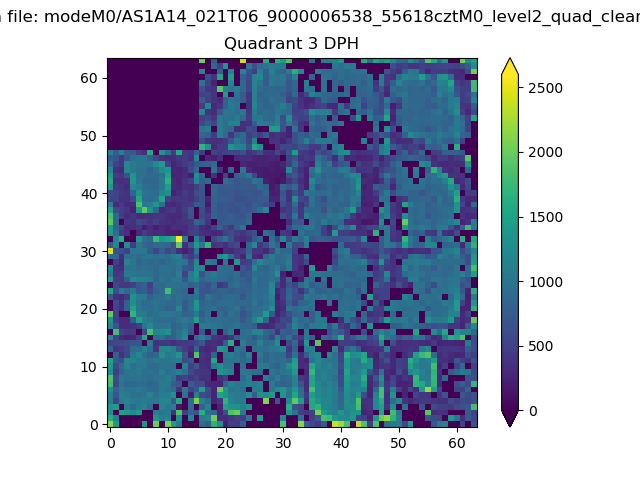 |
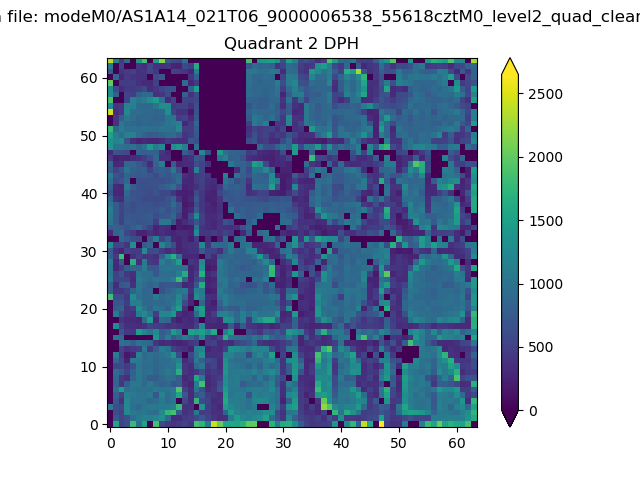 |
Quadrant C |
| Plot type | Count rate plots | Images |
|---|---|---|
| Comparison with Poisson distribution Blue bars denote a histogram of data divided into 1 sec bins. Red curve is a Poisson curve with rate = median count rate of data. |
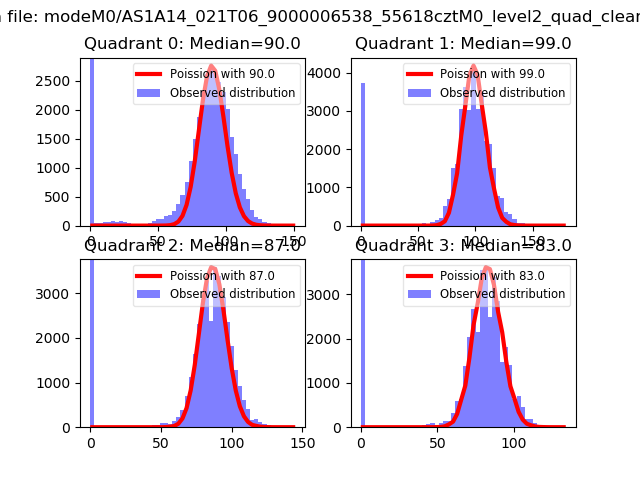 |
 |
| Quadrant-wise count rates Data is divided into 100 sec bins |
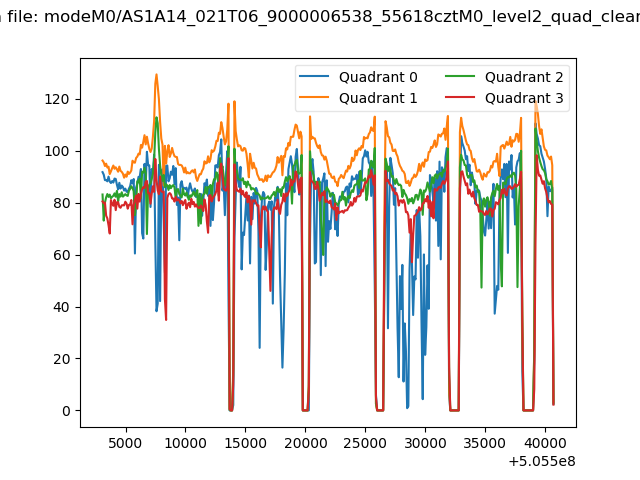 |
|
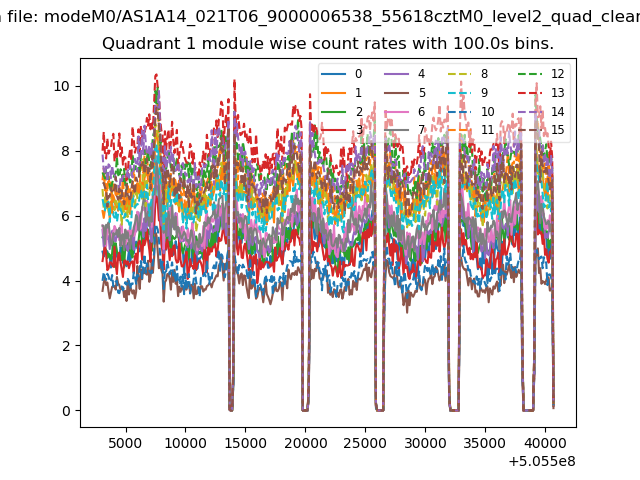
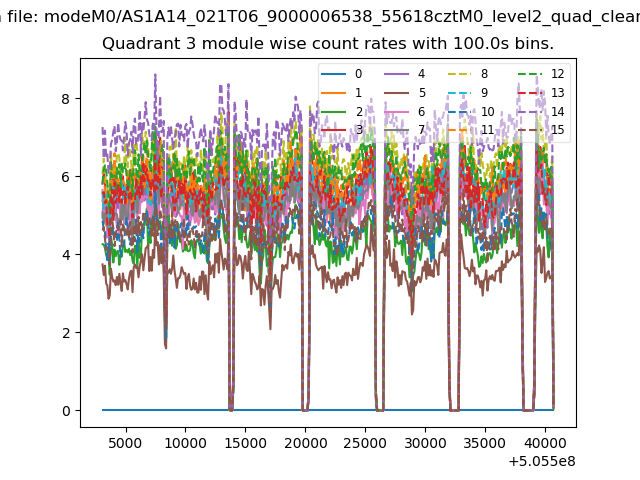
| Module-wise count rates for Quadrant A Data is divided into 100 sec bins |
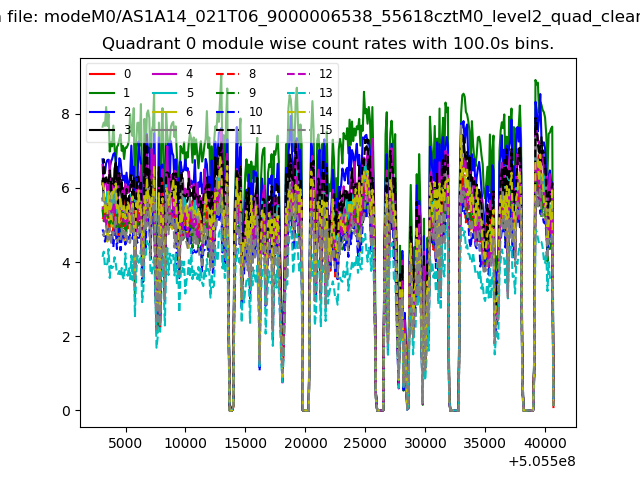 |
 |
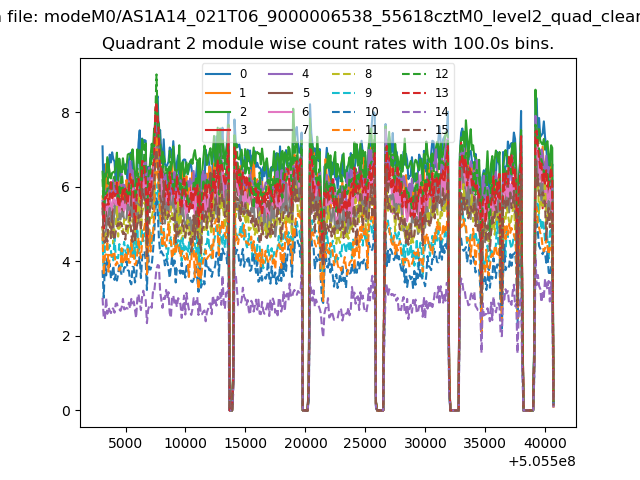
| Module-wise count rates for Quadrant B Data is divided into 100 sec bins |
 |
 |
| Module-wise count rates for Quadrant C Data is divided into 100 sec bins |
 |
 |
| Module-wise count rates for Quadrant D Data is divided into 100 sec bins |
 |
 |
| Parameter | Plot |
|---|---|
| CZT HV Monitor | 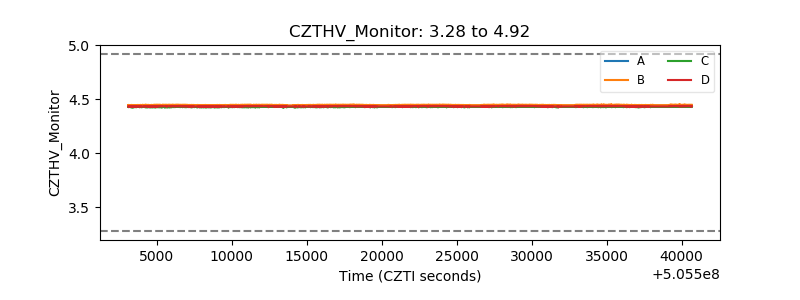 |
| D_VDD | 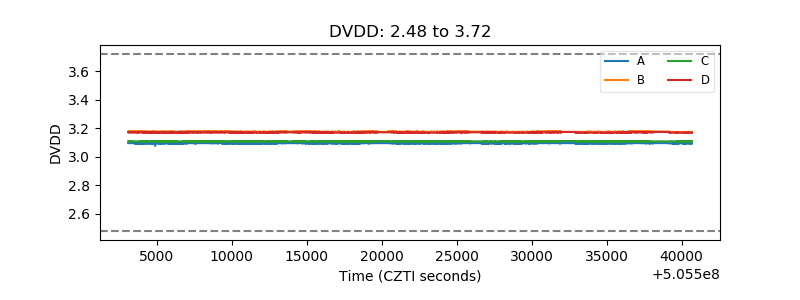 |
| Temperature 1 | 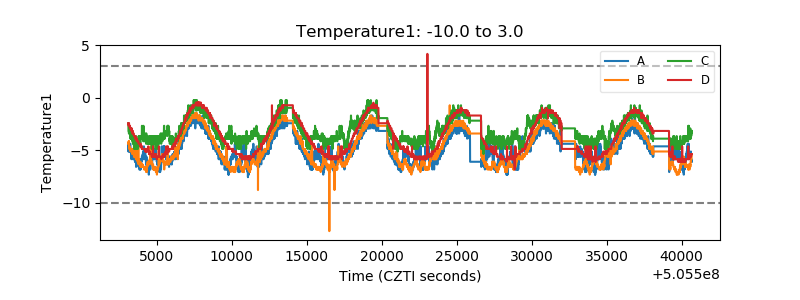 |
| Veto HV Monitor | 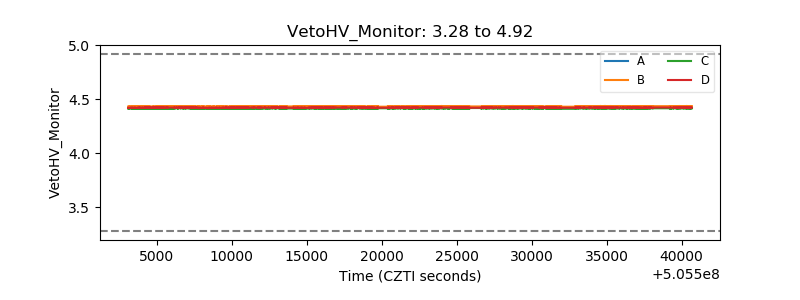 |
| Veto LLD | 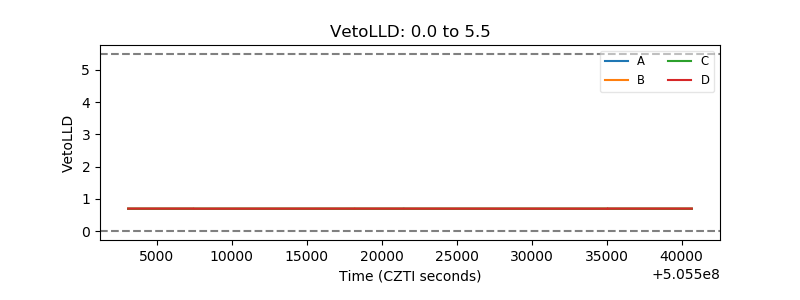 |
| Alpha Counter | 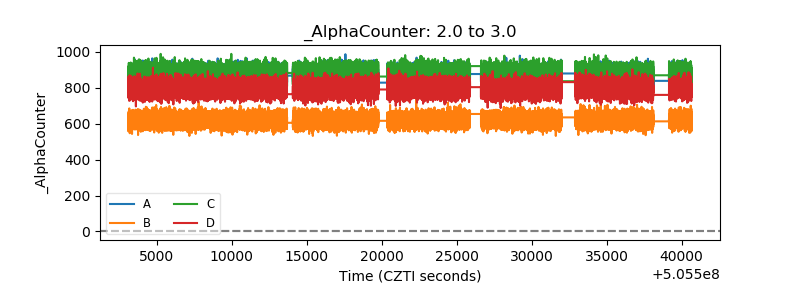 |
| _CPM_Rate | 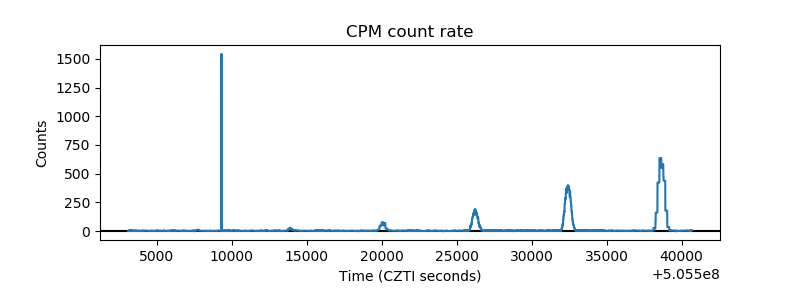 |
| CZT Counter | 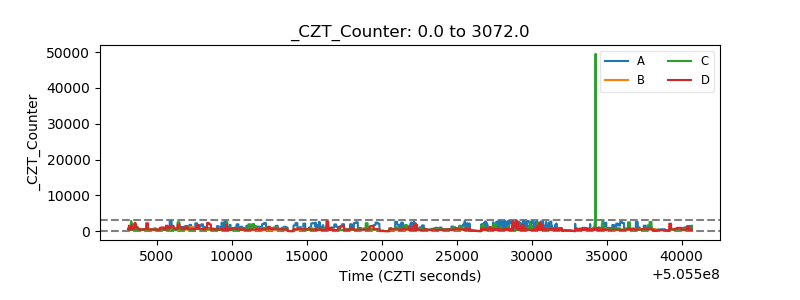 |
| +2.5 Volts monitor | 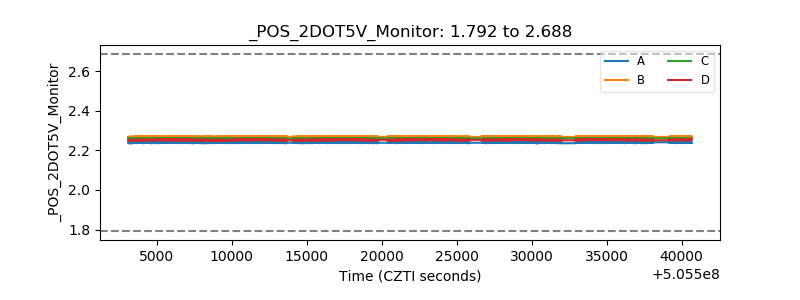 |
| +5 Volts monitor | 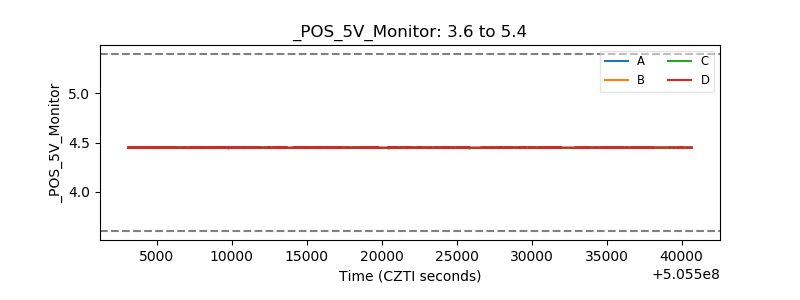 |
| _ROLL_ROT |  |
| _Roll_DEC | 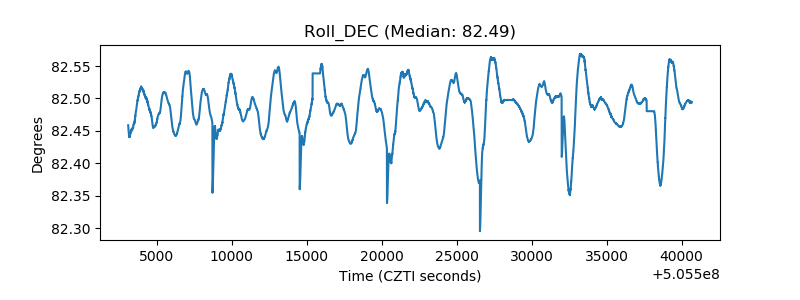 |
| _Roll_RA | 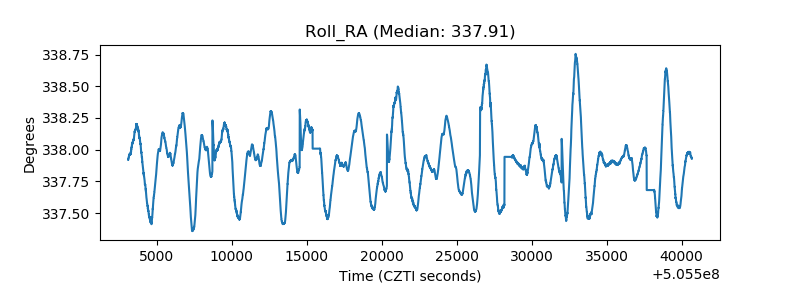 |
| Veto Counter | 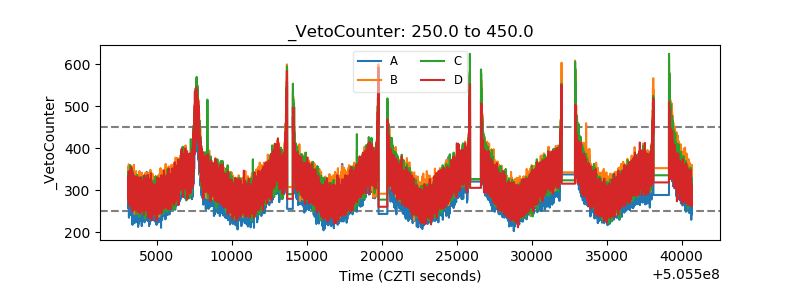 |