| Param | Original file | Final file |
|---|---|---|
| Filename | modeM0/AS1A14_021T06_9000006538_55619cztM0_level2.fits | modeM0/AS1A14_021T06_9000006538_55619cztM0_level2_quad_clean.evt |
| Size (bytes) | 422,095,680 | 93,634,560 |
| Size | 402.5 MB | 89.3 MB |
| Events in quadrant A | 4,767,424 | 592,072 |
| Events in quadrant B | 2,895,221 | 668,351 |
| Events in quadrant C | 3,730,302 | 577,240 |
| Events in quadrant D | 3,727,933 | 545,647 |
| Mode M9 | |||
|---|---|---|---|
| Quadrant | BADHDUFLAG | Total packets | Discarded packets |
| A | 0 | 20 | 0 |
| B | 0 | 21 | 0 |
| C | 0 | 21 | 0 |
| D | 0 | 21 | 0 |
| Mode M0 | |||
|---|---|---|---|
| Quadrant | BADHDUFLAG | Total packets | Discarded packets |
| A | 0 | 18652 | 2 |
| B | 0 | 13501 | 2 |
| C | 0 | 16046 | 2 |
| D | 0 | 15909 | 2 |
| Mode SS | |||
|---|---|---|---|
| Quadrant | BADHDUFLAG | Total packets | Discarded packets |
| A | 0 | 134 | 0 |
| B | 0 | 134 | 0 |
| C | 0 | 134 | 0 |
| D | 0 | 134 | 0 |
| Quadrant | Total seconds | Saturated seconds | Saturation percentage |
|---|---|---|---|
| A | 6475 | 382 | 5.899614% |
| B | 6475 | 45 | 0.694981% |
| C | 6475 | 236 | 3.644788% |
| D | 6475 | 147 | 2.270270% |
Noise dominated data is calculated using 1-second bins in cleaned event files. If a bin has >2000 counts, and if more than 50% of those come from <1% of pixels, then it is considered to be noise-dominated and hence unusable.
| Quadrant | # 1 sec bins | Bins with >0 counts | Bins with >2000 counts | High rate bins dominated by noise | Noise dominated (total time) | Noise dominated (detector-on time) | Marked lightcurve |
|---|---|---|---|---|---|---|---|
| A | 7580 | 6476 | 318 | 318 | 4.20% | 4.91% | 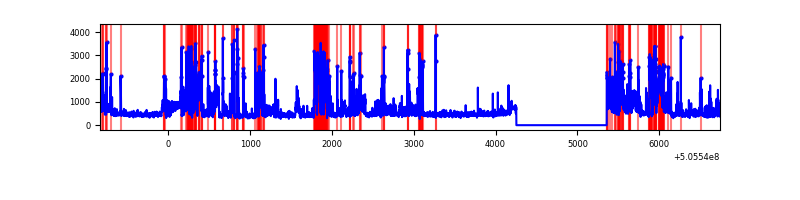 |
| B | 7580 | 6476 | 9 | 9 | 0.12% | 0.14% | 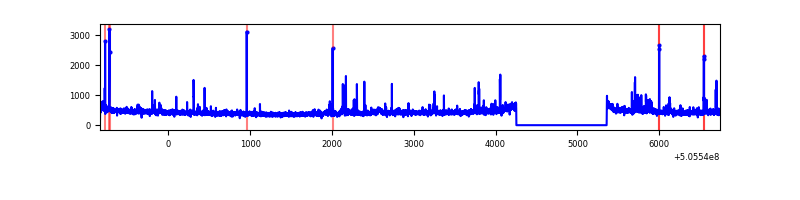 |
| C | 7580 | 6476 | 215 | 215 | 2.84% | 3.32% | 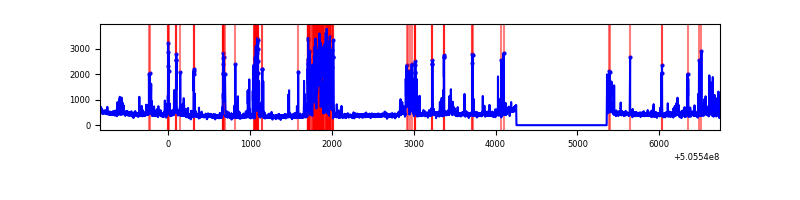 |
| D | 7580 | 6476 | 127 | 127 | 1.68% | 1.96% | 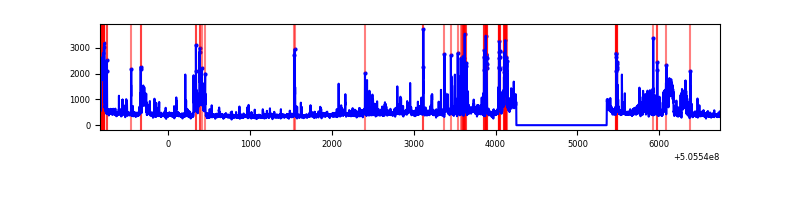 |
Top three noisy pixels from each quadrant. If the there are fewer than three noisy pixels in the level2.evt file, extra rows are filled as -1
| Pixel properties | Quadrant properties | ||||||
|---|---|---|---|---|---|---|---|
| Quadrant | DetID | PixID | Counts | Sigma | Mean | Median | Sigma |
| A | 15 | 32 | 2024267 | 12484.42 | 659 | 643 | 162.1 |
| A | 3 | 14 | 79304 | 485.29 | 659 | 643 | 162.1 |
| A | 8 | 249 | 35661 | 216.04 | 659 | 643 | 162.1 |
| B | 5 | 185 | 63382 | 435.98 | 669 | 643 | 143.9 |
| B | 7 | 0 | 56898 | 390.92 | 669 | 643 | 143.9 |
| B | 10 | 247 | 20304 | 136.63 | 669 | 643 | 143.9 |
| C | 13 | 3 | 527733 | 2990.25 | 643 | 635 | 176.3 |
| C | 9 | 38 | 226567 | 1281.72 | 643 | 635 | 176.3 |
| C | 6 | 223 | 197813 | 1118.6 | 643 | 635 | 176.3 |
| D | 8 | 160 | 299816 | 1643.68 | 640 | 611 | 182.0 |
| D | 11 | 129 | 206673 | 1132.0 | 640 | 611 | 182.0 |
| D | 15 | 125 | 204668 | 1120.98 | 640 | 611 | 182.0 |
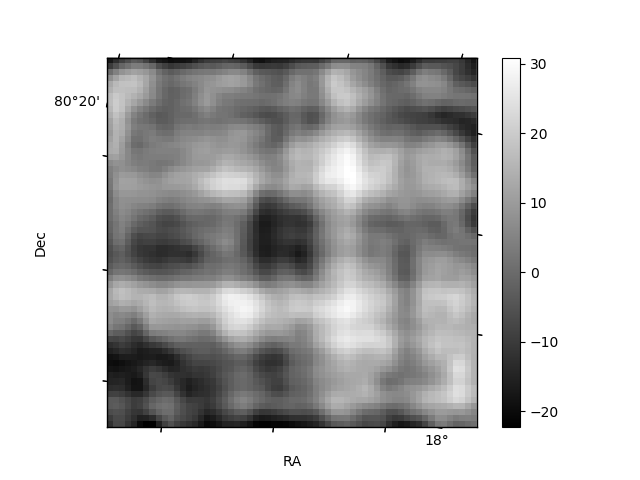
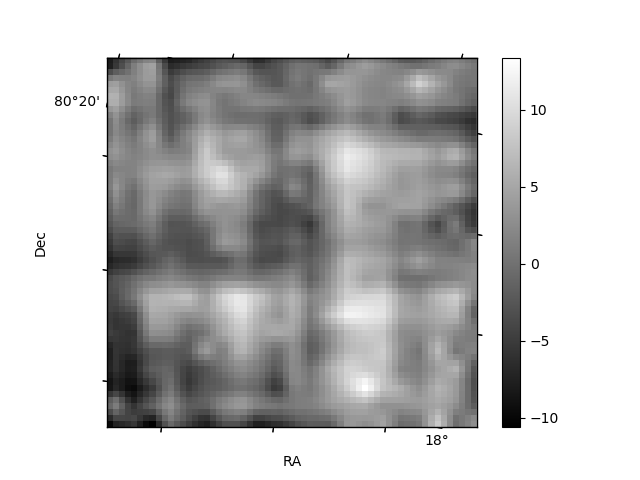
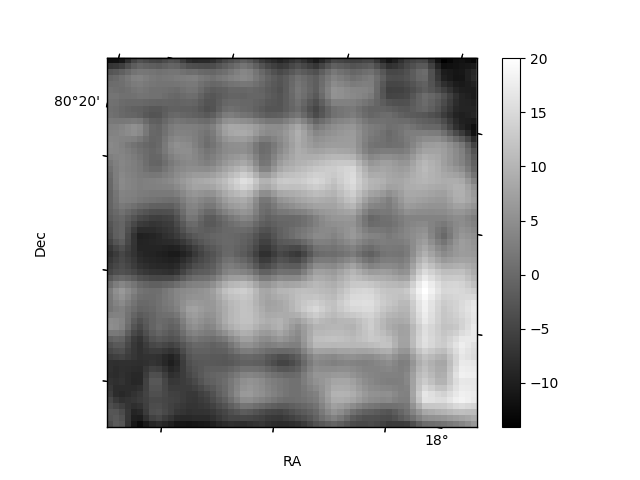
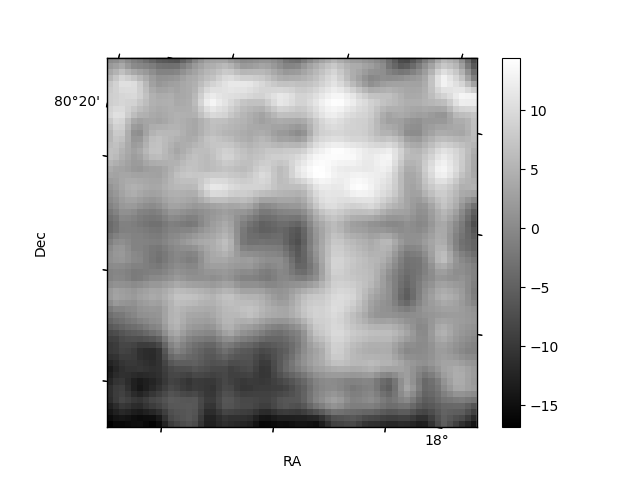
Histogram calculated using DETX and DETY for each event in the final _common_clean file
| Quadrant A | 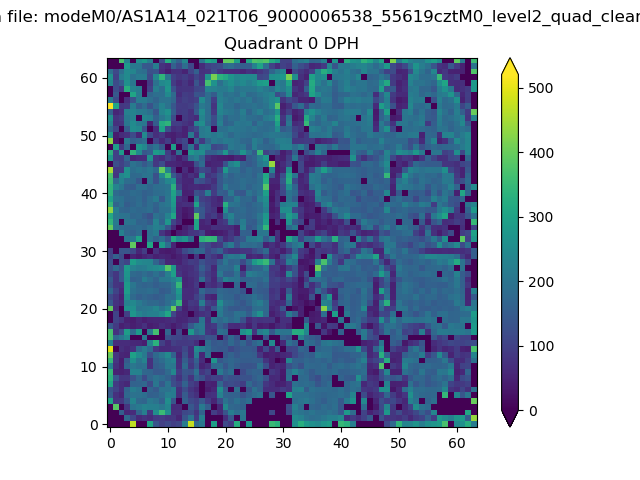 |
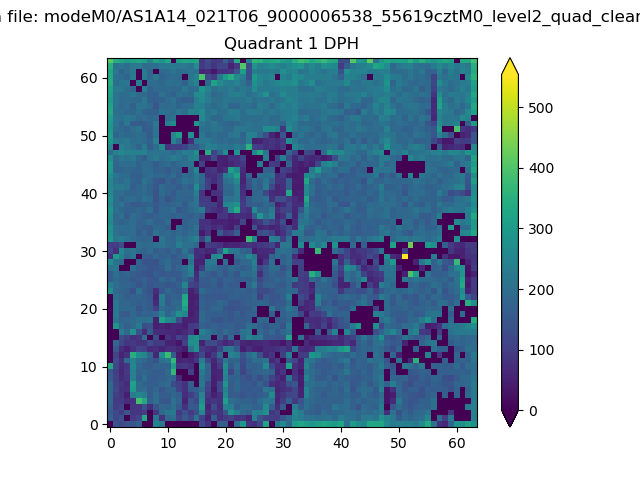 |
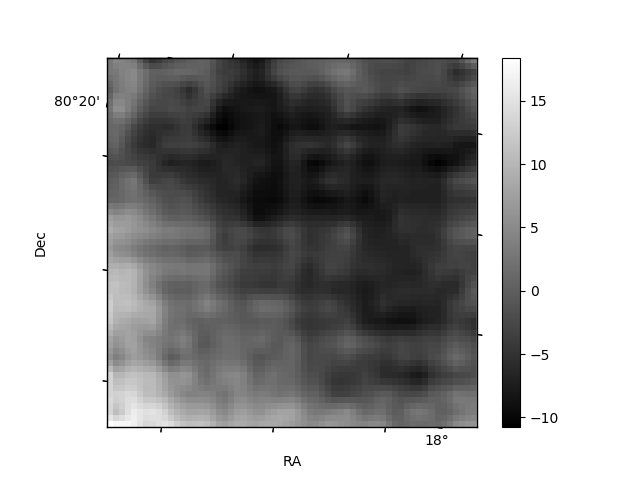
Quadrant B |
|---|---|---|---|
| Quadrant D | 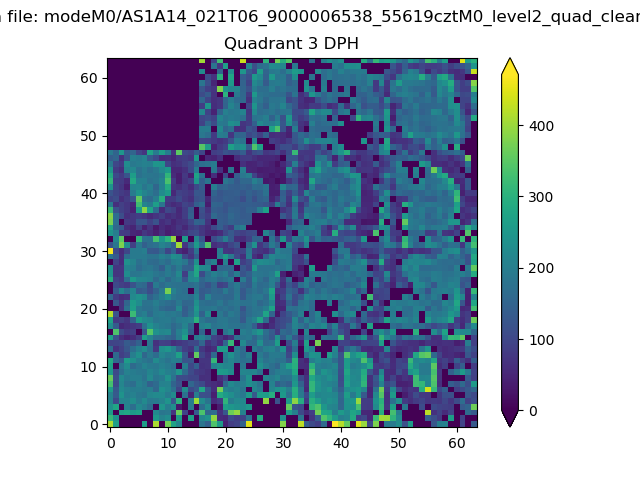 |
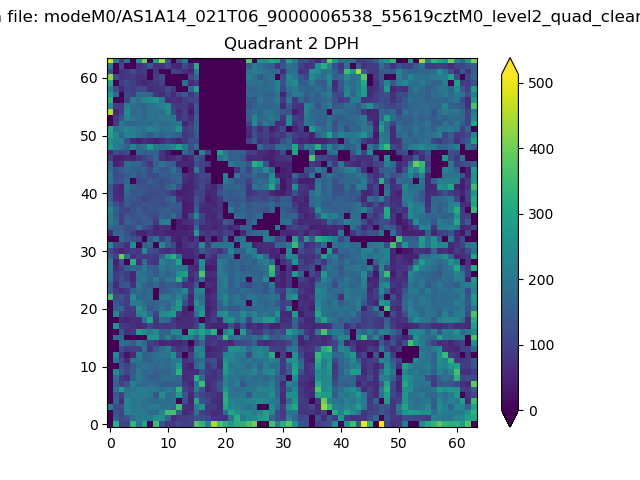 |
Quadrant C |
| Plot type | Count rate plots | Images |
|---|---|---|
| Comparison with Poisson distribution Blue bars denote a histogram of data divided into 1 sec bins. Red curve is a Poisson curve with rate = median count rate of data. |
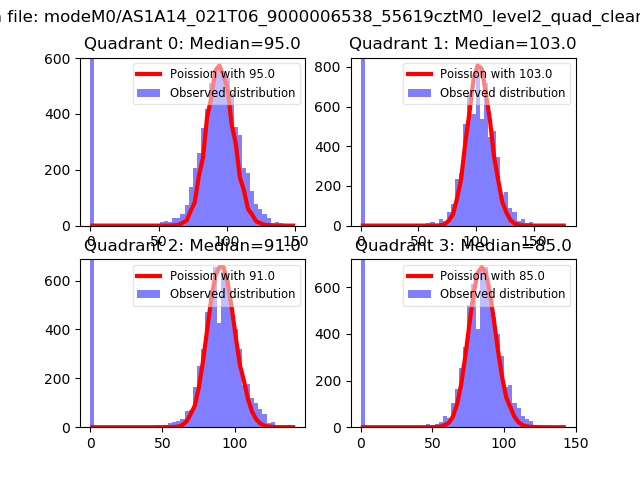 |
 |
| Quadrant-wise count rates Data is divided into 100 sec bins |
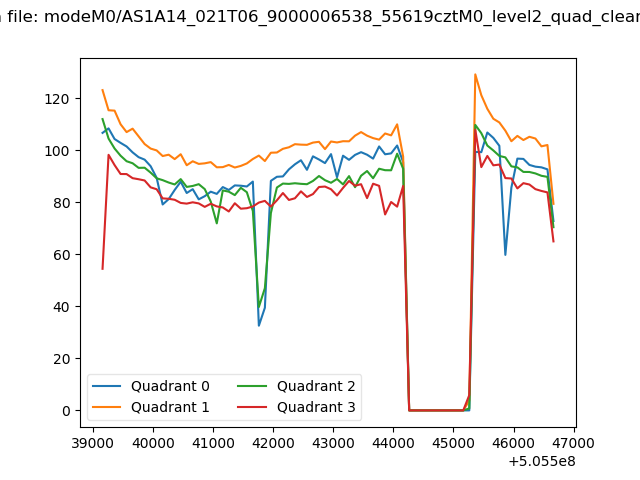 |
|
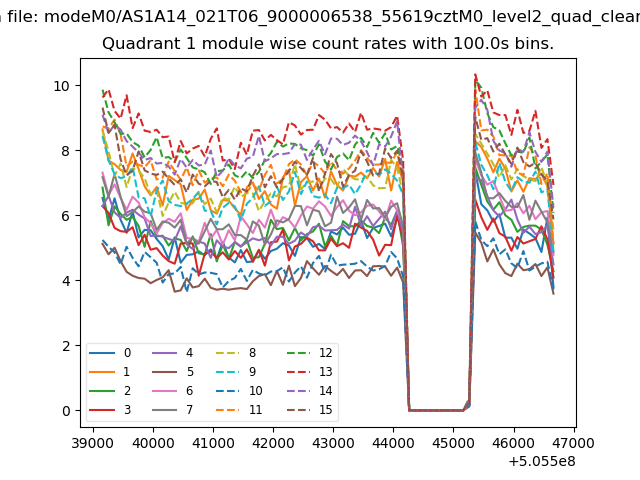
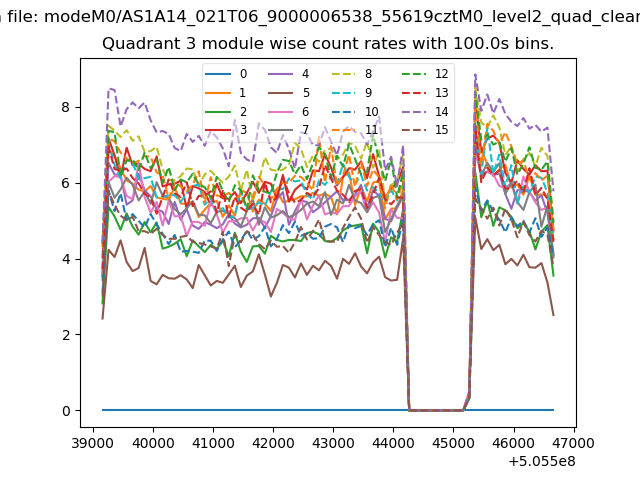
| Module-wise count rates for Quadrant A Data is divided into 100 sec bins |
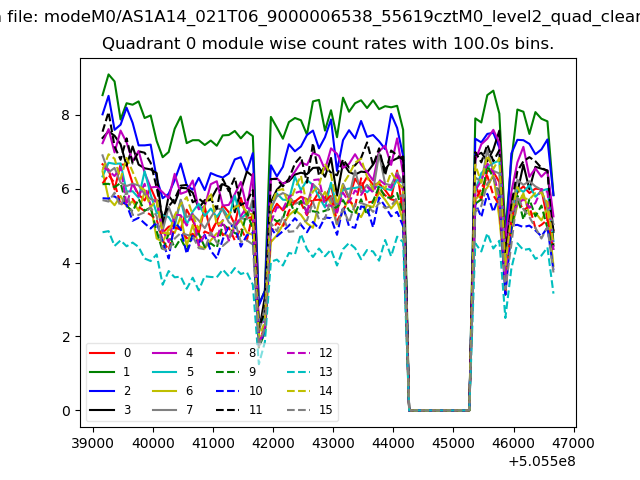 |
 |
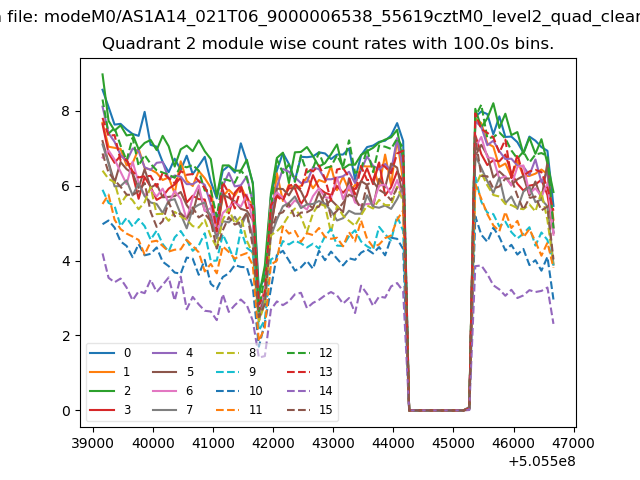
| Module-wise count rates for Quadrant B Data is divided into 100 sec bins |
 |
 |
| Module-wise count rates for Quadrant C Data is divided into 100 sec bins |
 |
 |
| Module-wise count rates for Quadrant D Data is divided into 100 sec bins |
 |
 |
| Parameter | Plot |
|---|---|
| CZT HV Monitor | 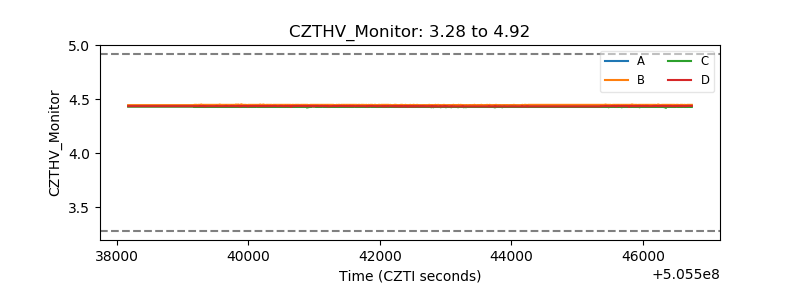 |
| D_VDD | 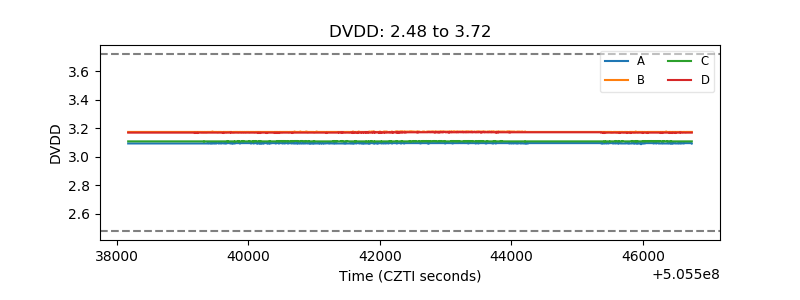 |
| Temperature 1 | 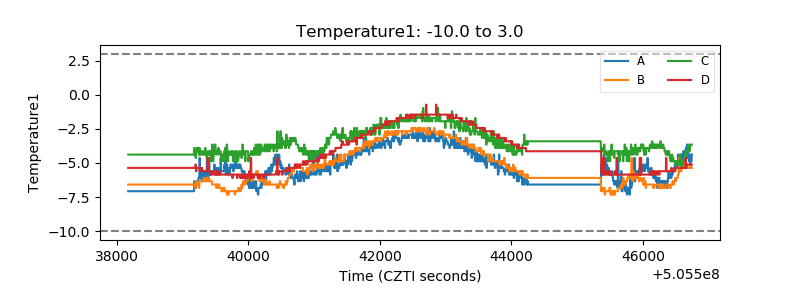 |
| Veto HV Monitor | 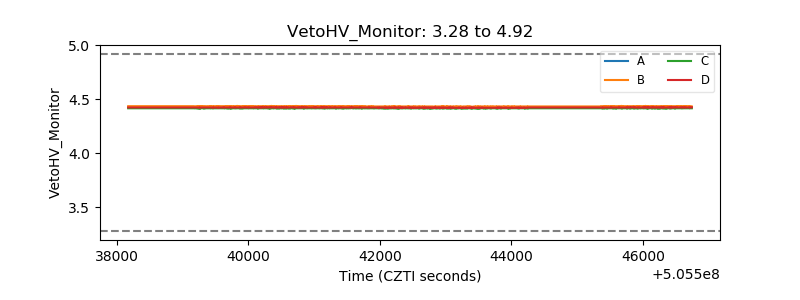 |
| Veto LLD | 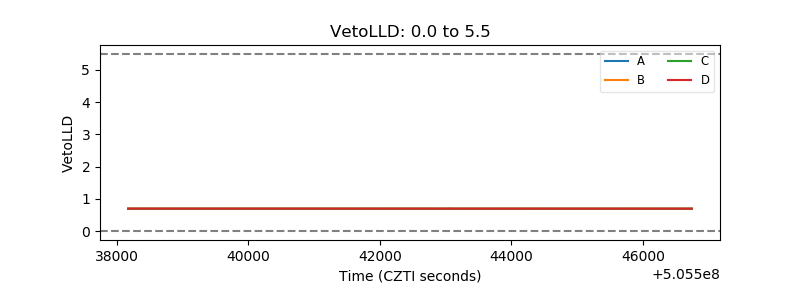 |
| Alpha Counter | 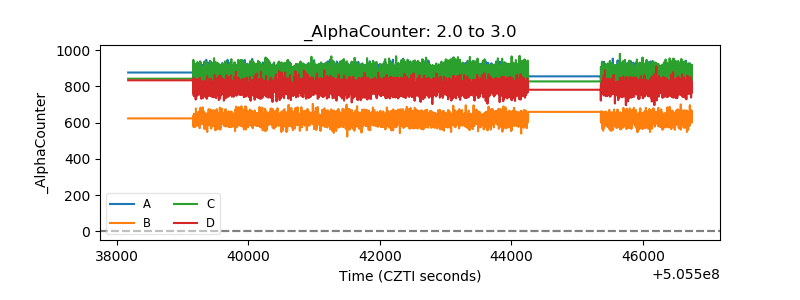 |
| _CPM_Rate | 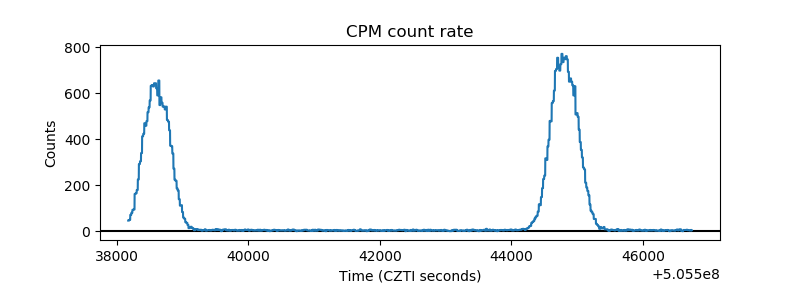 |
| CZT Counter | 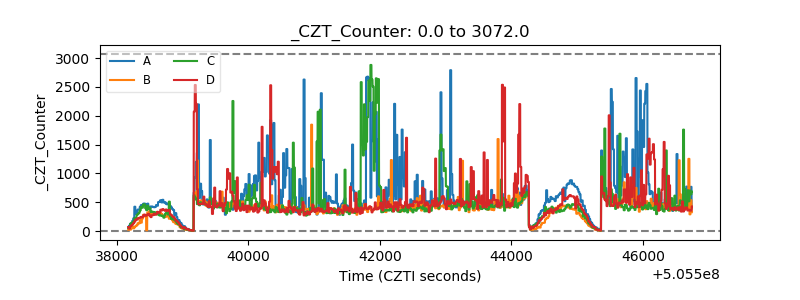 |
| +2.5 Volts monitor | 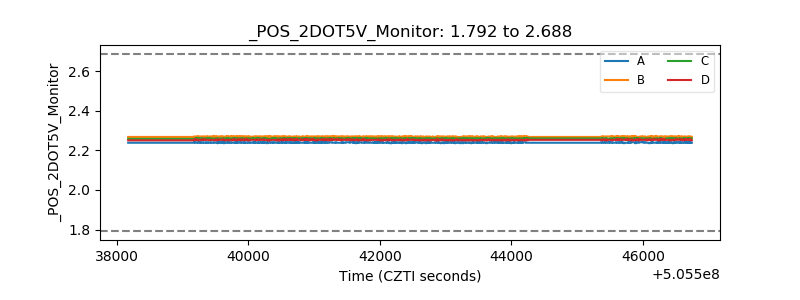 |
| +5 Volts monitor | 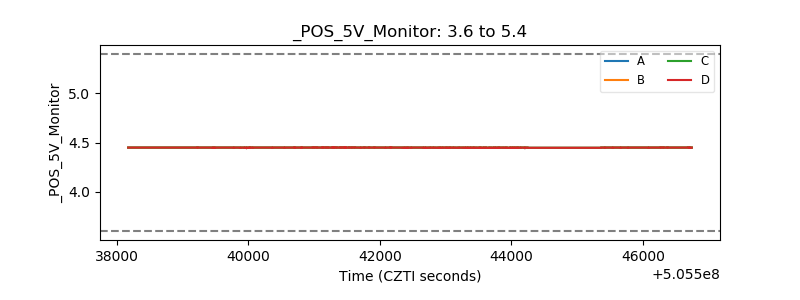 |
| _ROLL_ROT | 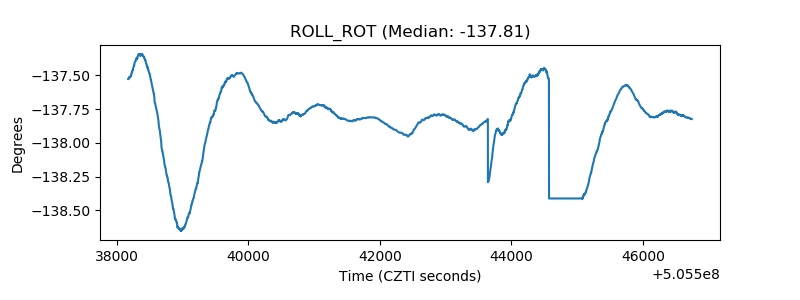 |
| _Roll_DEC | 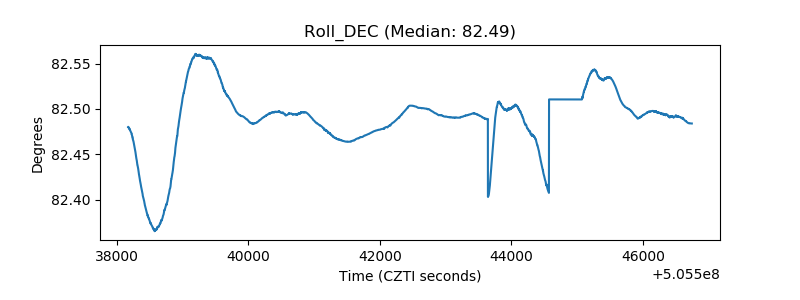 |
| _Roll_RA | 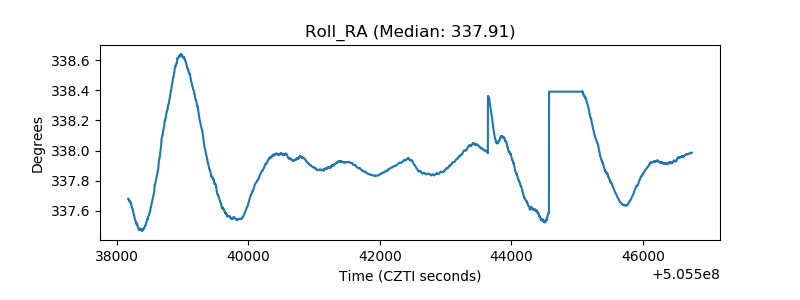 |
| Veto Counter | 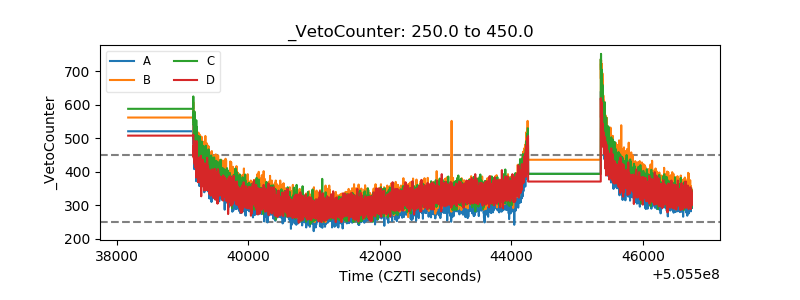 |