| Param | Original file | Final file |
|---|---|---|
| Filename | modeM0/AS1A14_021T06_9000006538_55620cztM0_level2.fits | modeM0/AS1A14_021T06_9000006538_55620cztM0_level2_quad_clean.evt |
| Size (bytes) | 441,319,680 | 94,633,920 |
| Size | 420.9 MB | 90.2 MB |
| Events in quadrant A | 5,493,808 | 586,495 |
| Events in quadrant B | 3,100,921 | 672,048 |
| Events in quadrant C | 3,712,784 | 590,701 |
| Events in quadrant D | 3,521,971 | 561,943 |
| Mode M9 | |||
|---|---|---|---|
| Quadrant | BADHDUFLAG | Total packets | Discarded packets |
| A | 0 | 14 | 0 |
| B | 0 | 15 | 0 |
| C | 0 | 15 | 0 |
| D | 0 | 15 | 0 |
| Mode M0 | |||
|---|---|---|---|
| Quadrant | BADHDUFLAG | Total packets | Discarded packets |
| A | 0 | 20765 | 1 |
| B | 0 | 14078 | 1 |
| C | 0 | 16030 | 1 |
| D | 0 | 15271 | 1 |
| Mode SS | |||
|---|---|---|---|
| Quadrant | BADHDUFLAG | Total packets | Discarded packets |
| A | 0 | 132 | 0 |
| B | 0 | 132 | 0 |
| C | 0 | 132 | 0 |
| D | 0 | 132 | 0 |
| Quadrant | Total seconds | Saturated seconds | Saturation percentage |
|---|---|---|---|
| A | 6515 | 629 | 9.654643% |
| B | 6515 | 161 | 2.471220% |
| C | 6515 | 180 | 2.762855% |
| D | 6515 | 74 | 1.135840% |
Noise dominated data is calculated using 1-second bins in cleaned event files. If a bin has >2000 counts, and if more than 50% of those come from <1% of pixels, then it is considered to be noise-dominated and hence unusable.
| Quadrant | # 1 sec bins | Bins with >0 counts | Bins with >2000 counts | High rate bins dominated by noise | Noise dominated (total time) | Noise dominated (detector-on time) | Marked lightcurve |
|---|---|---|---|---|---|---|---|
| A | 7640 | 6515 | 530 | 530 | 6.94% | 8.14% | 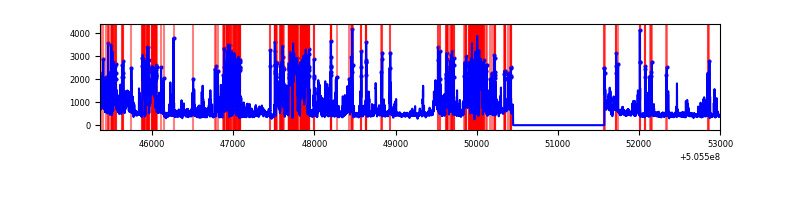 |
| B | 7640 | 6515 | 19 | 19 | 0.25% | 0.29% | 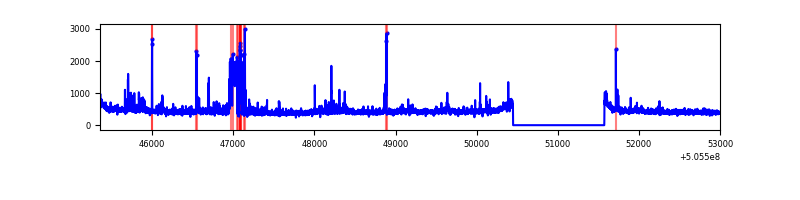 |
| C | 7640 | 6516 | 172 | 172 | 2.25% | 2.64% | 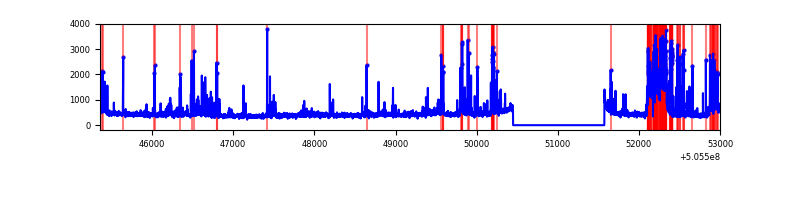 |
| D | 7640 | 6516 | 48 | 48 | 0.63% | 0.74% | 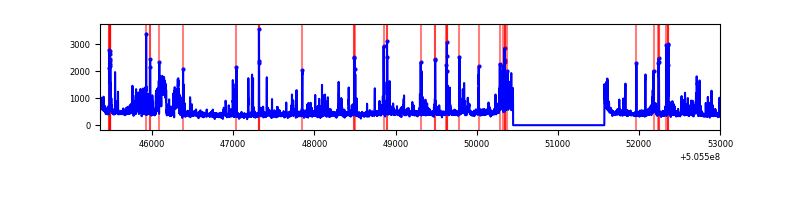 |
Top three noisy pixels from each quadrant. If the there are fewer than three noisy pixels in the level2.evt file, extra rows are filled as -1
| Pixel properties | Quadrant properties | ||||||
|---|---|---|---|---|---|---|---|
| Quadrant | DetID | PixID | Counts | Sigma | Mean | Median | Sigma |
| A | 15 | 32 | 2449491 | 14851.66 | 668 | 652 | 164.9 |
| A | 0 | 8 | 234923 | 1420.8 | 668 | 652 | 164.9 |
| A | 3 | 14 | 115819 | 698.46 | 668 | 652 | 164.9 |
| B | 5 | 185 | 107129 | 734.5 | 678 | 655 | 145.0 |
| B | 4 | 142 | 54137 | 368.94 | 678 | 655 | 145.0 |
| B | 4 | 12 | 40538 | 275.13 | 678 | 655 | 145.0 |
| C | 12 | 2 | 503381 | 2795.19 | 656 | 650 | 179.9 |
| C | 13 | 3 | 213709 | 1184.61 | 656 | 650 | 179.9 |
| C | 9 | 38 | 201839 | 1118.61 | 656 | 650 | 179.9 |
| D | 8 | 160 | 361062 | 1969.1 | 657 | 627 | 183.0 |
| D | 11 | 129 | 120814 | 656.6 | 657 | 627 | 183.0 |
| D | 15 | 234 | 73183 | 396.38 | 657 | 627 | 183.0 |
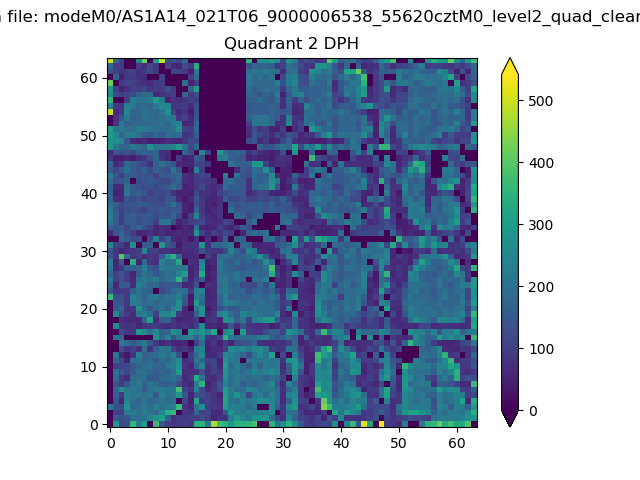
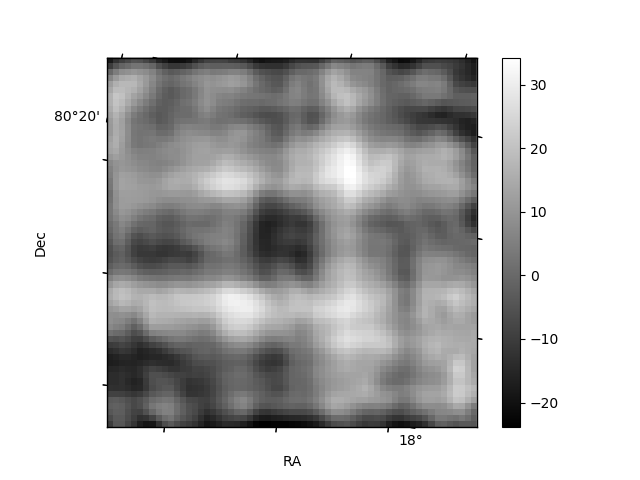
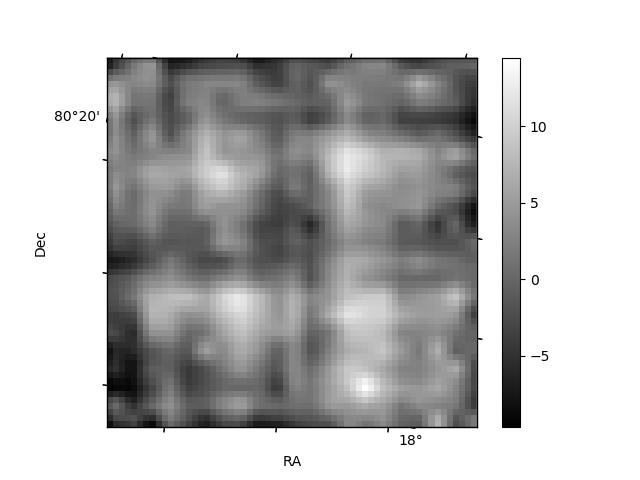
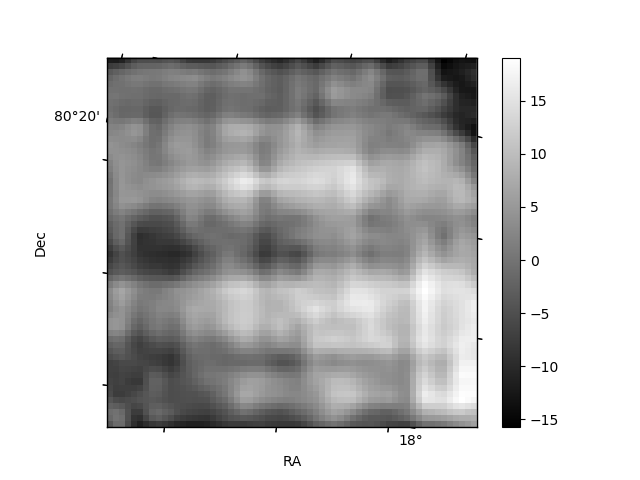
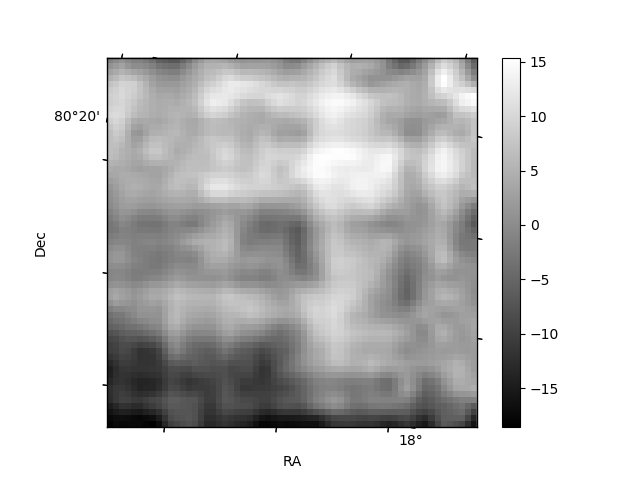
Histogram calculated using DETX and DETY for each event in the final _common_clean file
| Quadrant A | 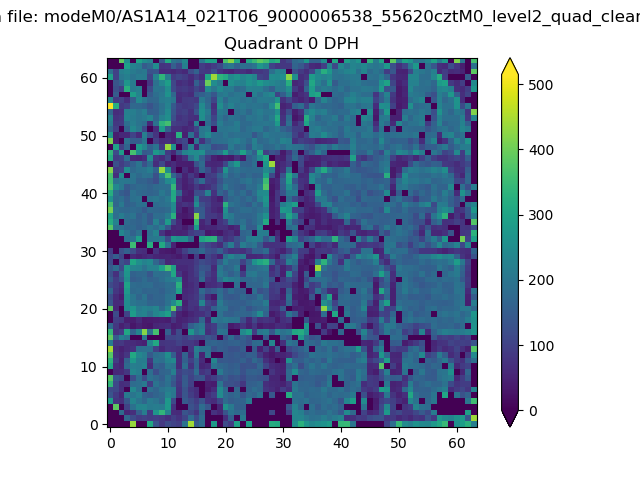 |
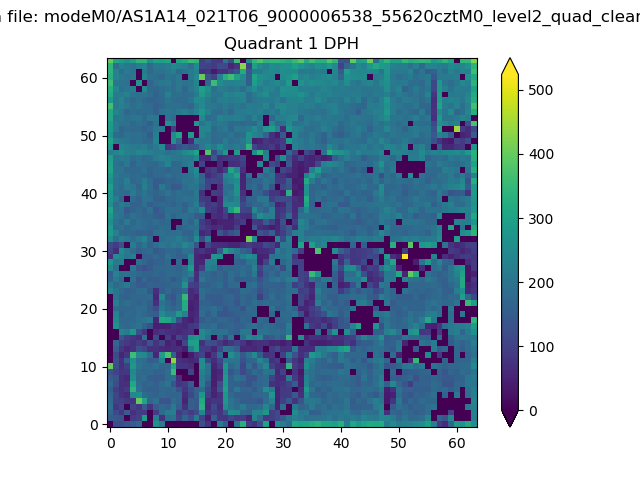 |
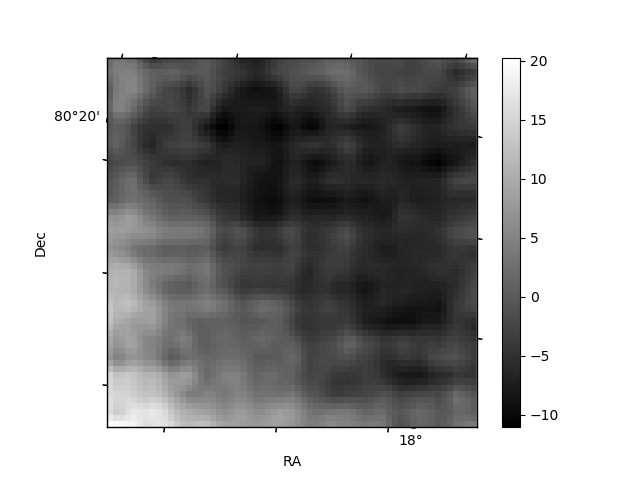
Quadrant B |
|---|---|---|---|
| Quadrant D | 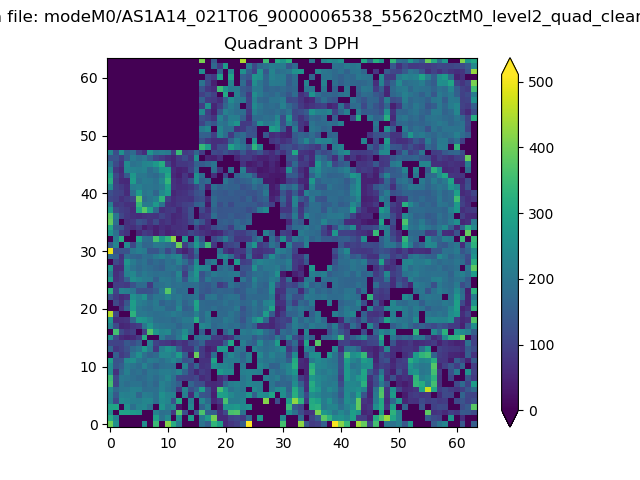 |
 |
Quadrant C |
| Plot type | Count rate plots | Images |
|---|---|---|
| Comparison with Poisson distribution Blue bars denote a histogram of data divided into 1 sec bins. Red curve is a Poisson curve with rate = median count rate of data. |
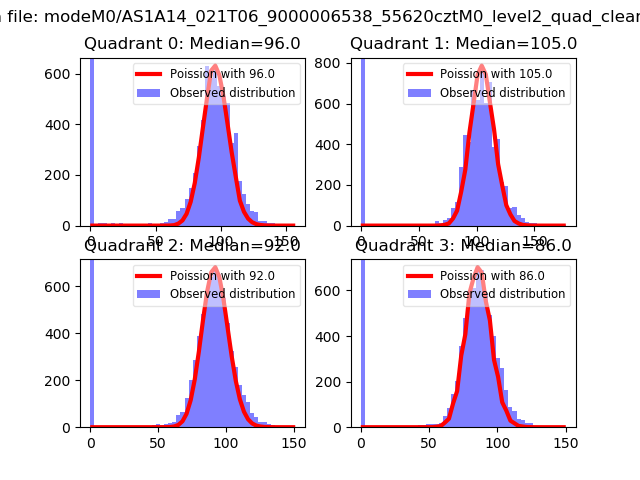 |
 |
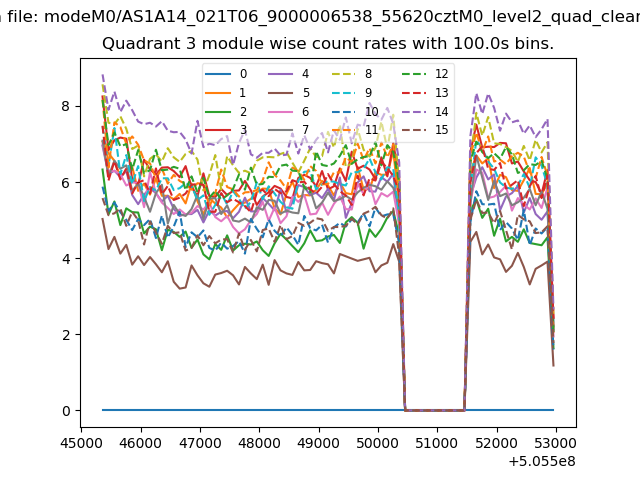
| Quadrant-wise count rates Data is divided into 100 sec bins |
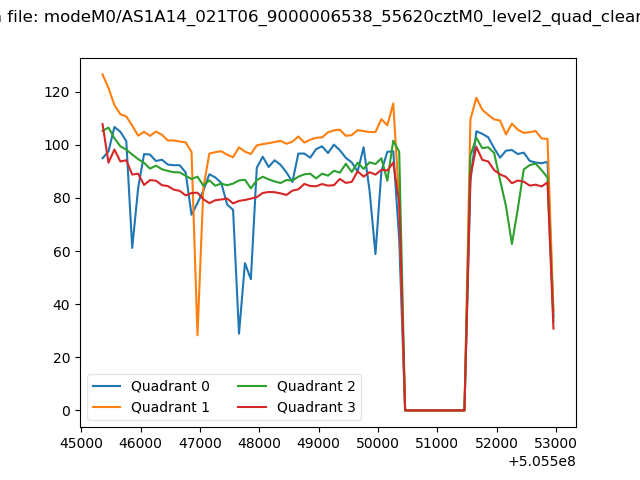 |
|
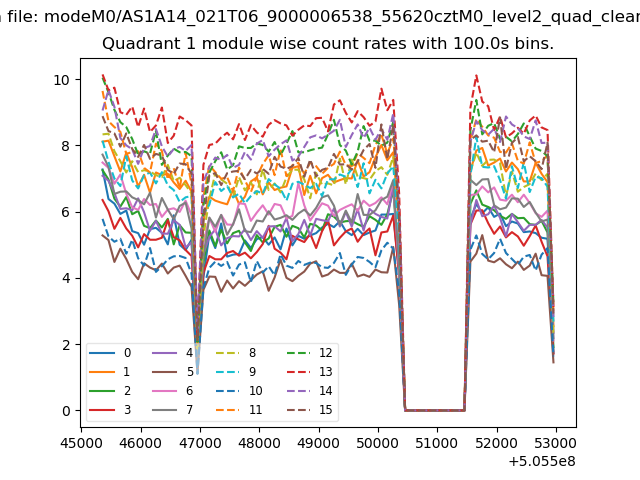
| Module-wise count rates for Quadrant A Data is divided into 100 sec bins |
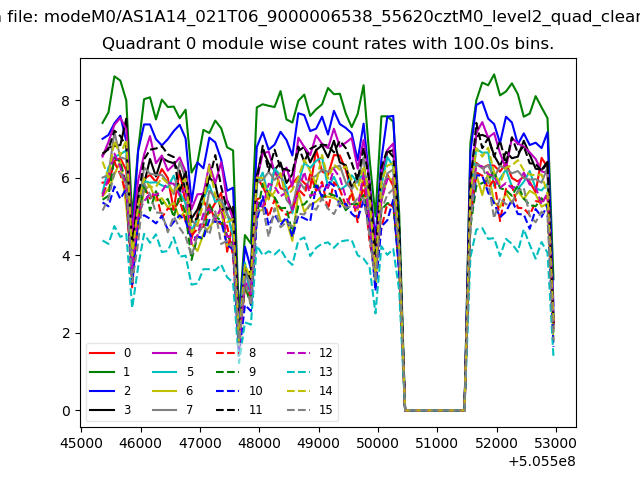 |
 |
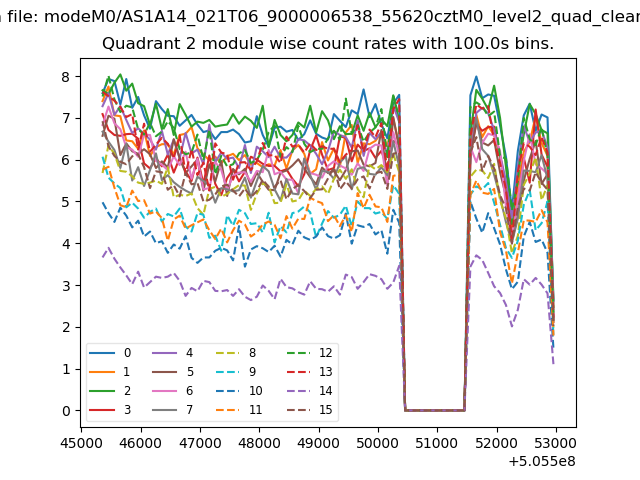
| Module-wise count rates for Quadrant B Data is divided into 100 sec bins |
 |
 |
| Module-wise count rates for Quadrant C Data is divided into 100 sec bins |
 |
 |
| Module-wise count rates for Quadrant D Data is divided into 100 sec bins |
 |
 |
| Parameter | Plot |
|---|---|
| CZT HV Monitor | 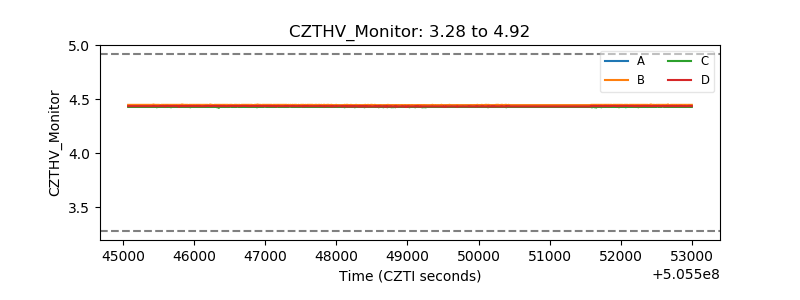 |
| D_VDD | 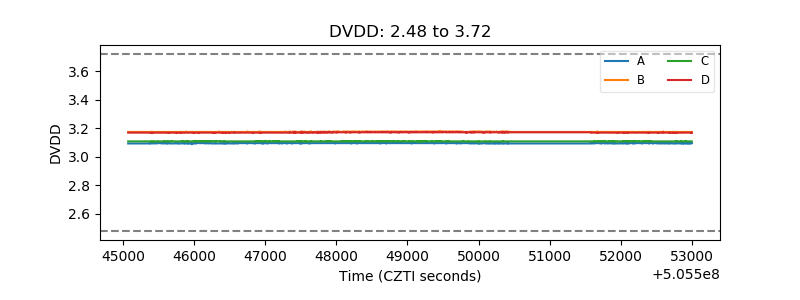 |
| Temperature 1 | 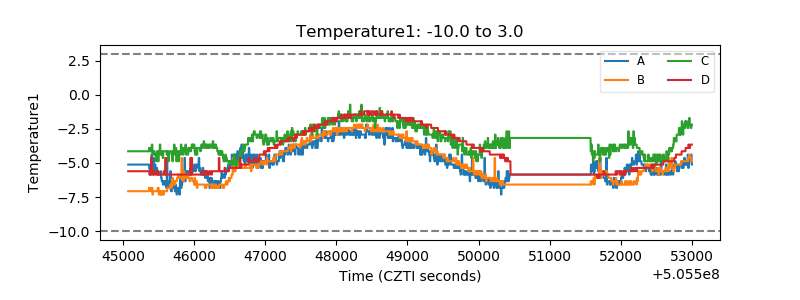 |
| Veto HV Monitor | 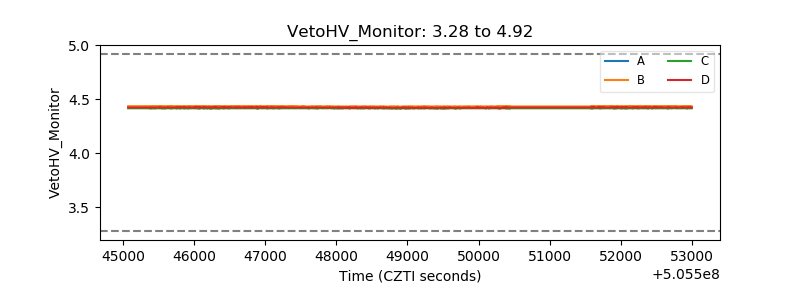 |
| Veto LLD | 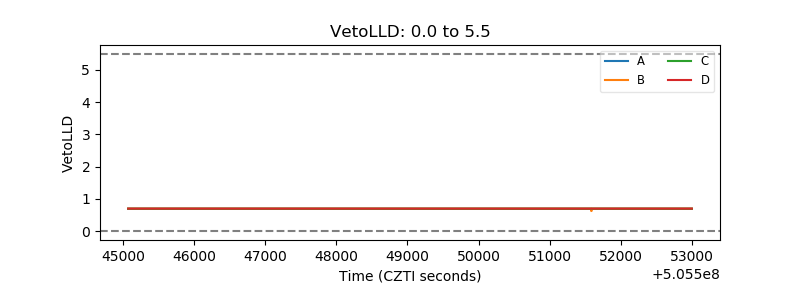 |
| Alpha Counter | 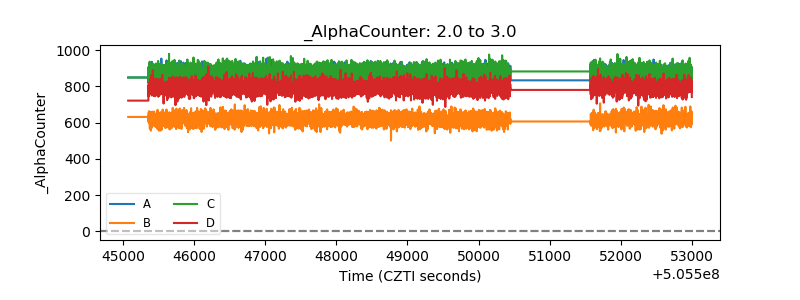 |
| _CPM_Rate | 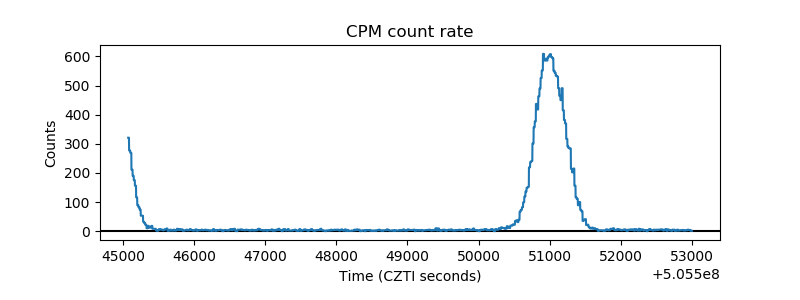 |
| CZT Counter | 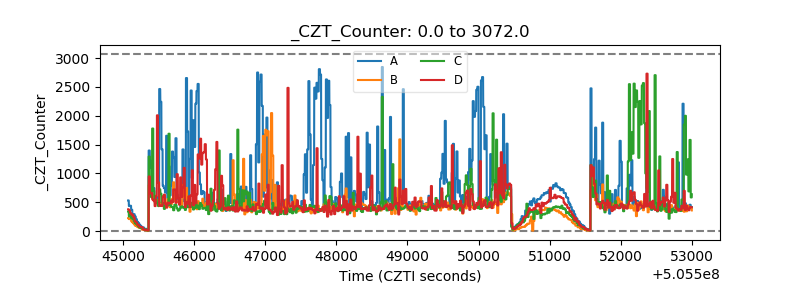 |
| +2.5 Volts monitor | 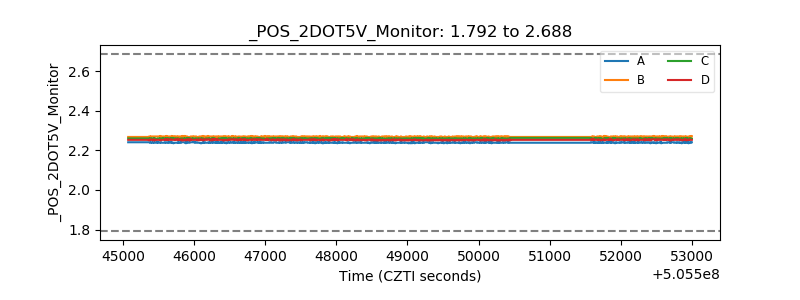 |
| +5 Volts monitor | 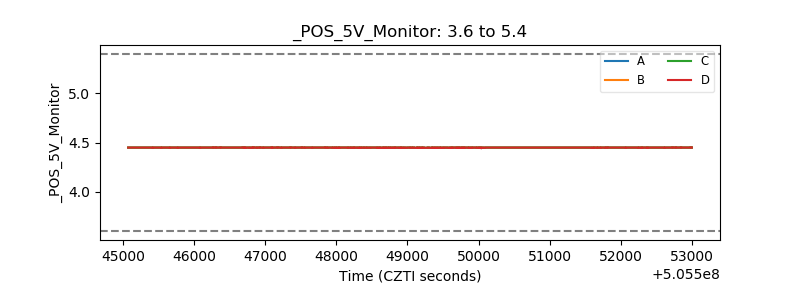 |
| _ROLL_ROT | 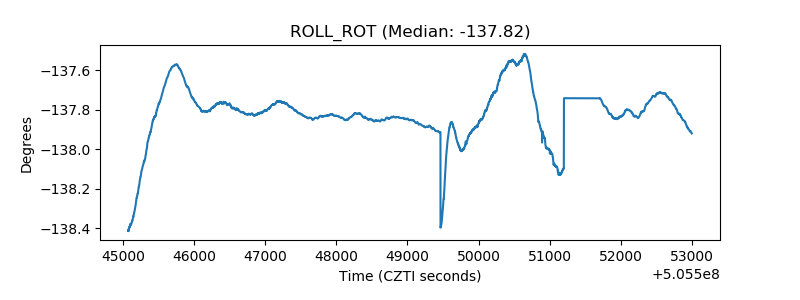 |
| _Roll_DEC | 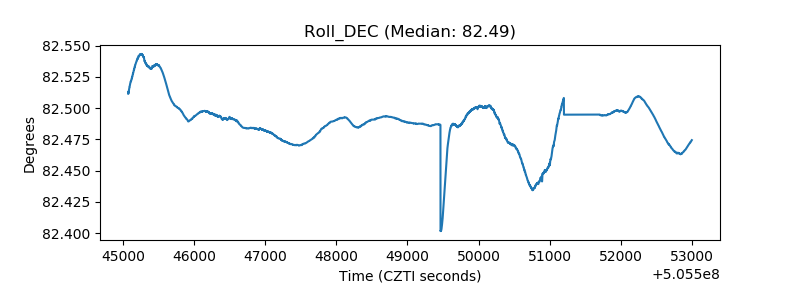 |
| _Roll_RA | 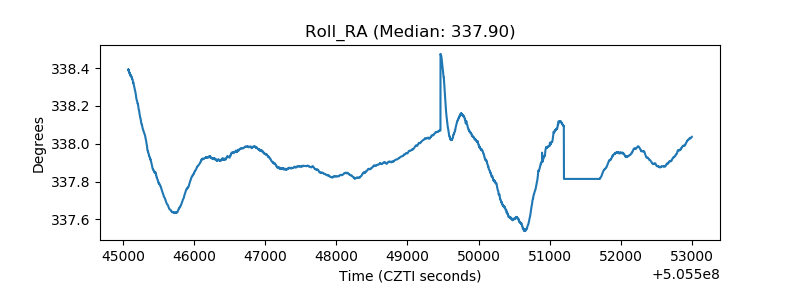 |
| Veto Counter | 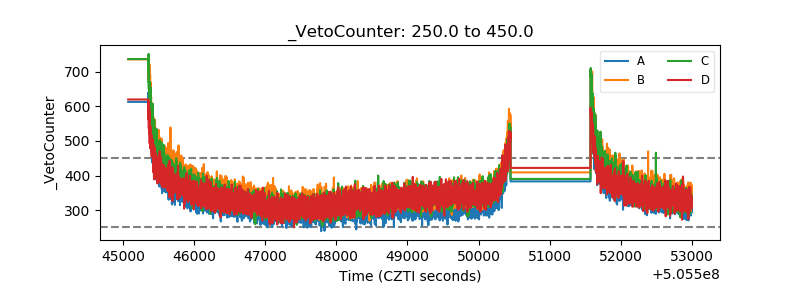 |