| Param | Original file | Final file |
|---|---|---|
| Filename | modeM0/AS1A14_021T06_9000006538_55621cztM0_level2.fits | modeM0/AS1A14_021T06_9000006538_55621cztM0_level2_quad_clean.evt |
| Size (bytes) | 440,170,560 | 92,831,040 |
| Size | 419.8 MB | 88.5 MB |
| Events in quadrant A | 3,687,374 | 613,536 |
| Events in quadrant B | 2,744,885 | 667,808 |
| Events in quadrant C | 4,155,353 | 564,997 |
| Events in quadrant D | 5,204,117 | 514,859 |
| Mode M9 | |||
|---|---|---|---|
| Quadrant | BADHDUFLAG | Total packets | Discarded packets |
| A | 0 | 11 | 0 |
| B | 0 | 11 | 0 |
| C | 0 | 11 | 0 |
| D | 0 | 11 | 0 |
| Mode M0 | |||
|---|---|---|---|
| Quadrant | BADHDUFLAG | Total packets | Discarded packets |
| A | 0 | 15367 | 1 |
| B | 0 | 13219 | 1 |
| C | 0 | 17302 | 3 |
| D | 0 | 20015 | 1 |
| Mode SS | |||
|---|---|---|---|
| Quadrant | BADHDUFLAG | Total packets | Discarded packets |
| A | 0 | 130 | 0 |
| B | 0 | 130 | 0 |
| C | 0 | 130 | 0 |
| D | 0 | 130 | 0 |
| Quadrant | Total seconds | Saturated seconds | Saturation percentage |
|---|---|---|---|
| A | 6451 | 191 | 2.960781% |
| B | 6452 | 103 | 1.596404% |
| C | 6451 | 363 | 5.627035% |
| D | 6451 | 572 | 8.866842% |
Noise dominated data is calculated using 1-second bins in cleaned event files. If a bin has >2000 counts, and if more than 50% of those come from <1% of pixels, then it is considered to be noise-dominated and hence unusable.
| Quadrant | # 1 sec bins | Bins with >0 counts | Bins with >2000 counts | High rate bins dominated by noise | Noise dominated (total time) | Noise dominated (detector-on time) | Marked lightcurve |
|---|---|---|---|---|---|---|---|
| A | 7531 | 6452 | 121 | 121 | 1.61% | 1.88% | 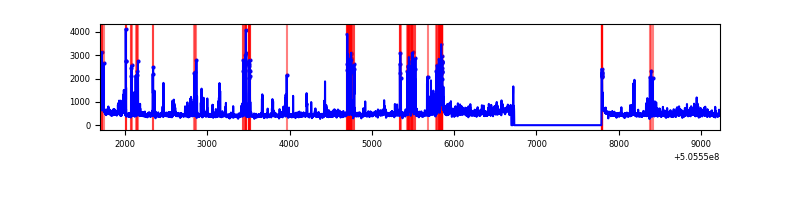 |
| B | 7532 | 6453 | 16 | 16 | 0.21% | 0.25% | 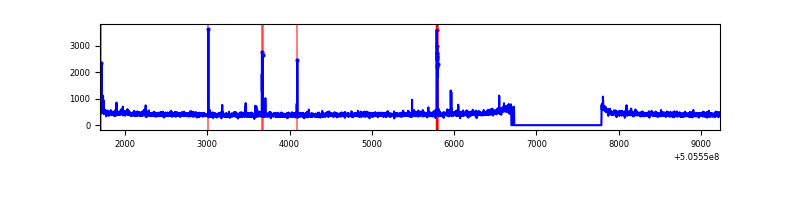 |
| C | 7531 | 6453 | 336 | 336 | 4.46% | 5.21% | 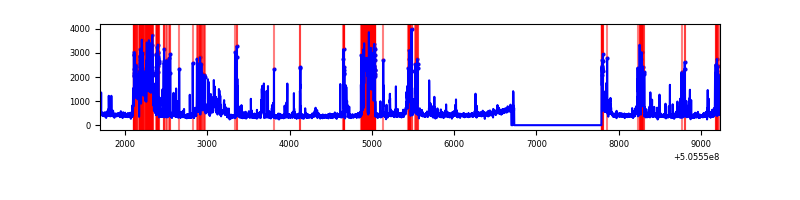 |
| D | 7530 | 6451 | 544 | 544 | 7.22% | 8.43% | 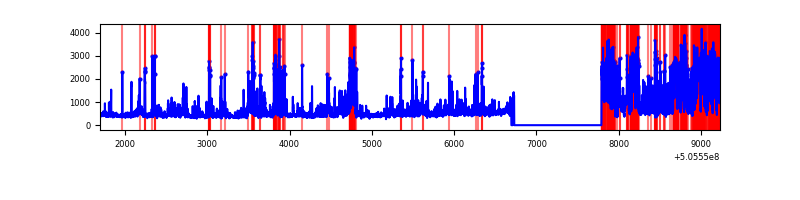 |
Top three noisy pixels from each quadrant. If the there are fewer than three noisy pixels in the level2.evt file, extra rows are filled as -1
| Pixel properties | Quadrant properties | ||||||
|---|---|---|---|---|---|---|---|
| Quadrant | DetID | PixID | Counts | Sigma | Mean | Median | Sigma |
| A | 15 | 32 | 312849 | 1889.21 | 672 | 655 | 165.3 |
| A | 0 | 8 | 258501 | 1560.33 | 672 | 655 | 165.3 |
| A | 8 | 249 | 175706 | 1059.3 | 672 | 655 | 165.3 |
| B | 5 | 185 | 32591 | 223.78 | 667 | 642 | 142.8 |
| B | 10 | 247 | 31648 | 217.17 | 667 | 642 | 142.8 |
| B | 12 | 111 | 17047 | 114.9 | 667 | 642 | 142.8 |
| C | 12 | 2 | 721685 | 4114.53 | 636 | 630 | 175.2 |
| C | 13 | 3 | 555758 | 3167.7 | 636 | 630 | 175.2 |
| C | 9 | 38 | 94519 | 535.76 | 636 | 630 | 175.2 |
| D | 8 | 160 | 1746475 | 9864.36 | 627 | 600 | 177.0 |
| D | 11 | 129 | 501301 | 2829.01 | 627 | 600 | 177.0 |
| D | 12 | 191 | 144157 | 811.11 | 627 | 600 | 177.0 |
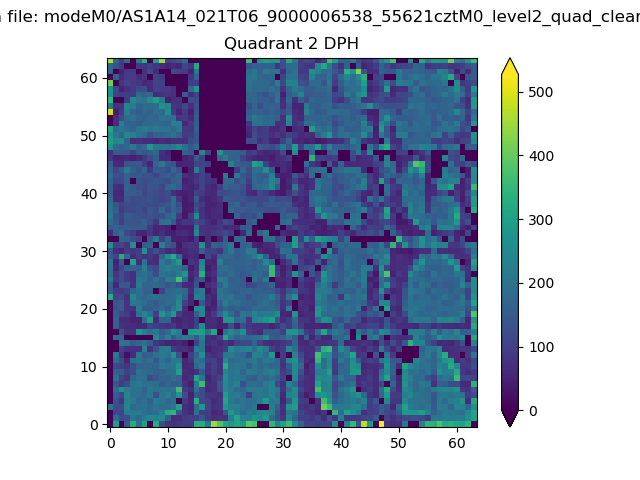
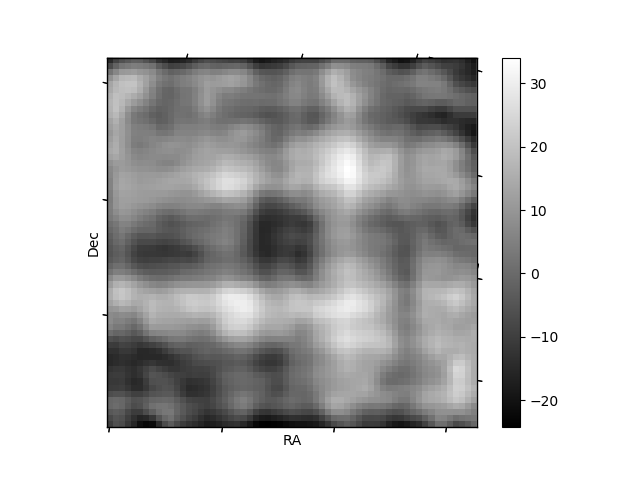
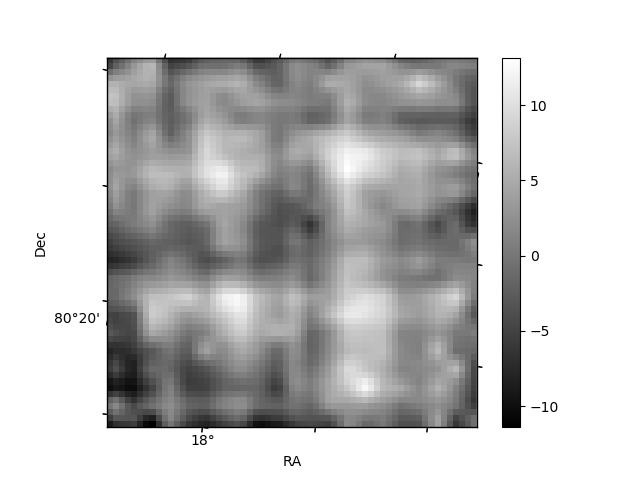
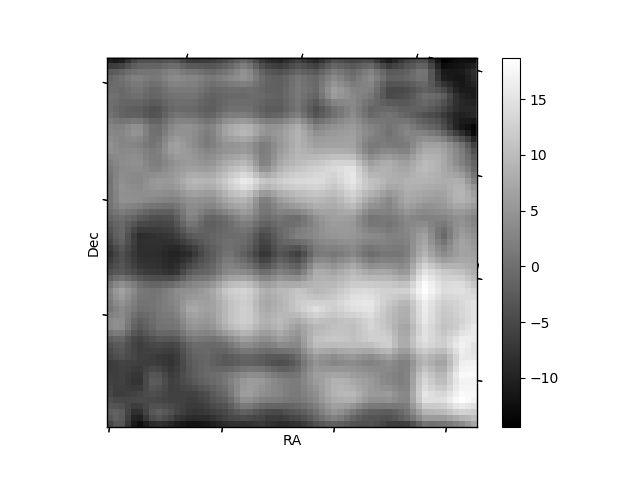
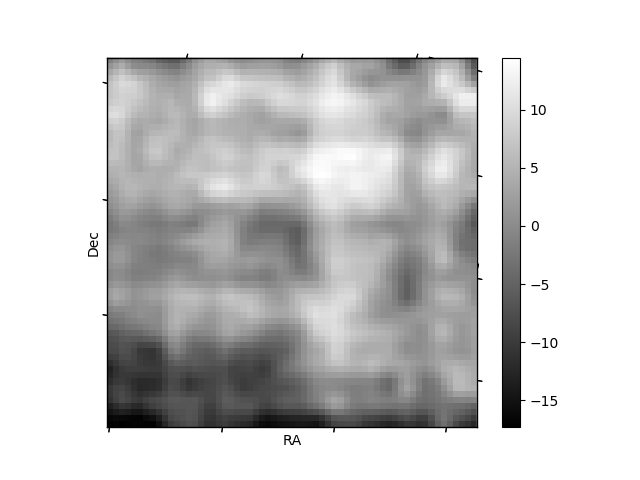
Histogram calculated using DETX and DETY for each event in the final _common_clean file
| Quadrant A | 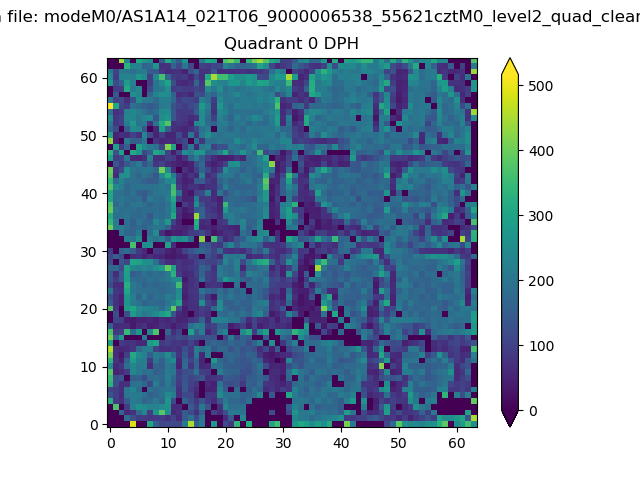 |
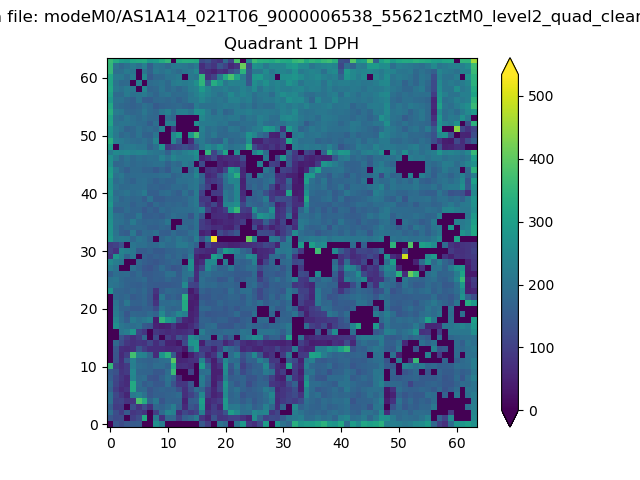 |
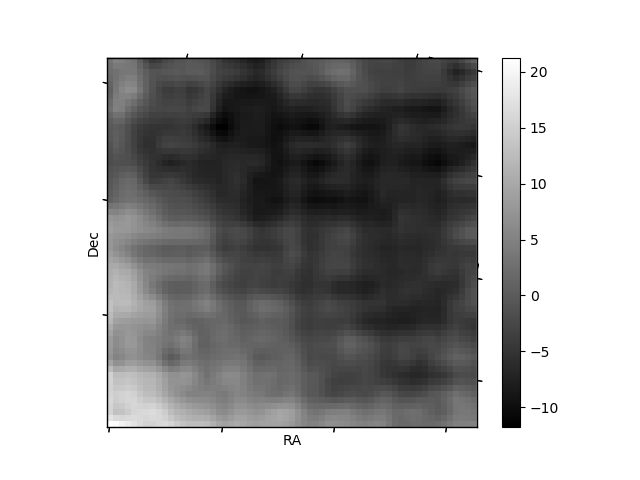
Quadrant B |
|---|---|---|---|
| Quadrant D | 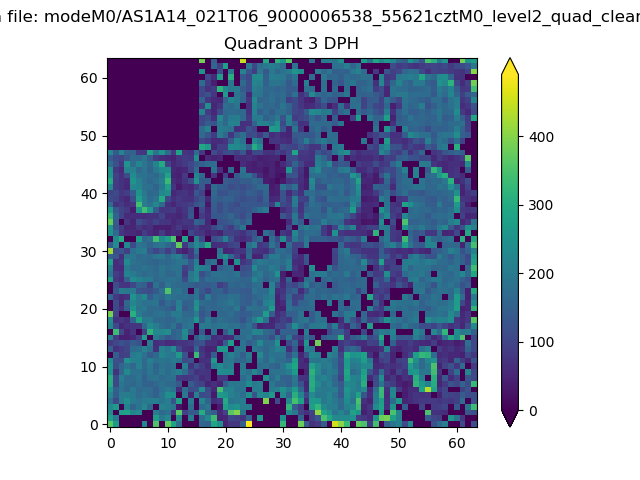 |
 |
Quadrant C |
| Plot type | Count rate plots | Images |
|---|---|---|
| Comparison with Poisson distribution Blue bars denote a histogram of data divided into 1 sec bins. Red curve is a Poisson curve with rate = median count rate of data. |
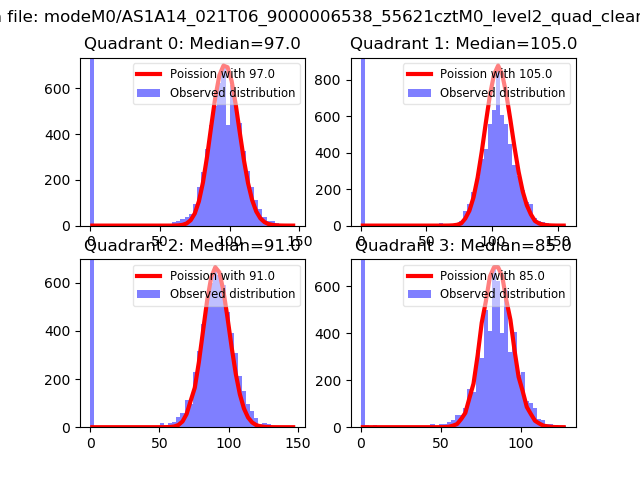 |
 |
| Quadrant-wise count rates Data is divided into 100 sec bins |
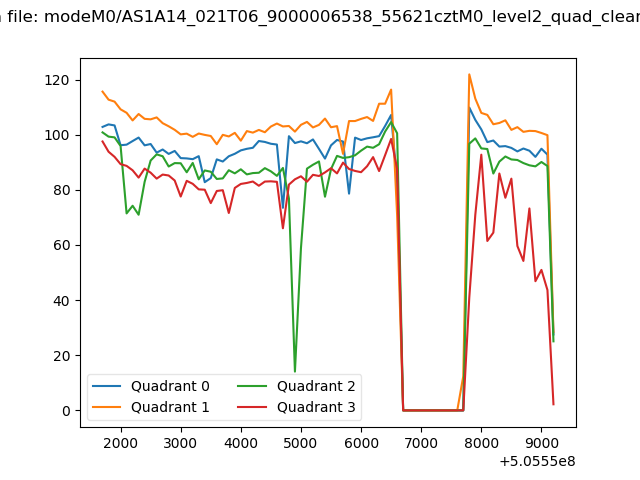 |
|
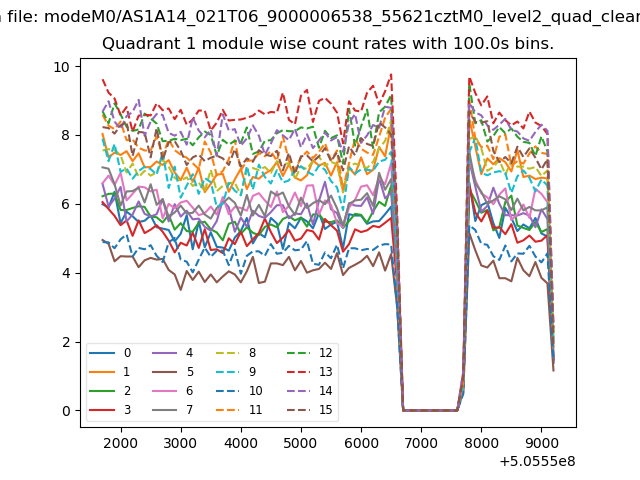
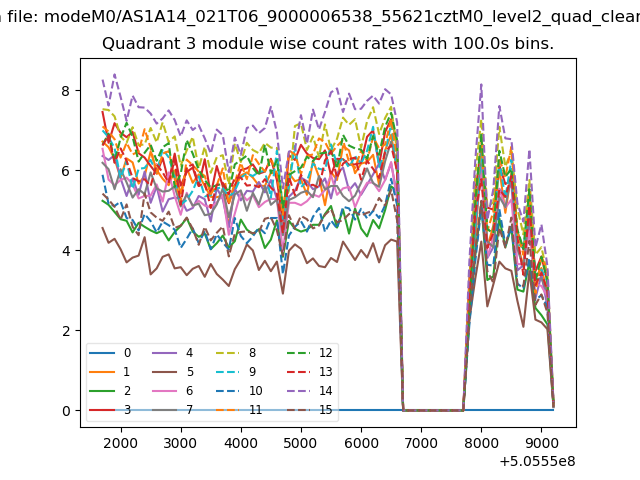
| Module-wise count rates for Quadrant A Data is divided into 100 sec bins |
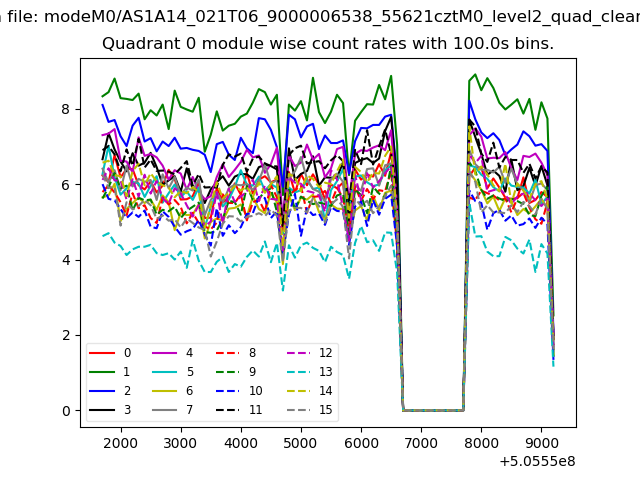 |
 |
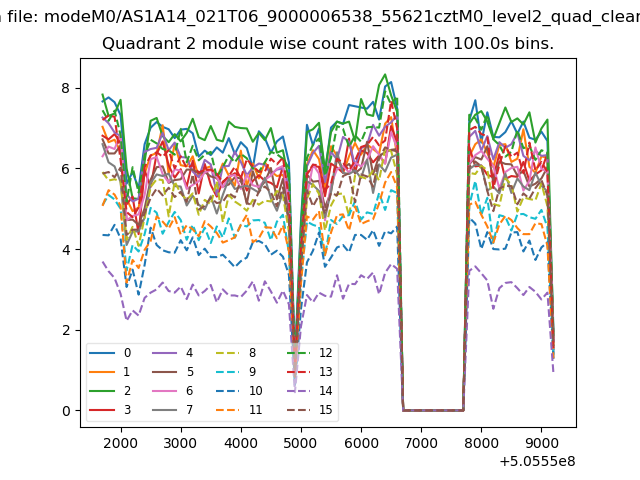
| Module-wise count rates for Quadrant B Data is divided into 100 sec bins |
 |
 |
| Module-wise count rates for Quadrant C Data is divided into 100 sec bins |
 |
 |
| Module-wise count rates for Quadrant D Data is divided into 100 sec bins |
 |
 |
| Parameter | Plot |
|---|---|
| CZT HV Monitor | 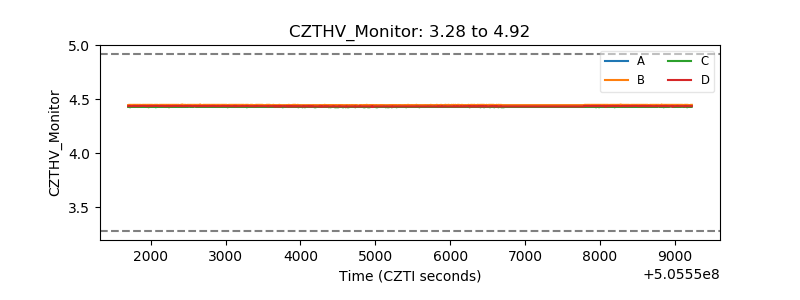 |
| D_VDD | 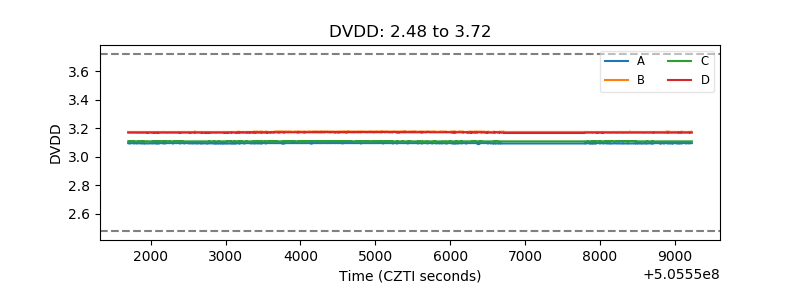 |
| Temperature 1 | 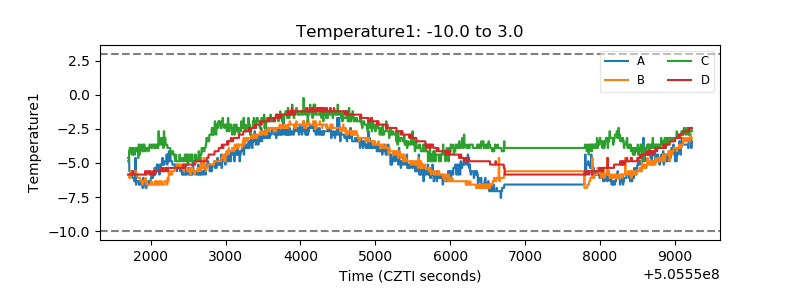 |
| Veto HV Monitor | 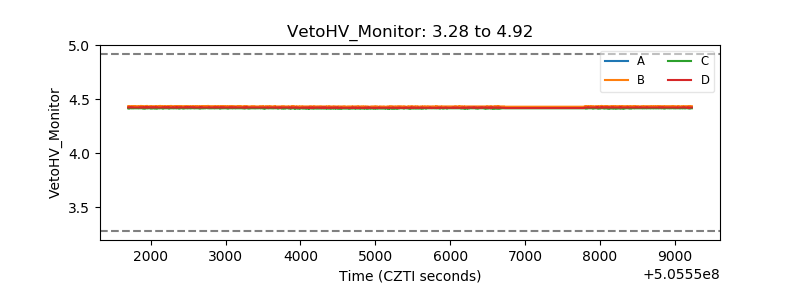 |
| Veto LLD | 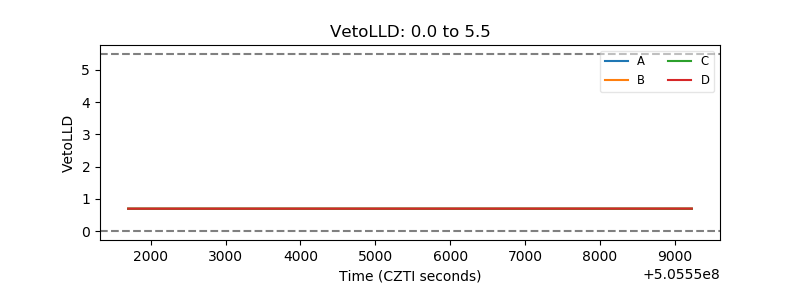 |
| Alpha Counter | 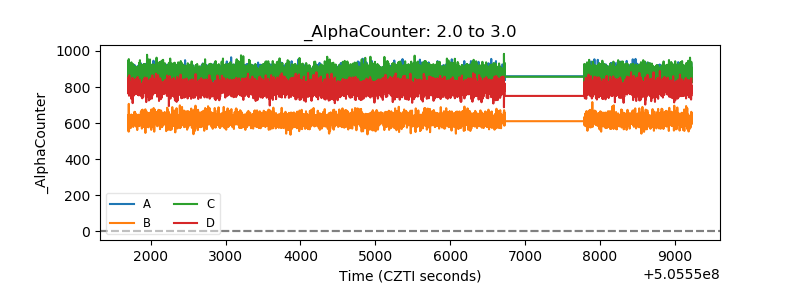 |
| _CPM_Rate | 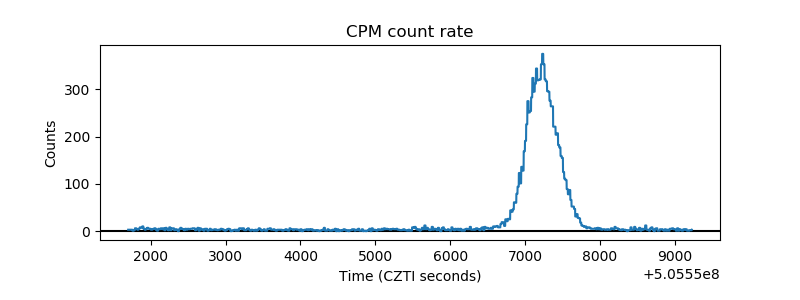 |
| CZT Counter | 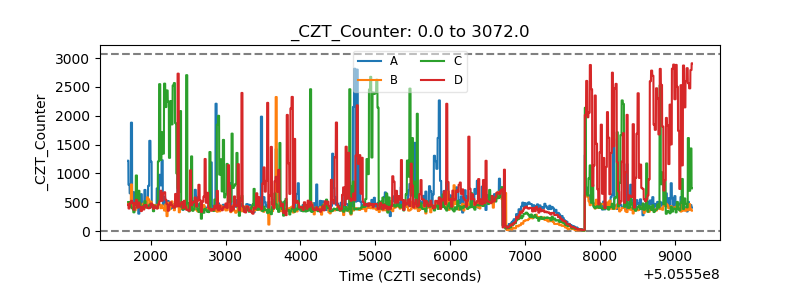 |
| +2.5 Volts monitor |  |
| +5 Volts monitor |  |
| _ROLL_ROT | 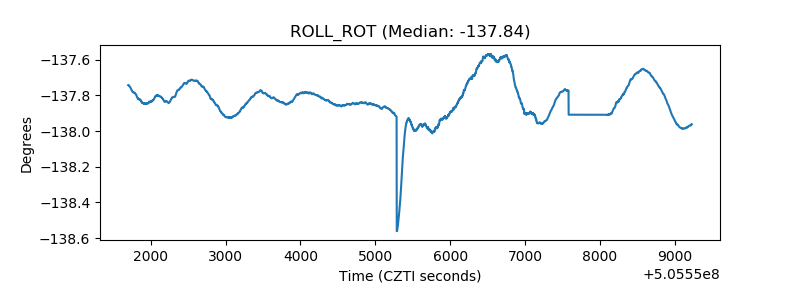 |
| _Roll_DEC | 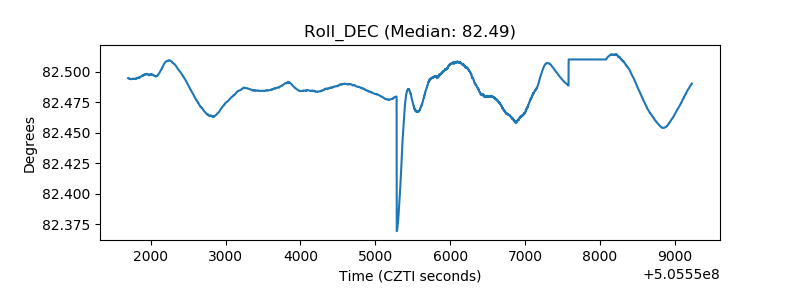 |
| _Roll_RA | 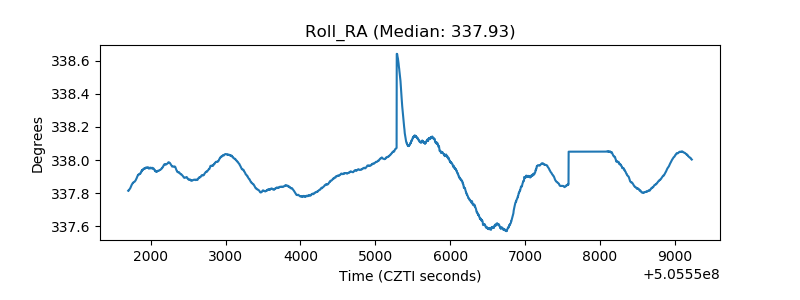 |
| Veto Counter | 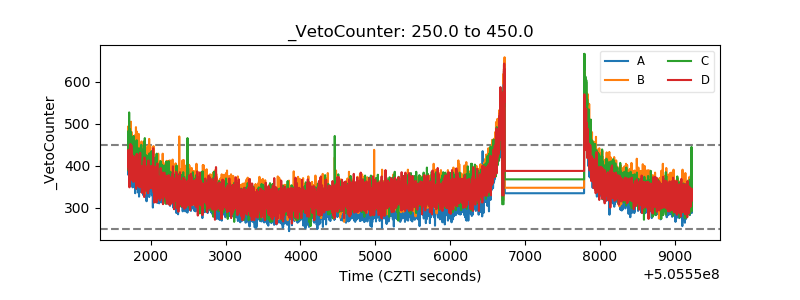 |