| Param | Original file | Final file |
|---|---|---|
| Filename | modeM0/AS1A14_021T06_9000006538_55622cztM0_level2.fits | modeM0/AS1A14_021T06_9000006538_55622cztM0_level2_quad_clean.evt |
| Size (bytes) | 501,396,480 | 89,311,680 |
| Size | 478.2 MB | 85.2 MB |
| Events in quadrant A | 4,966,472 | 566,486 |
| Events in quadrant B | 2,727,632 | 655,286 |
| Events in quadrant C | 3,645,958 | 564,857 |
| Events in quadrant D | 6,718,253 | 467,414 |
| Mode M9 | |||
|---|---|---|---|
| Quadrant | BADHDUFLAG | Total packets | Discarded packets |
| A | 0 | 10 | 0 |
| B | 0 | 10 | 0 |
| C | 0 | 10 | 0 |
| D | 0 | 10 | 0 |
| Mode M0 | |||
|---|---|---|---|
| Quadrant | BADHDUFLAG | Total packets | Discarded packets |
| A | 0 | 19196 | 1 |
| B | 0 | 13157 | 1 |
| C | 0 | 15868 | 1 |
| D | 0 | 24409 | 1 |
| Mode SS | |||
|---|---|---|---|
| Quadrant | BADHDUFLAG | Total packets | Discarded packets |
| A | 0 | 130 | 0 |
| B | 0 | 130 | 0 |
| C | 0 | 130 | 0 |
| D | 0 | 130 | 0 |
| Quadrant | Total seconds | Saturated seconds | Saturation percentage |
|---|---|---|---|
| A | 6456 | 613 | 9.495043% |
| B | 6457 | 90 | 1.393836% |
| C | 6457 | 239 | 3.701409% |
| D | 6457 | 1079 | 16.710547% |
Noise dominated data is calculated using 1-second bins in cleaned event files. If a bin has >2000 counts, and if more than 50% of those come from <1% of pixels, then it is considered to be noise-dominated and hence unusable.
| Quadrant | # 1 sec bins | Bins with >0 counts | Bins with >2000 counts | High rate bins dominated by noise | Noise dominated (total time) | Noise dominated (detector-on time) | Marked lightcurve |
|---|---|---|---|---|---|---|---|
| A | 7406 | 6456 | 446 | 446 | 6.02% | 6.91% | 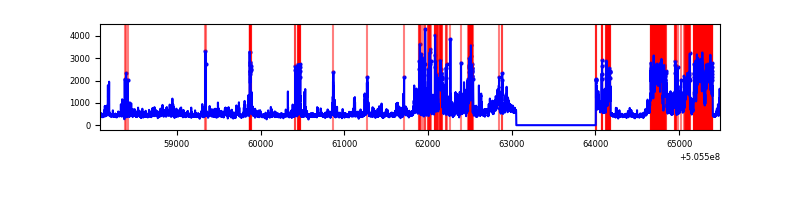 |
| B | 7407 | 6457 | 4 | 4 | 0.05% | 0.06% | 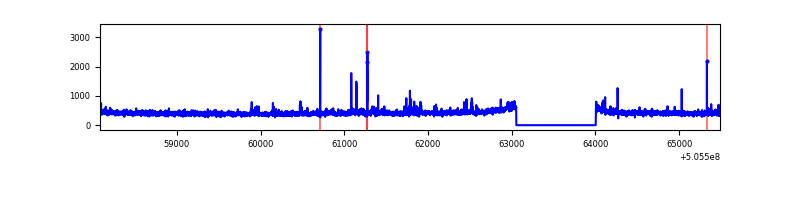 |
| C | 7407 | 6458 | 209 | 209 | 2.82% | 3.24% | 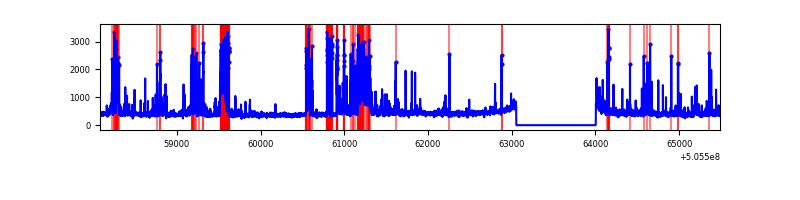 |
| D | 7407 | 6457 | 1029 | 1029 | 13.89% | 15.94% | 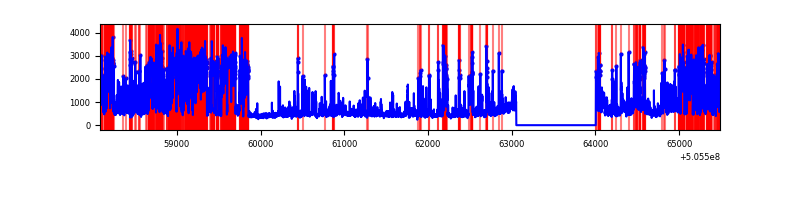 |
Top three noisy pixels from each quadrant. If the there are fewer than three noisy pixels in the level2.evt file, extra rows are filled as -1
| Pixel properties | Quadrant properties | ||||||
|---|---|---|---|---|---|---|---|
| Quadrant | DetID | PixID | Counts | Sigma | Mean | Median | Sigma |
| A | 12 | 115 | 1333488 | 8217.67 | 655 | 638 | 162.2 |
| A | 15 | 32 | 477419 | 2939.58 | 655 | 638 | 162.2 |
| A | 8 | 249 | 282609 | 1738.49 | 655 | 638 | 162.2 |
| B | 7 | 252 | 25216 | 174.8 | 660 | 636 | 140.6 |
| B | 7 | 0 | 19155 | 131.7 | 660 | 636 | 140.6 |
| B | 10 | 247 | 18352 | 125.99 | 660 | 636 | 140.6 |
| C | 13 | 3 | 479686 | 2772.79 | 635 | 627 | 172.8 |
| C | 12 | 2 | 193369 | 1115.59 | 635 | 627 | 172.8 |
| C | 12 | 250 | 125711 | 723.98 | 635 | 627 | 172.8 |
| D | 8 | 160 | 2556601 | 14894.46 | 607 | 579 | 171.6 |
| D | 11 | 129 | 980803 | 5711.96 | 607 | 579 | 171.6 |
| D | 8 | 245 | 282287 | 1641.57 | 607 | 579 | 171.6 |
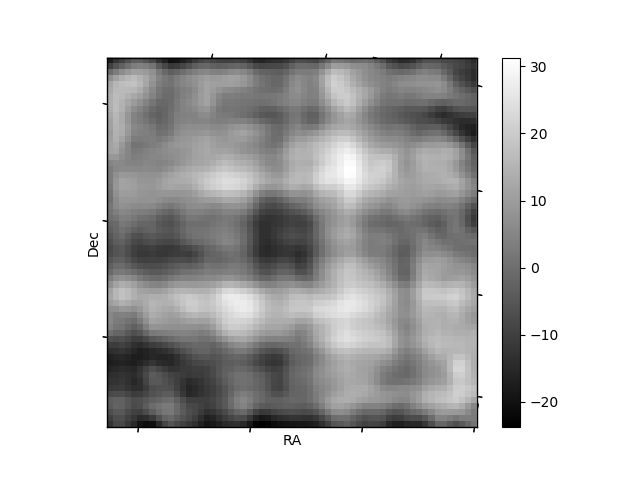
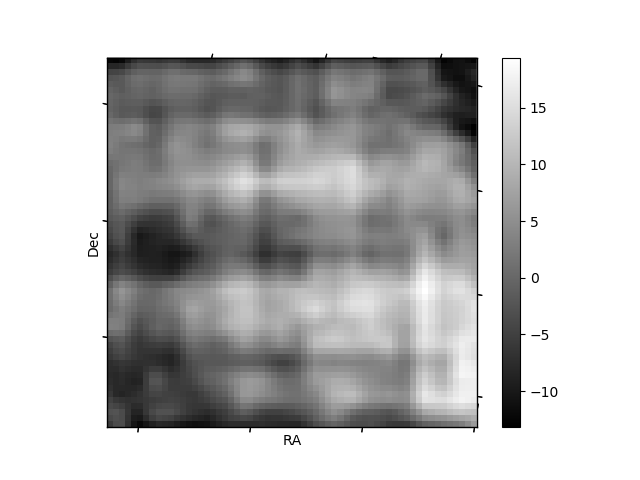
Histogram calculated using DETX and DETY for each event in the final _common_clean file
| Quadrant A | 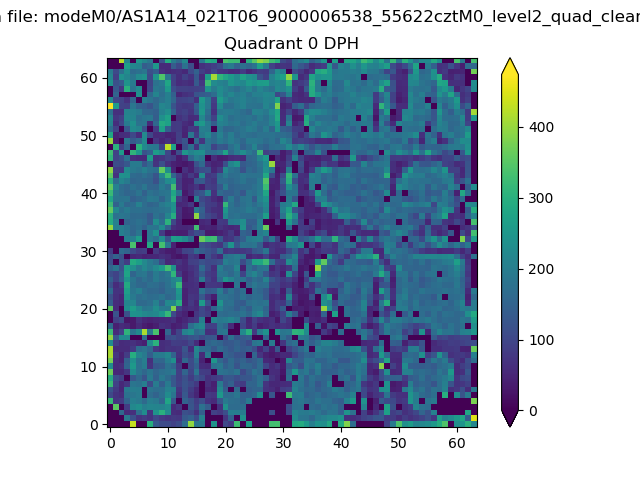 |
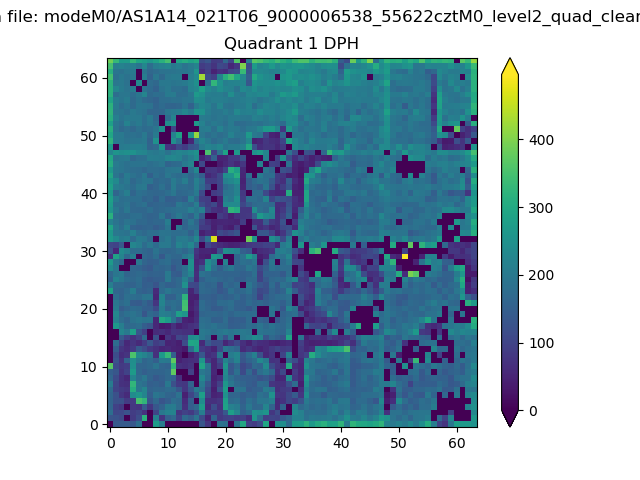 |
Quadrant B |
|---|---|---|---|
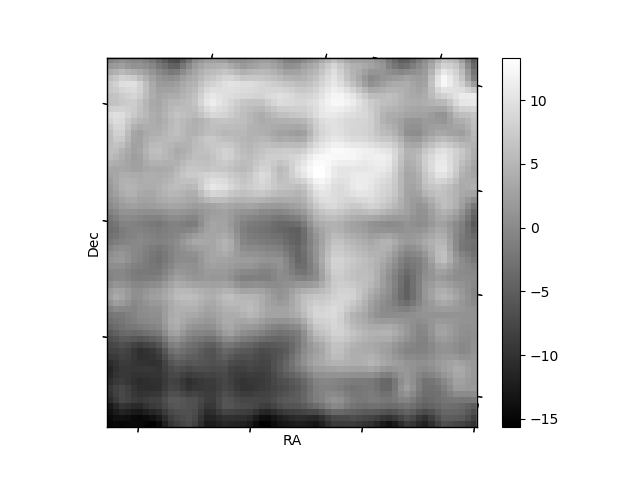
| Quadrant D | 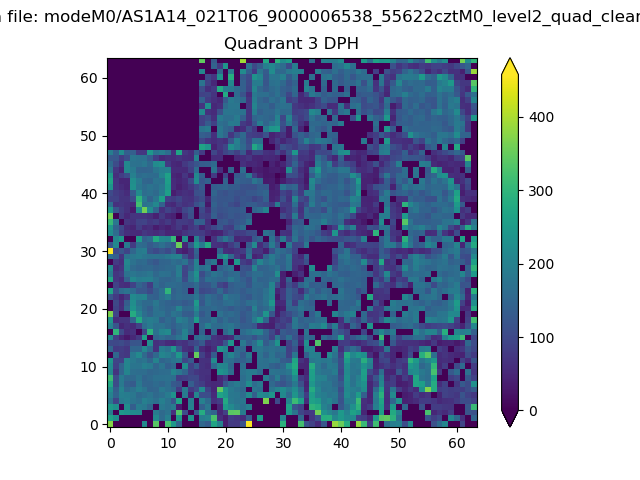 |
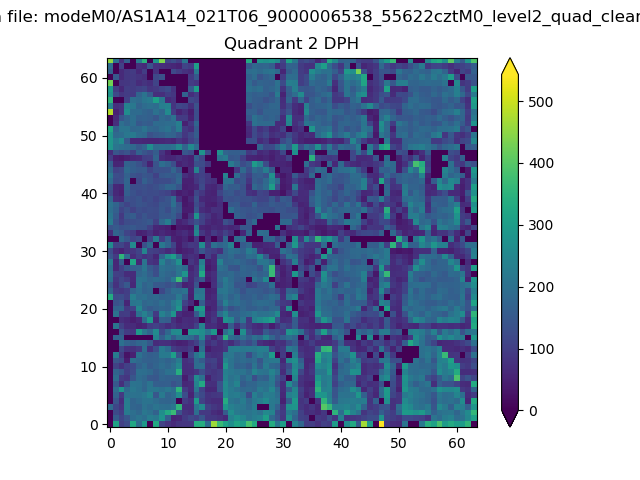 |
Quadrant C |
| Plot type | Count rate plots | Images |
|---|---|---|
| Comparison with Poisson distribution Blue bars denote a histogram of data divided into 1 sec bins. Red curve is a Poisson curve with rate = median count rate of data. |
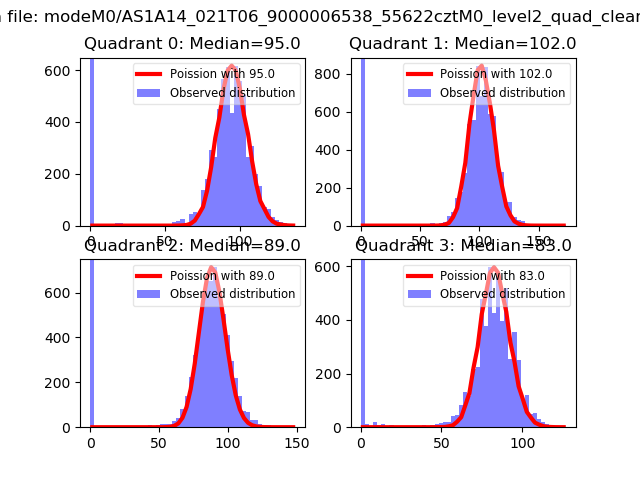 |
 |
| Quadrant-wise count rates Data is divided into 100 sec bins |
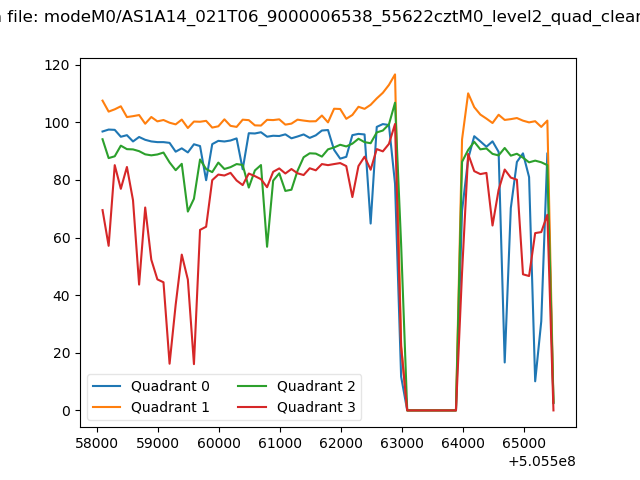 |
|
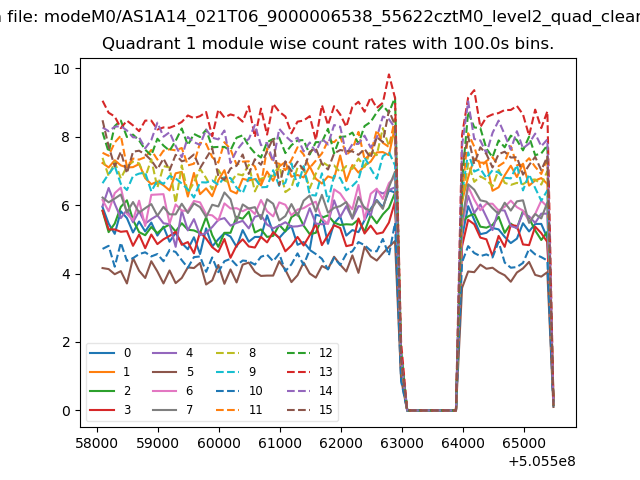
| Module-wise count rates for Quadrant A Data is divided into 100 sec bins |
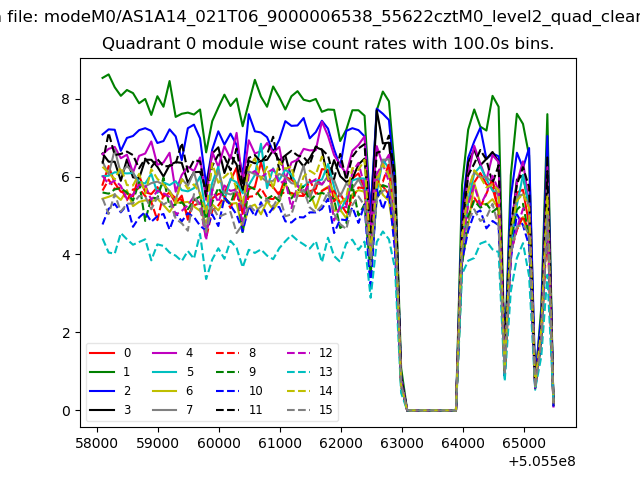 |
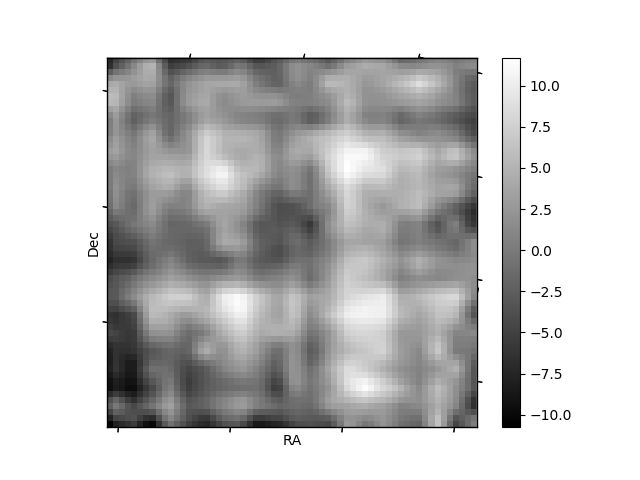 |
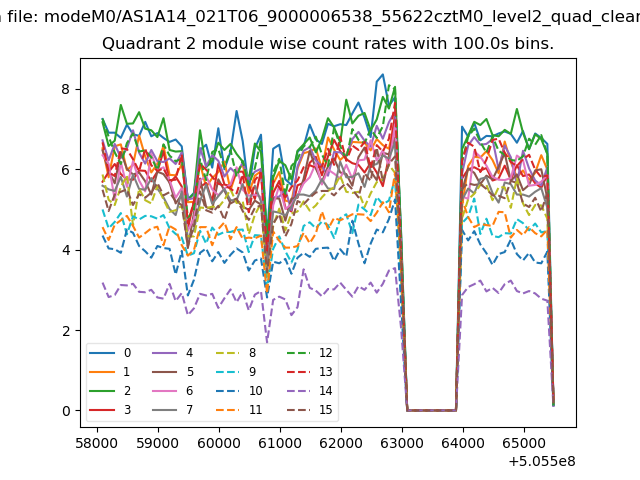
| Module-wise count rates for Quadrant B Data is divided into 100 sec bins |
 |
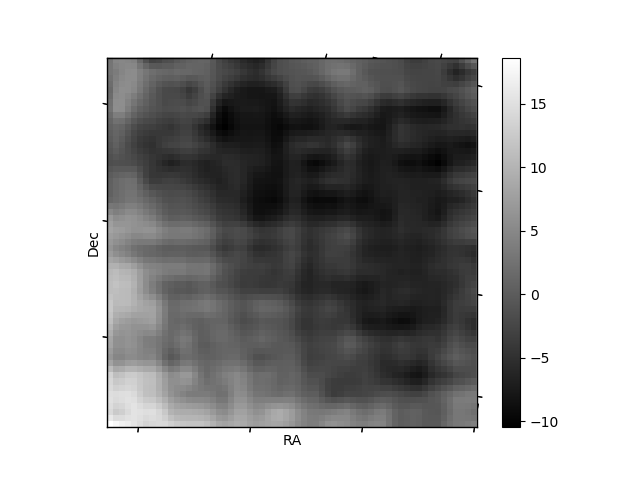 |
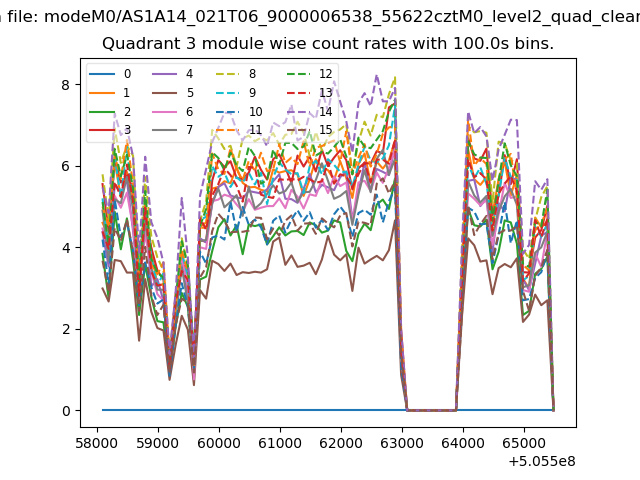
| Module-wise count rates for Quadrant C Data is divided into 100 sec bins |
 |
 |
| Module-wise count rates for Quadrant D Data is divided into 100 sec bins |
 |
 |
| Parameter | Plot |
|---|---|
| CZT HV Monitor | 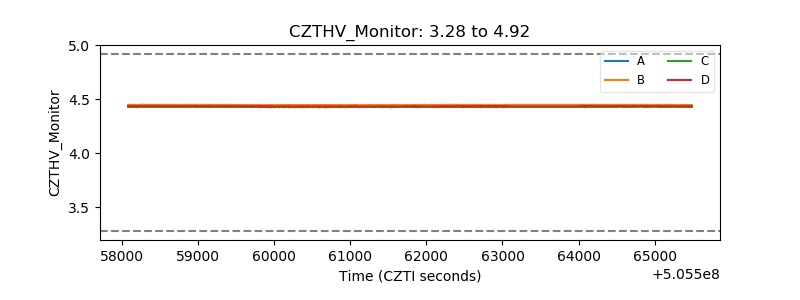 |
| D_VDD | 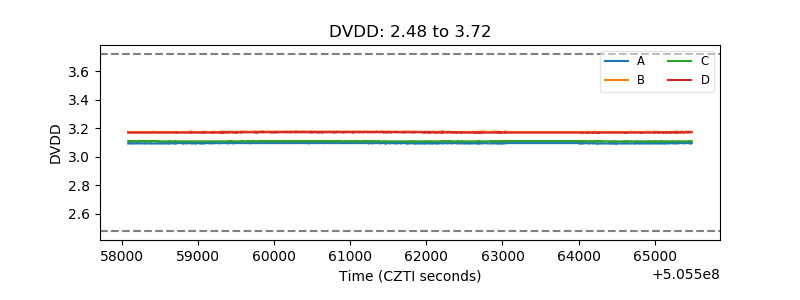 |
| Temperature 1 | 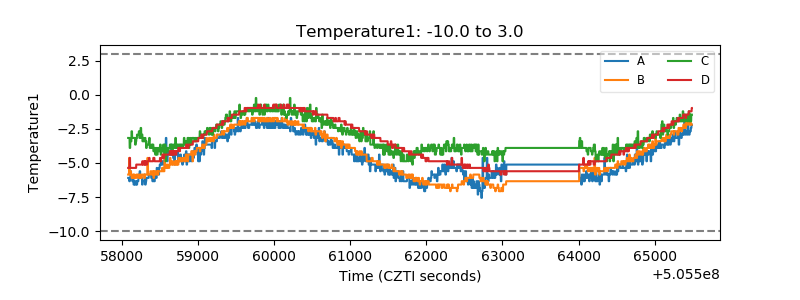 |
| Veto HV Monitor | 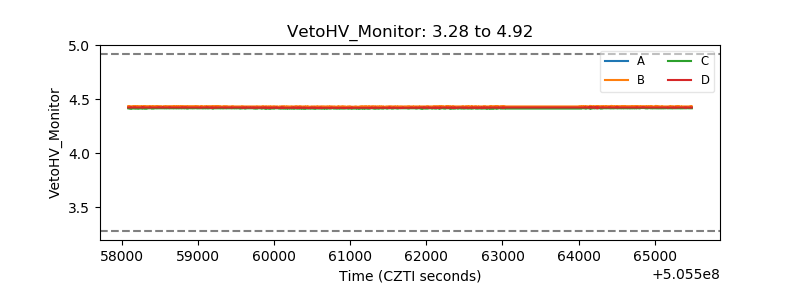 |
| Veto LLD | 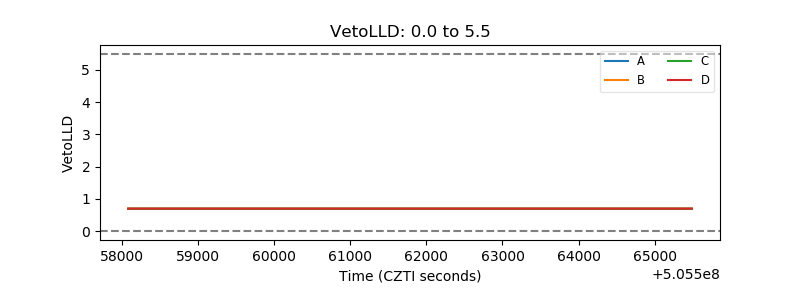 |
| Alpha Counter | 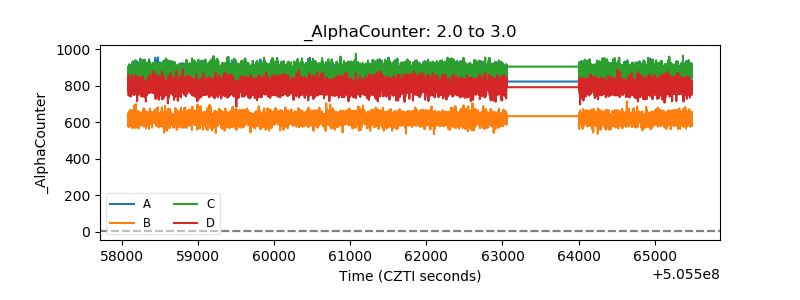 |
| _CPM_Rate | 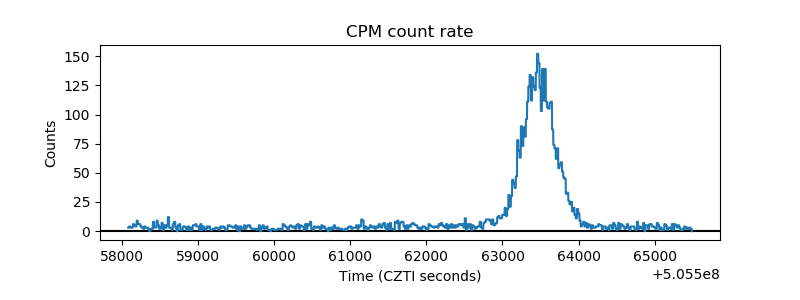 |
| CZT Counter | 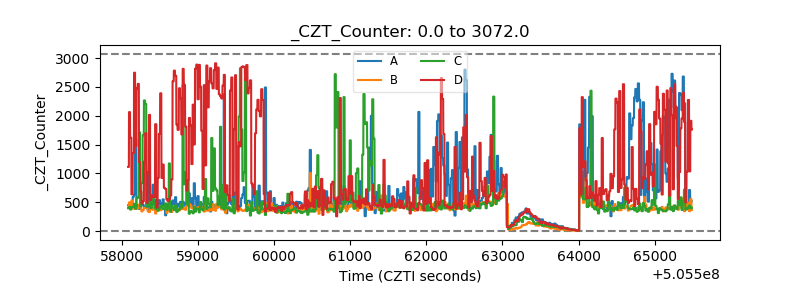 |
| +2.5 Volts monitor | 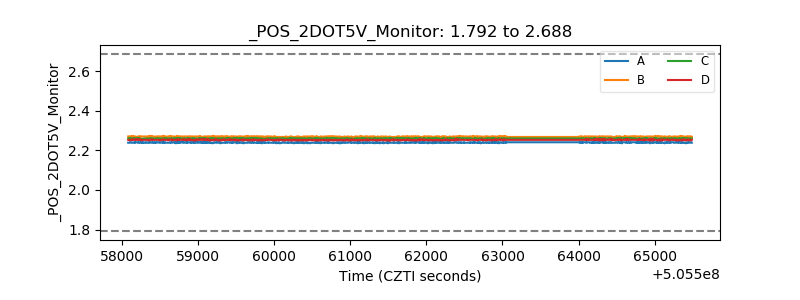 |
| +5 Volts monitor | 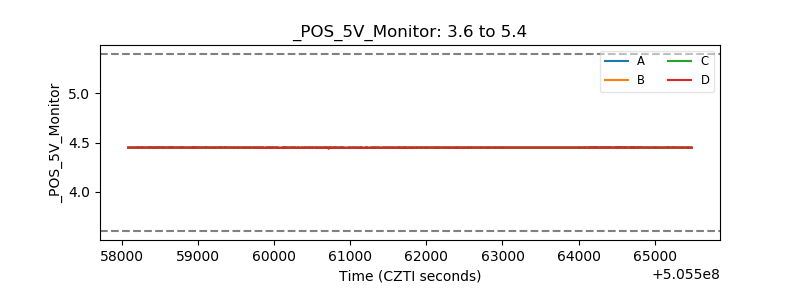 |
| _ROLL_ROT | 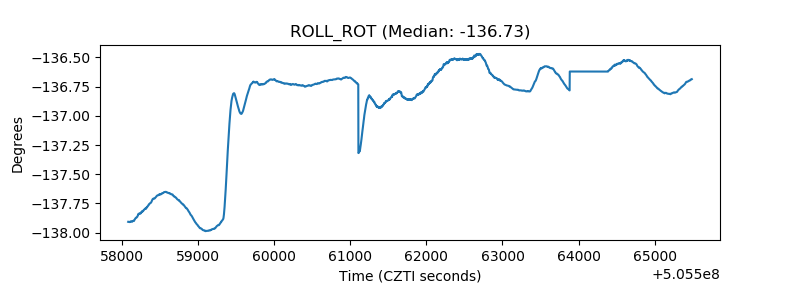 |
| _Roll_DEC | 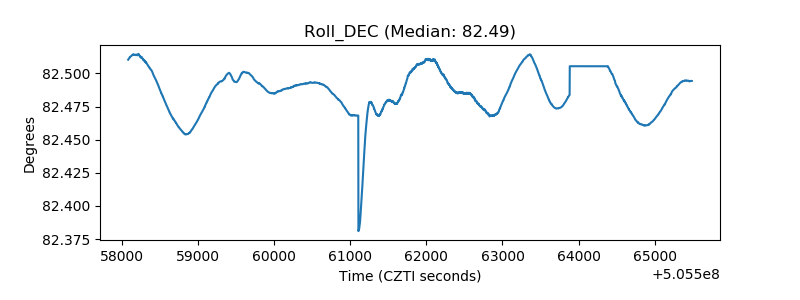 |
| _Roll_RA | 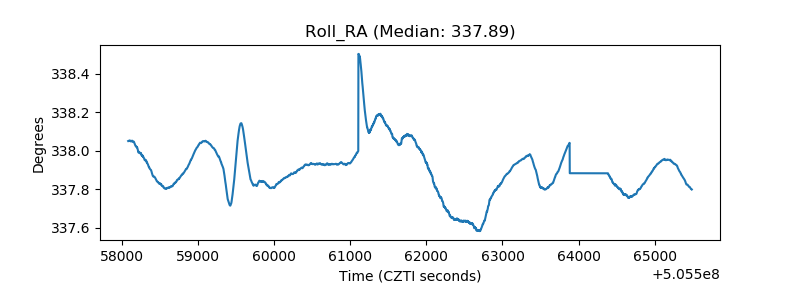 |
| Veto Counter | 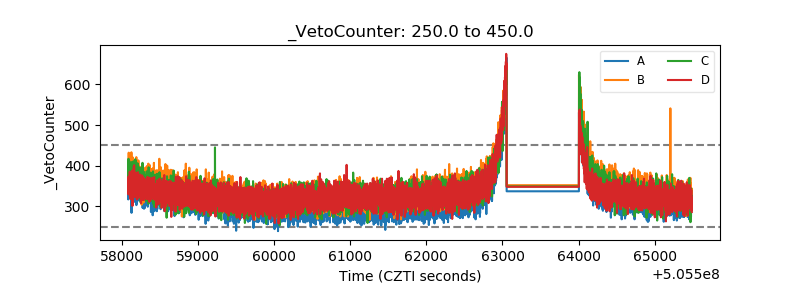 |