| Param | Original file | Final file |
|---|---|---|
| Filename | modeM0/AS1A14_021T06_9000006538_55624cztM0_level2.fits | modeM0/AS1A14_021T06_9000006538_55624cztM0_level2_quad_clean.evt |
| Size (bytes) | 585,792,000 | 92,897,280 |
| Size | 558.7 MB | 88.6 MB |
| Events in quadrant A | 8,261,890 | 518,435 |
| Events in quadrant B | 3,205,625 | 687,882 |
| Events in quadrant C | 3,442,224 | 599,693 |
| Events in quadrant D | 6,240,227 | 527,235 |
| Mode M0 | |||
|---|---|---|---|
| Quadrant | BADHDUFLAG | Total packets | Discarded packets |
| A | 0 | 29295 | 1 |
| B | 0 | 14795 | 1 |
| C | 0 | 15760 | 1 |
| D | 0 | 23303 | 1 |
| Mode SS | |||
|---|---|---|---|
| Quadrant | BADHDUFLAG | Total packets | Discarded packets |
| A | 0 | 138 | 0 |
| B | 0 | 138 | 0 |
| C | 0 | 138 | 0 |
| D | 0 | 138 | 0 |
| Quadrant | Total seconds | Saturated seconds | Saturation percentage |
|---|---|---|---|
| A | 6880 | 1610 | 23.401163% |
| B | 6880 | 147 | 2.136628% |
| C | 6880 | 155 | 2.252907% |
| D | 6880 | 716 | 10.406977% |
Noise dominated data is calculated using 1-second bins in cleaned event files. If a bin has >2000 counts, and if more than 50% of those come from <1% of pixels, then it is considered to be noise-dominated and hence unusable.
| Quadrant | # 1 sec bins | Bins with >0 counts | Bins with >2000 counts | High rate bins dominated by noise | Noise dominated (total time) | Noise dominated (detector-on time) | Marked lightcurve |
|---|---|---|---|---|---|---|---|
| A | 6910 | 6881 | 1467 | 1467 | 21.23% | 21.32% | 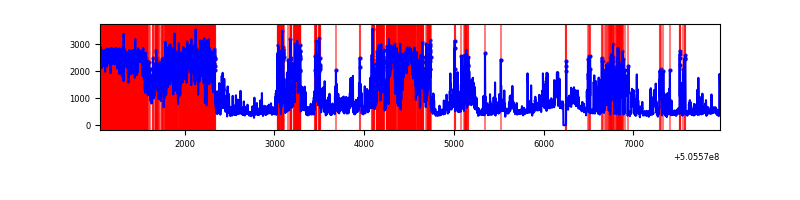 |
| B | 6910 | 6881 | 36 | 36 | 0.52% | 0.52% | 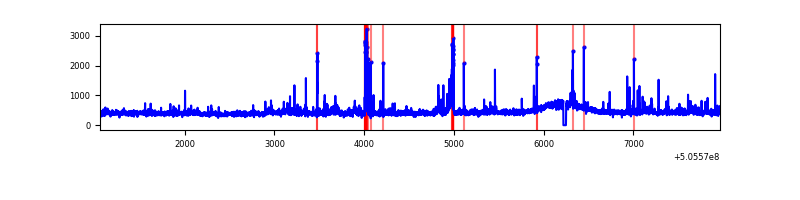 |
| C | 6910 | 6881 | 97 | 97 | 1.40% | 1.41% | 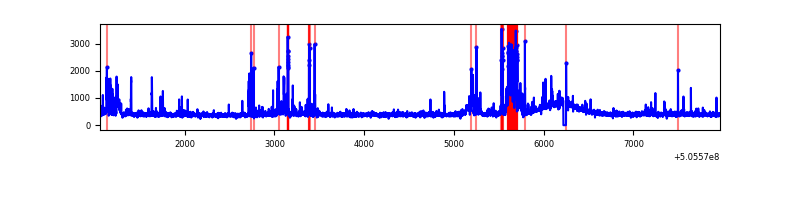 |
| D | 6910 | 6881 | 570 | 570 | 8.25% | 8.28% | 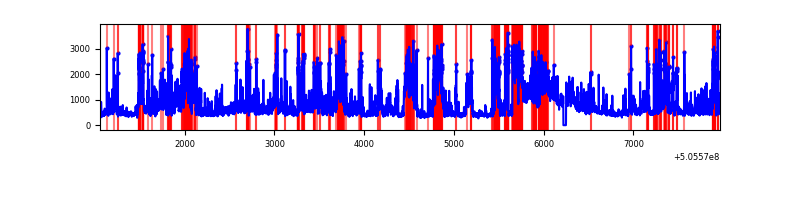 |
Top three noisy pixels from each quadrant. If the there are fewer than three noisy pixels in the level2.evt file, extra rows are filled as -1
| Pixel properties | Quadrant properties | ||||||
|---|---|---|---|---|---|---|---|
| Quadrant | DetID | PixID | Counts | Sigma | Mean | Median | Sigma |
| A | 12 | 115 | 3784497 | 22726.18 | 673 | 656 | 166.5 |
| A | 8 | 249 | 815184 | 4892.15 | 673 | 656 | 166.5 |
| A | 15 | 32 | 658323 | 3950.02 | 673 | 656 | 166.5 |
| B | 5 | 185 | 139901 | 909.23 | 716 | 689 | 153.1 |
| B | 4 | 67 | 68879 | 445.37 | 716 | 689 | 153.1 |
| B | 0 | 199 | 41145 | 264.23 | 716 | 689 | 153.1 |
| C | 12 | 2 | 371350 | 1927.94 | 707 | 699 | 192.3 |
| C | 10 | 19 | 78774 | 406.11 | 707 | 699 | 192.3 |
| C | 6 | 223 | 50119 | 257.06 | 707 | 699 | 192.3 |
| D | 11 | 129 | 1684366 | 8655.49 | 693 | 661 | 194.5 |
| D | 8 | 245 | 1367933 | 7028.79 | 693 | 661 | 194.5 |
| D | 2 | 62 | 134483 | 687.94 | 693 | 661 | 194.5 |
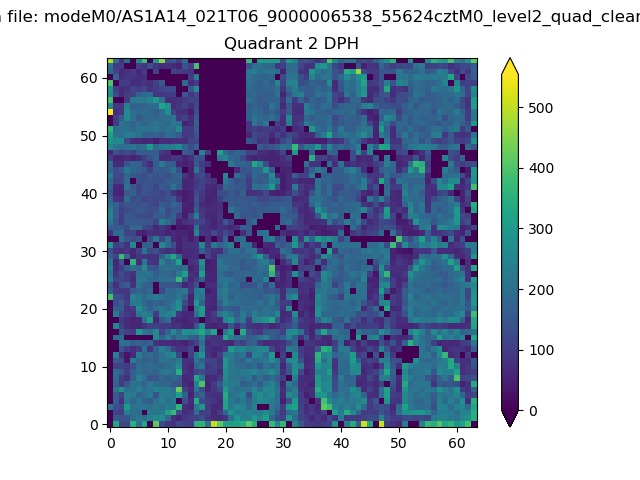
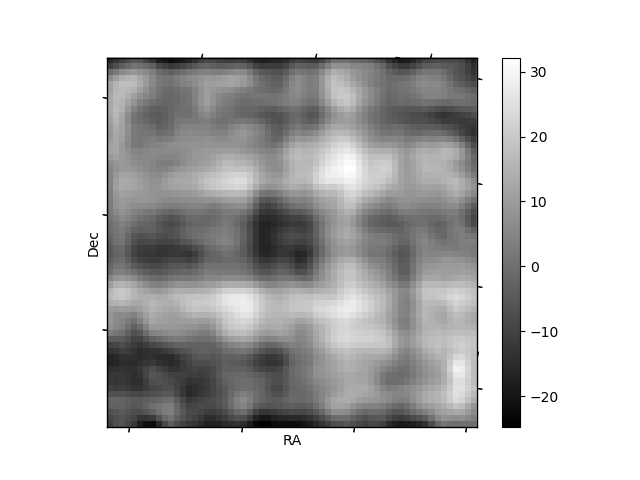
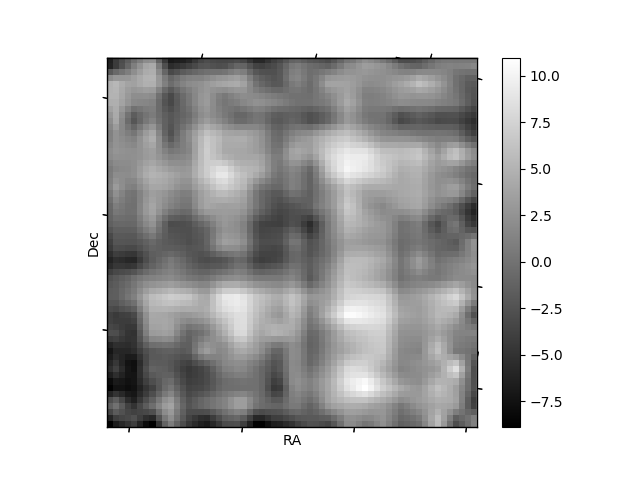
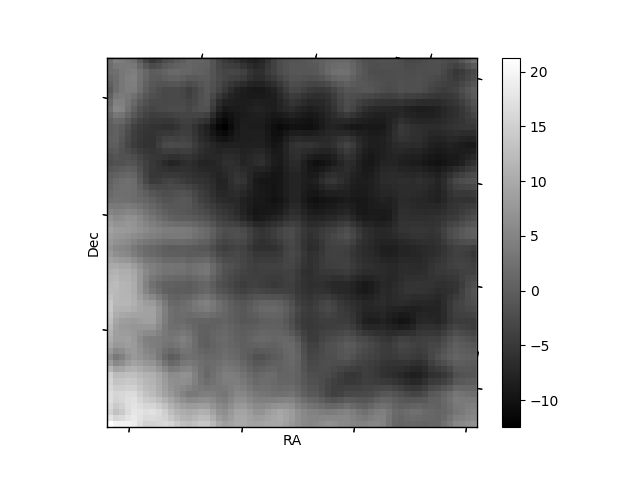
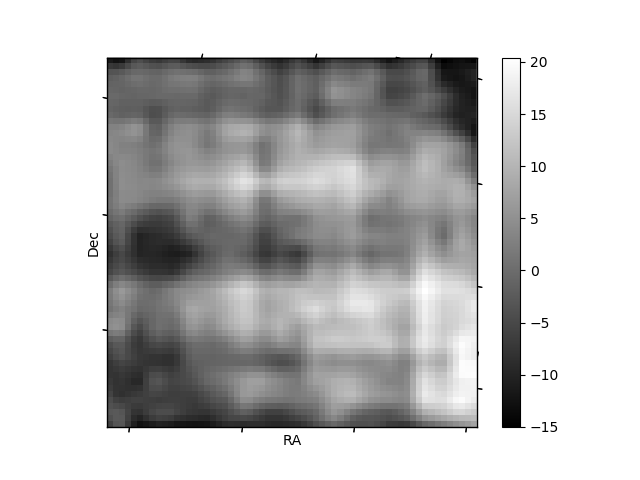
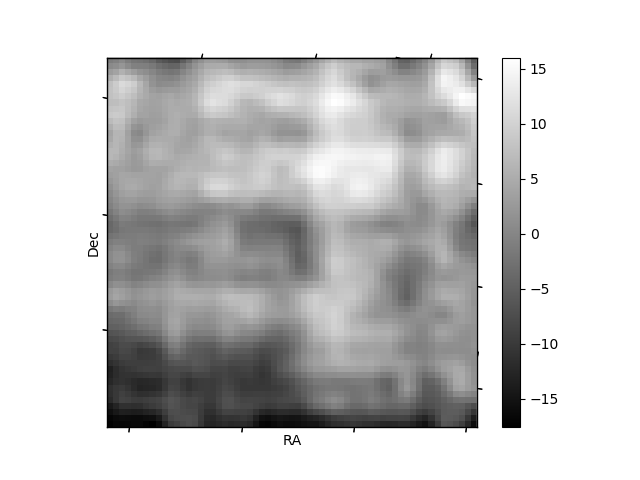
Histogram calculated using DETX and DETY for each event in the final _common_clean file
| Quadrant A | 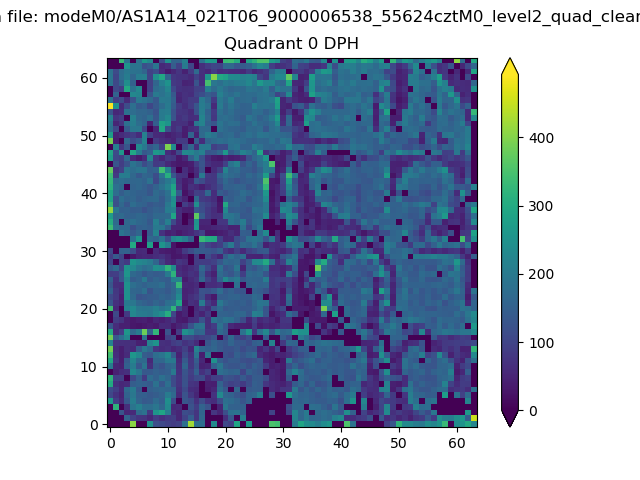 |
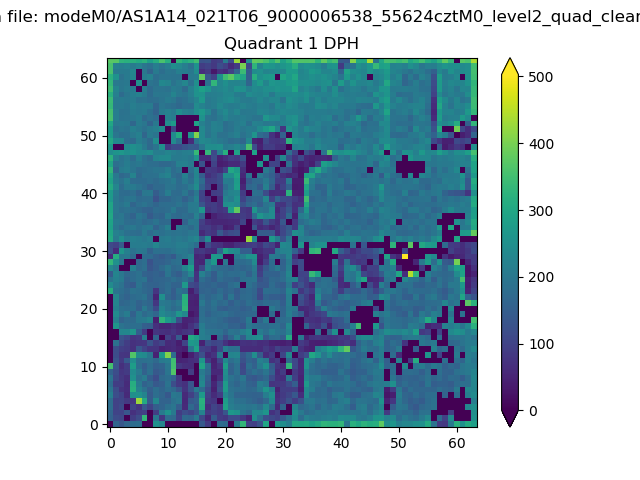 |
Quadrant B |
|---|---|---|---|
| Quadrant D | 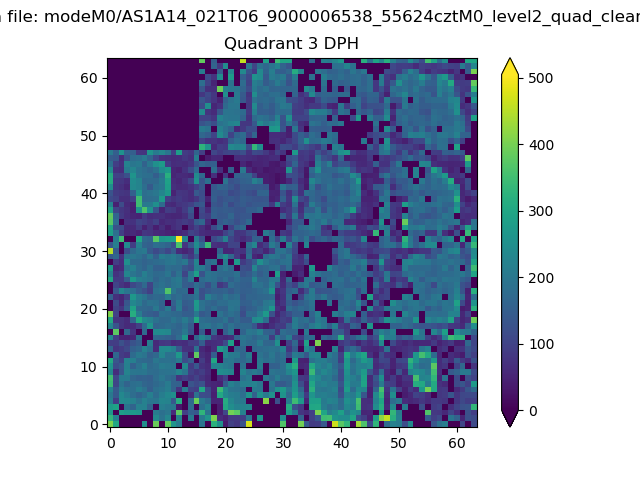 |
 |
Quadrant C |
| Plot type | Count rate plots | Images |
|---|---|---|
| Comparison with Poisson distribution Blue bars denote a histogram of data divided into 1 sec bins. Red curve is a Poisson curve with rate = median count rate of data. |
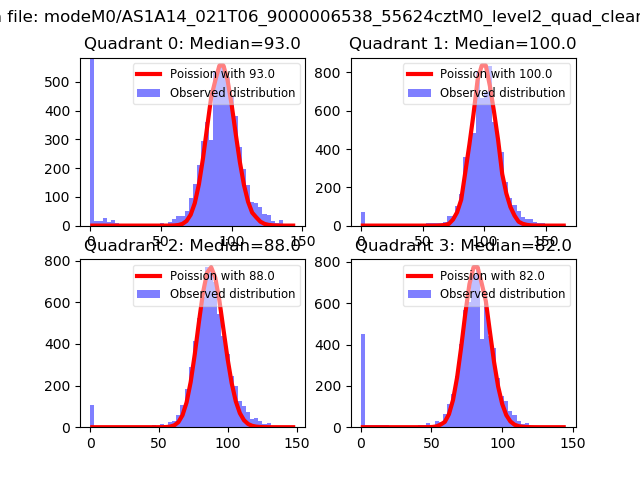 |
 |
| Quadrant-wise count rates Data is divided into 100 sec bins |
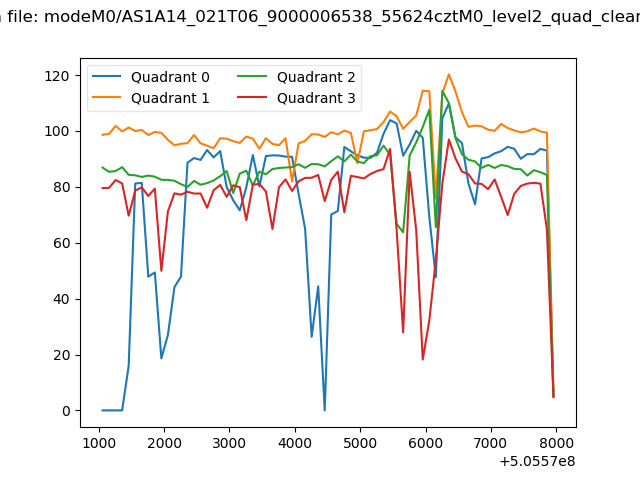 |
|
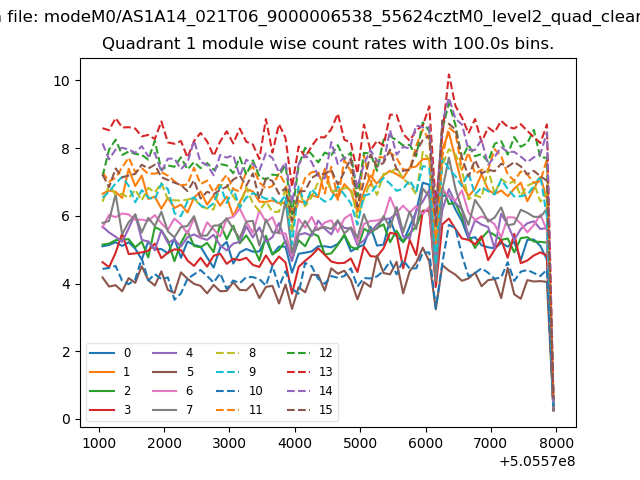
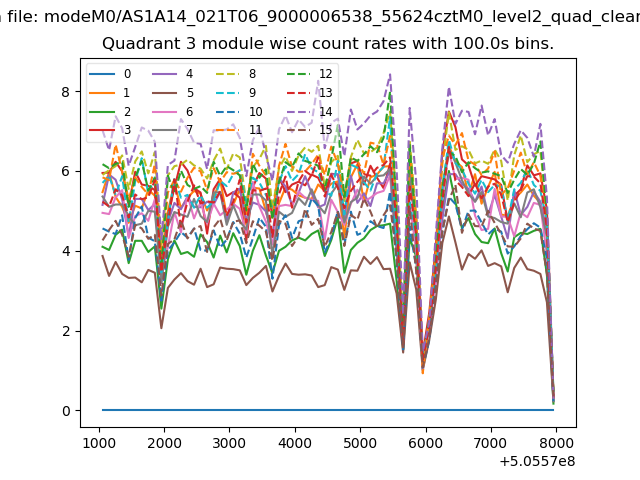
| Module-wise count rates for Quadrant A Data is divided into 100 sec bins |
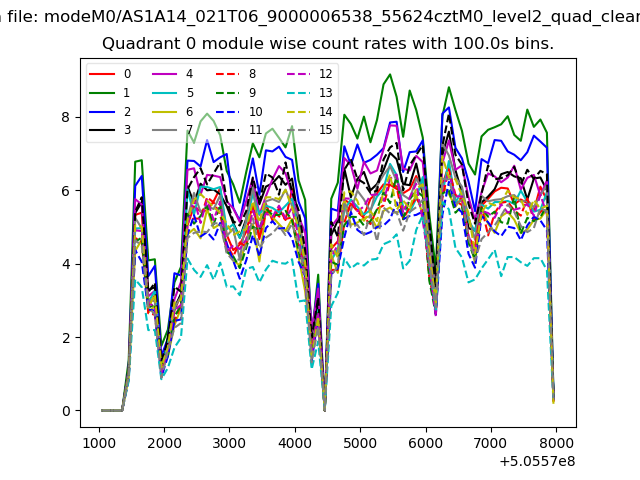 |
 |
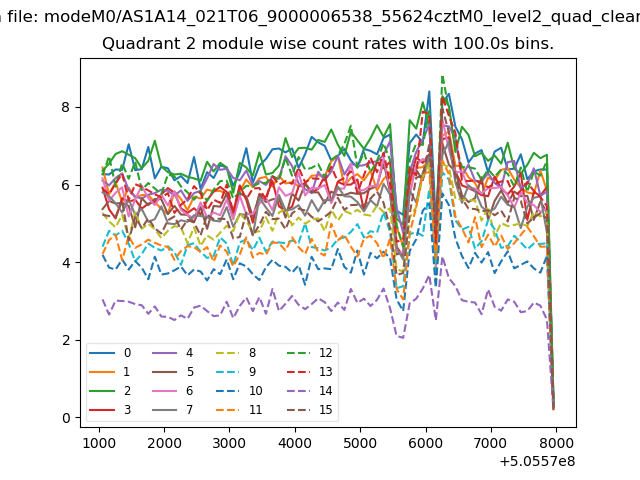
| Module-wise count rates for Quadrant B Data is divided into 100 sec bins |
 |
 |
| Module-wise count rates for Quadrant C Data is divided into 100 sec bins |
 |
 |
| Module-wise count rates for Quadrant D Data is divided into 100 sec bins |
 |
 |
| Parameter | Plot |
|---|---|
| CZT HV Monitor |  |
| D_VDD | 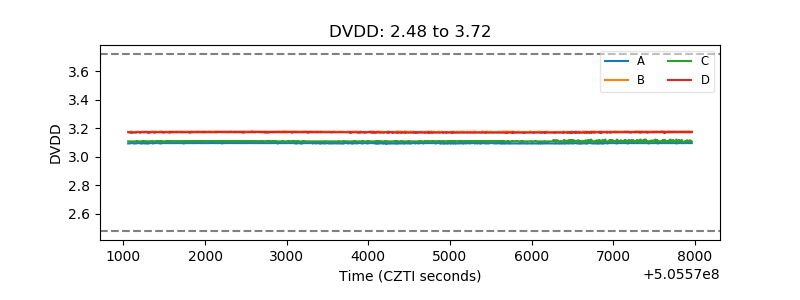 |
| Temperature 1 | 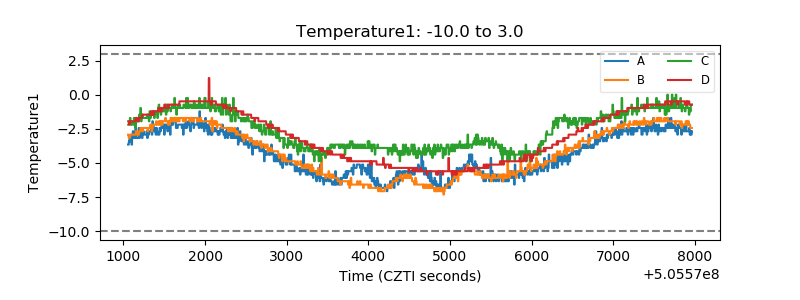 |
| Veto HV Monitor | 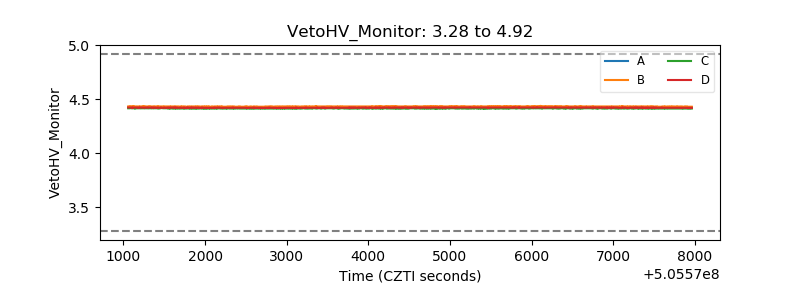 |
| Veto LLD | 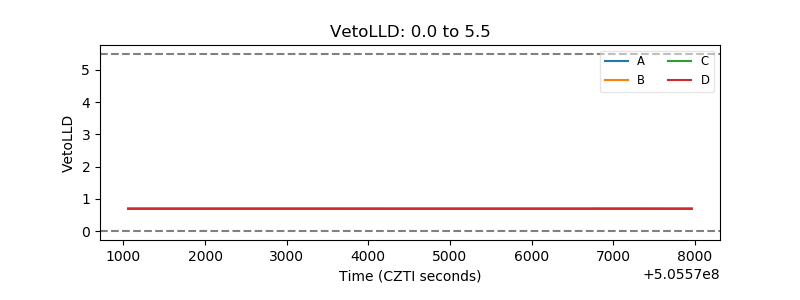 |
| Alpha Counter | 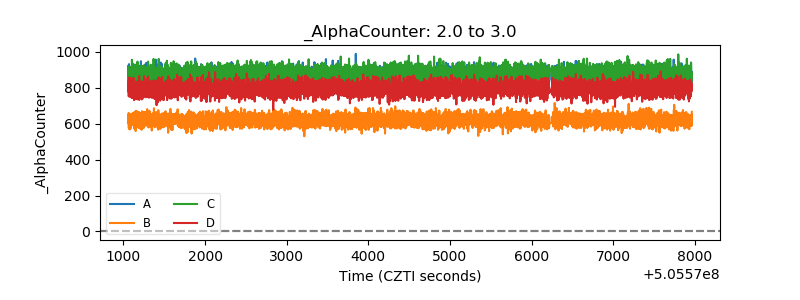 |
| _CPM_Rate | 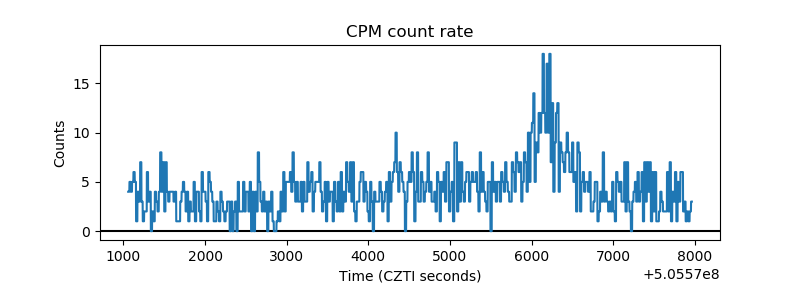 |
| CZT Counter | 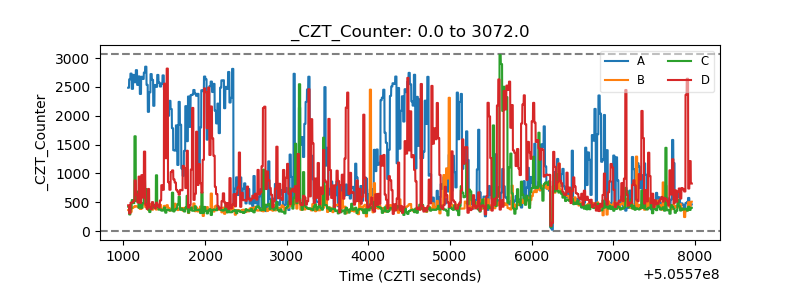 |
| +2.5 Volts monitor | 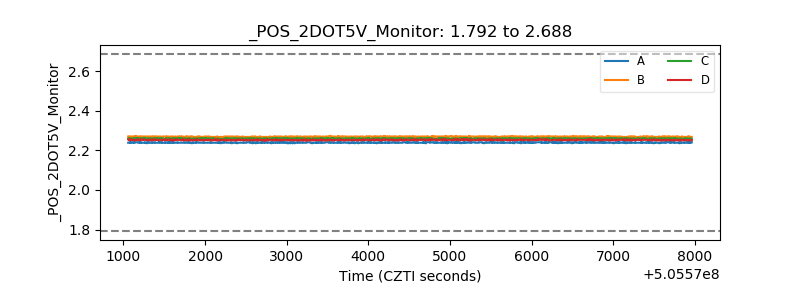 |
| +5 Volts monitor | 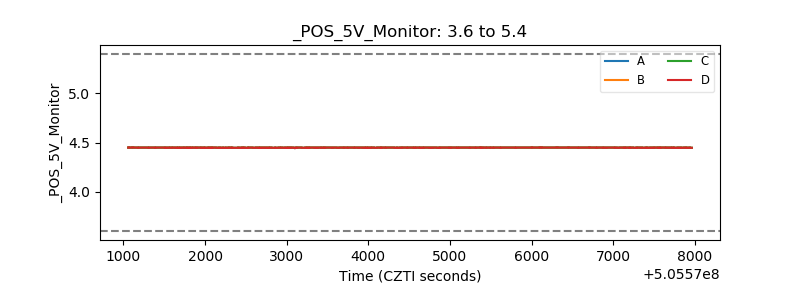 |
| _ROLL_ROT | 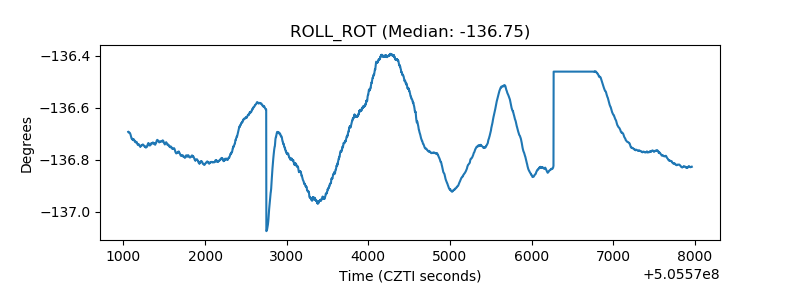 |
| _Roll_DEC | 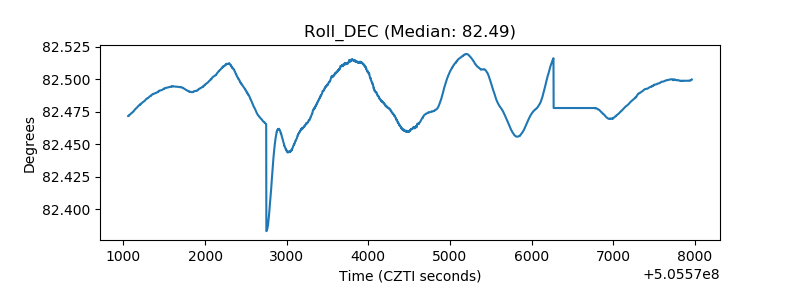 |
| _Roll_RA | 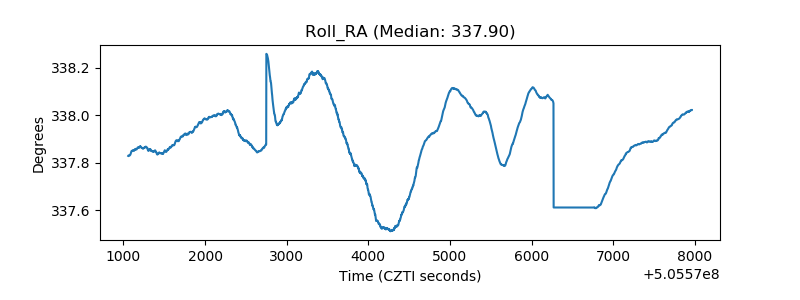 |
| Veto Counter | 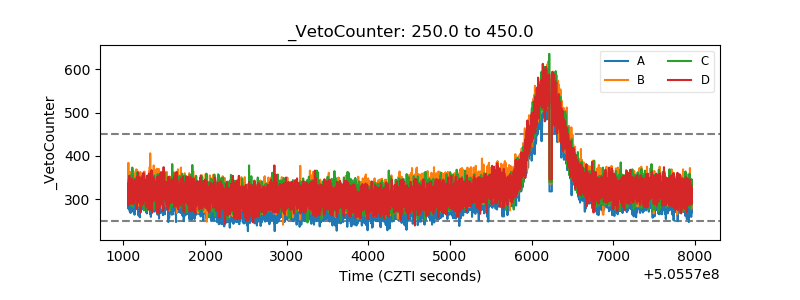 |