| Param | Original file | Final file |
|---|---|---|
| Filename | modeM0/AS1A14_021T06_9000006538_55625cztM0_level2.fits | modeM0/AS1A14_021T06_9000006538_55625cztM0_level2_quad_clean.evt |
| Size (bytes) | 564,382,080 | 105,266,880 |
| Size | 538.2 MB | 100.4 MB |
| Events in quadrant A | 6,204,143 | 678,827 |
| Events in quadrant B | 3,315,243 | 756,860 |
| Events in quadrant C | 5,159,748 | 623,544 |
| Events in quadrant D | 5,623,859 | 600,092 |
| Mode M0 | |||
|---|---|---|---|
| Quadrant | BADHDUFLAG | Total packets | Discarded packets |
| A | 0 | 23899 | 0 |
| B | 0 | 15586 | 0 |
| C | 0 | 20867 | 0 |
| D | 0 | 22055 | 0 |
| Mode SS | |||
|---|---|---|---|
| Quadrant | BADHDUFLAG | Total packets | Discarded packets |
| A | 0 | 152 | 0 |
| B | 0 | 152 | 0 |
| C | 0 | 152 | 0 |
| D | 0 | 152 | 0 |
| Quadrant | Total seconds | Saturated seconds | Saturation percentage |
|---|---|---|---|
| A | 7587 | 439 | 5.786213% |
| B | 7588 | 19 | 0.250395% |
| C | 7588 | 512 | 6.747496% |
| D | 7588 | 447 | 5.890880% |
Noise dominated data is calculated using 1-second bins in cleaned event files. If a bin has >2000 counts, and if more than 50% of those come from <1% of pixels, then it is considered to be noise-dominated and hence unusable.
| Quadrant | # 1 sec bins | Bins with >0 counts | Bins with >2000 counts | High rate bins dominated by noise | Noise dominated (total time) | Noise dominated (detector-on time) | Marked lightcurve |
|---|---|---|---|---|---|---|---|
| A | 7586 | 7586 | 362 | 362 | 4.77% | 4.77% | 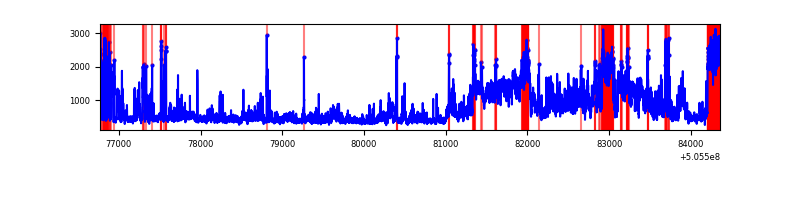 |
| B | 7588 | 7588 | 9 | 9 | 0.12% | 0.12% | 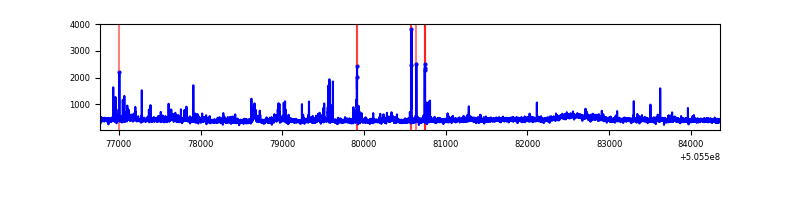 |
| C | 7588 | 7588 | 458 | 458 | 6.04% | 6.04% | 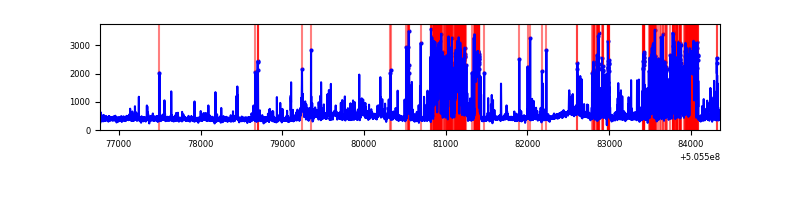 |
| D | 7588 | 7588 | 450 | 450 | 5.93% | 5.93% | 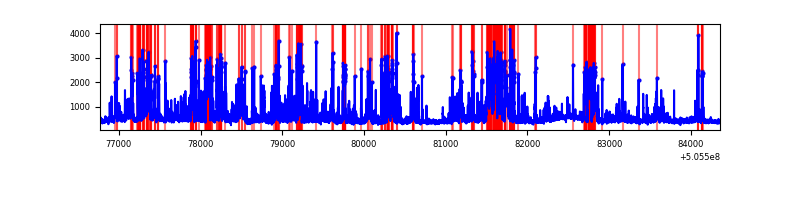 |
Top three noisy pixels from each quadrant. If the there are fewer than three noisy pixels in the level2.evt file, extra rows are filled as -1
| Pixel properties | Quadrant properties | ||||||
|---|---|---|---|---|---|---|---|
| Quadrant | DetID | PixID | Counts | Sigma | Mean | Median | Sigma |
| A | 12 | 115 | 2028963 | 10498.98 | 773 | 752 | 193.2 |
| A | 8 | 249 | 499077 | 2579.57 | 773 | 752 | 193.2 |
| A | 15 | 32 | 299536 | 1546.65 | 773 | 752 | 193.2 |
| B | 5 | 185 | 55811 | 333.99 | 772 | 744 | 164.9 |
| B | 7 | 252 | 40222 | 239.44 | 772 | 744 | 164.9 |
| B | 4 | 169 | 34127 | 202.47 | 772 | 744 | 164.9 |
| C | 15 | 148 | 1403951 | 6981.7 | 735 | 727 | 201.0 |
| C | 13 | 3 | 487031 | 2419.59 | 735 | 727 | 201.0 |
| C | 12 | 2 | 221228 | 1097.1 | 735 | 727 | 201.0 |
| D | 11 | 129 | 1479800 | 7087.94 | 743 | 709 | 208.7 |
| D | 8 | 245 | 773614 | 3703.83 | 743 | 709 | 208.7 |
| D | 0 | 176 | 192102 | 917.17 | 743 | 709 | 208.7 |
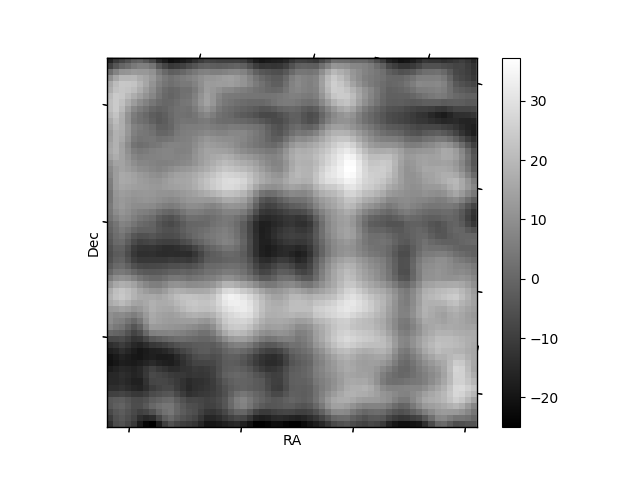
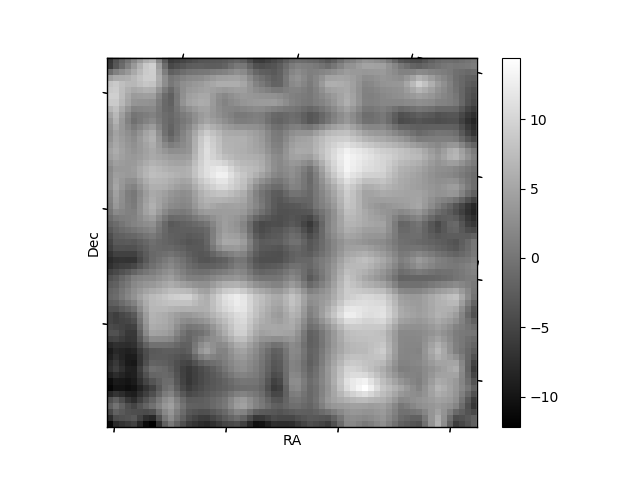
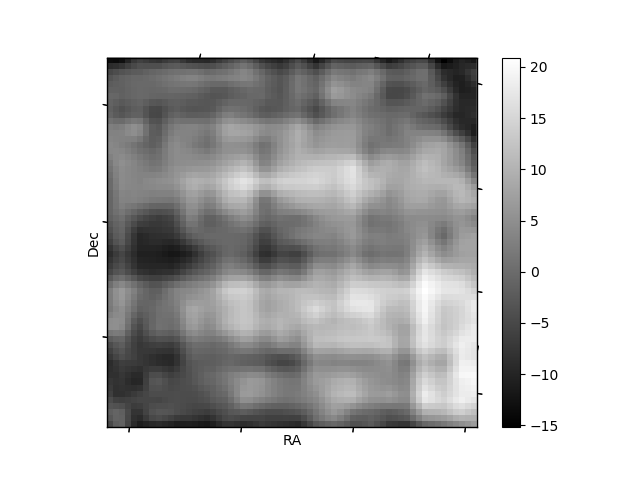
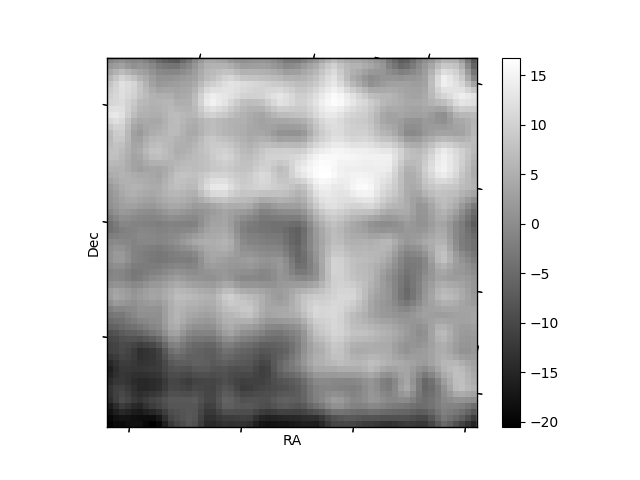
Histogram calculated using DETX and DETY for each event in the final _common_clean file
| Quadrant A | 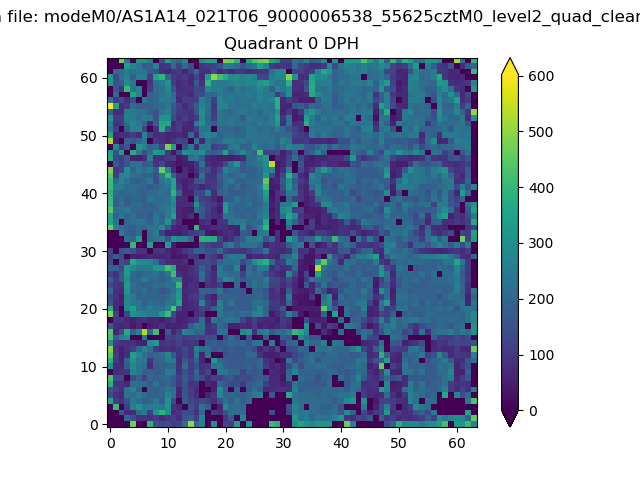 |
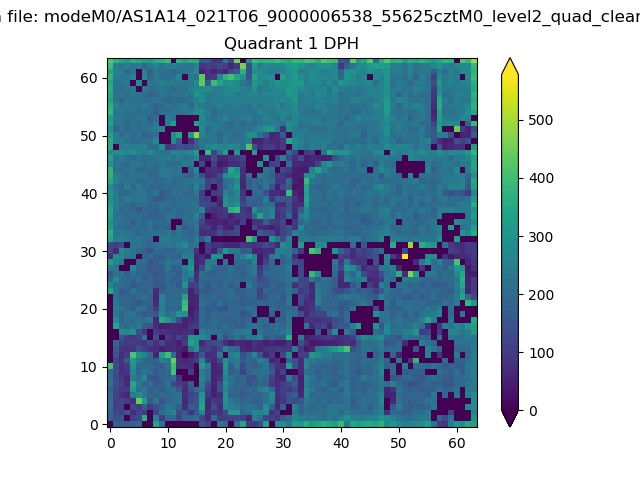 |
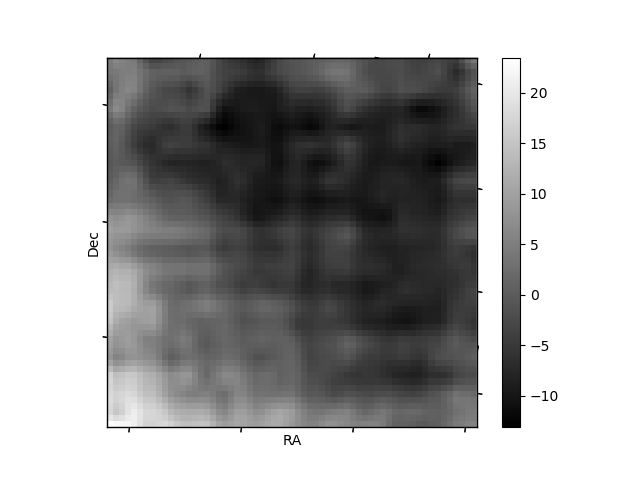
Quadrant B |
|---|---|---|---|
| Quadrant D | 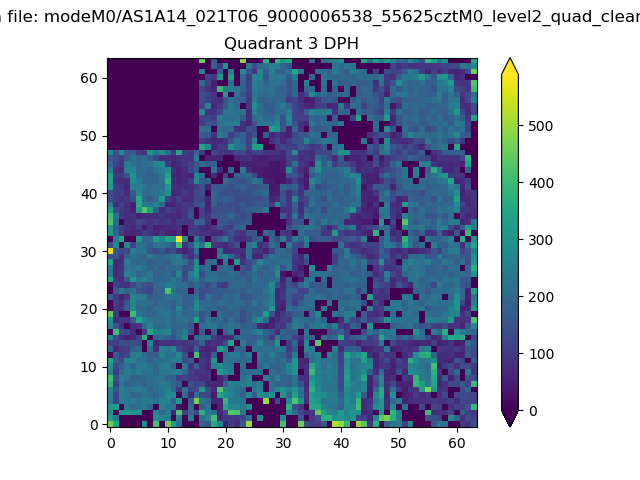 |
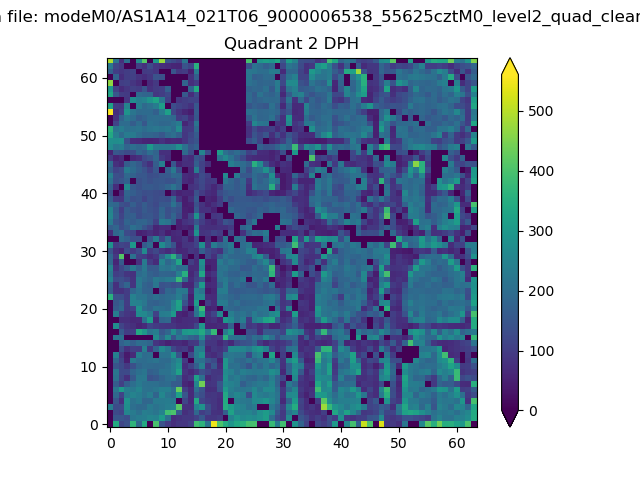 |
Quadrant C |
| Plot type | Count rate plots | Images |
|---|---|---|
| Comparison with Poisson distribution Blue bars denote a histogram of data divided into 1 sec bins. Red curve is a Poisson curve with rate = median count rate of data. |
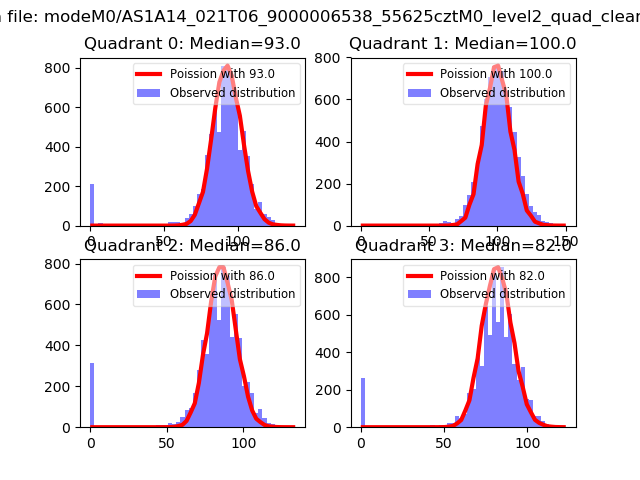 |
 |
| Quadrant-wise count rates Data is divided into 100 sec bins |
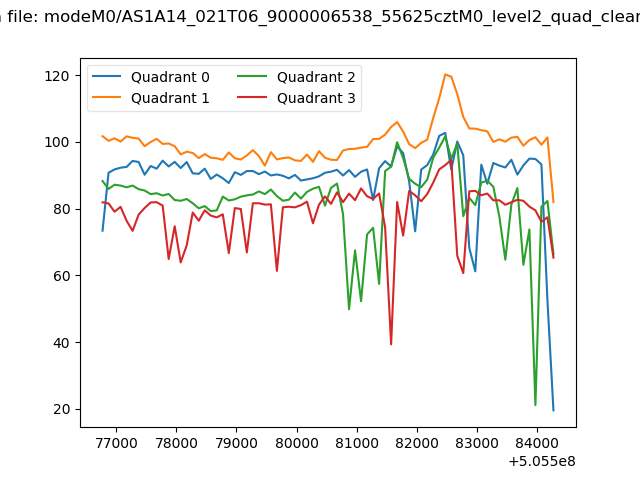 |
|
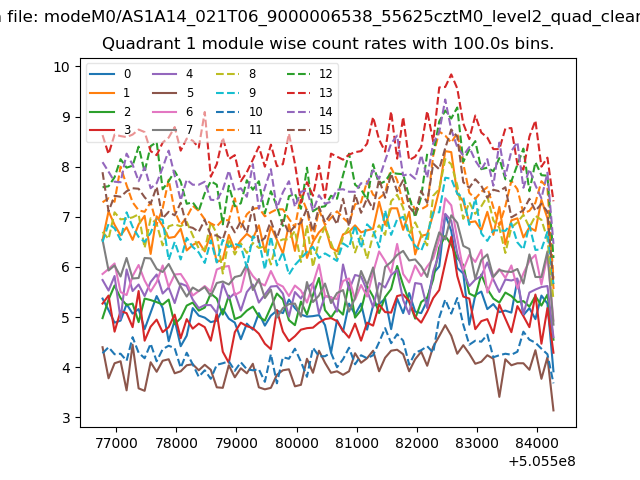
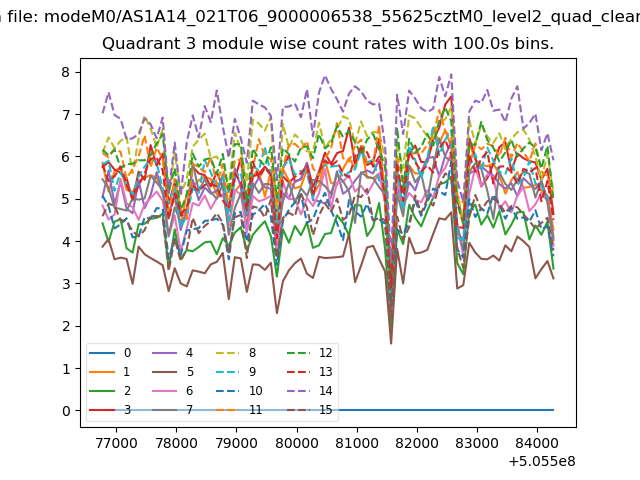
| Module-wise count rates for Quadrant A Data is divided into 100 sec bins |
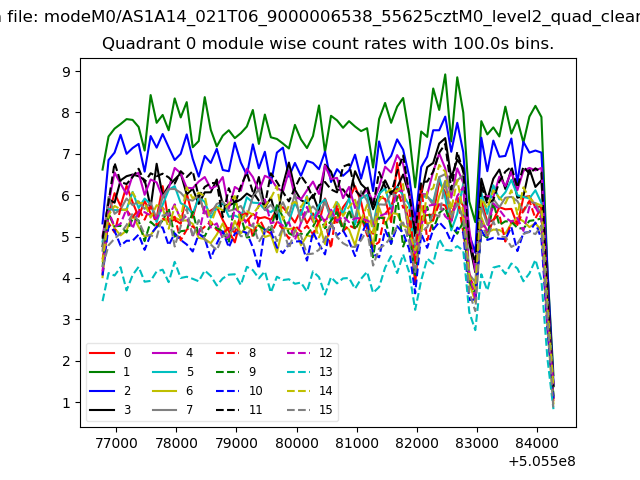 |
 |
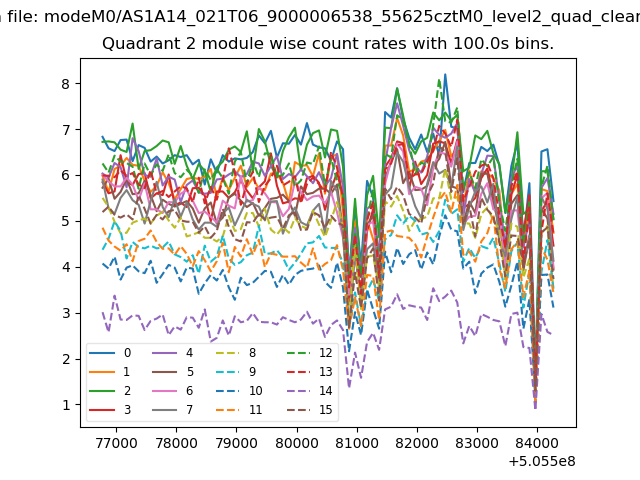
| Module-wise count rates for Quadrant B Data is divided into 100 sec bins |
 |
 |
| Module-wise count rates for Quadrant C Data is divided into 100 sec bins |
 |
 |
| Module-wise count rates for Quadrant D Data is divided into 100 sec bins |
 |
 |
| Parameter | Plot |
|---|---|
| CZT HV Monitor |  |
| D_VDD | 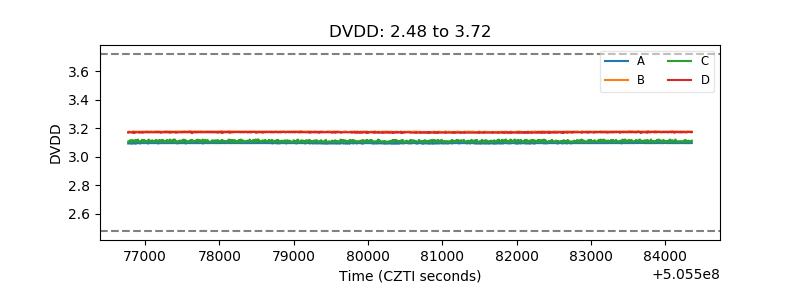 |
| Temperature 1 | 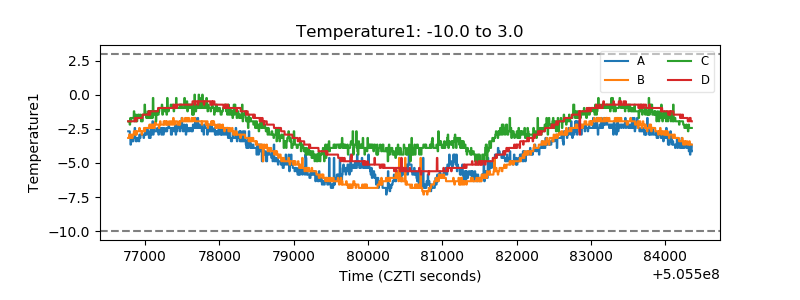 |
| Veto HV Monitor | 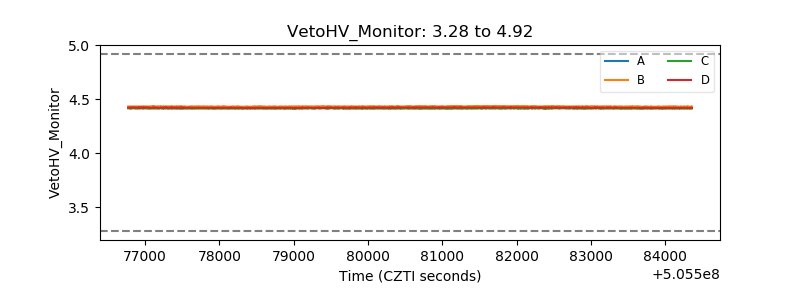 |
| Veto LLD | 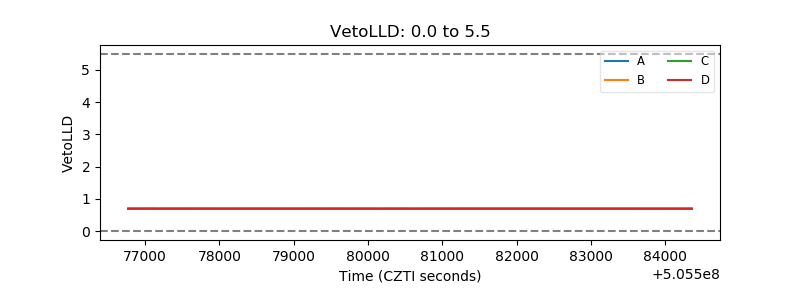 |
| Alpha Counter | 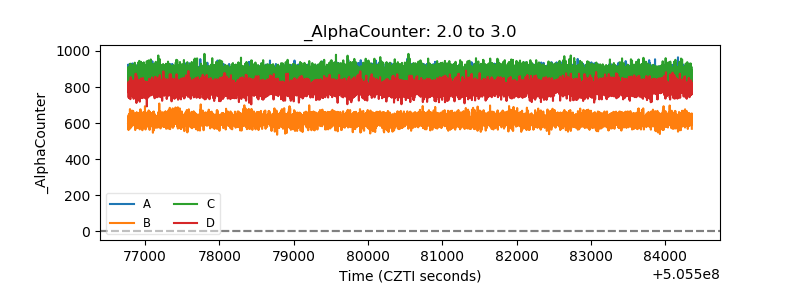 |
| _CPM_Rate | 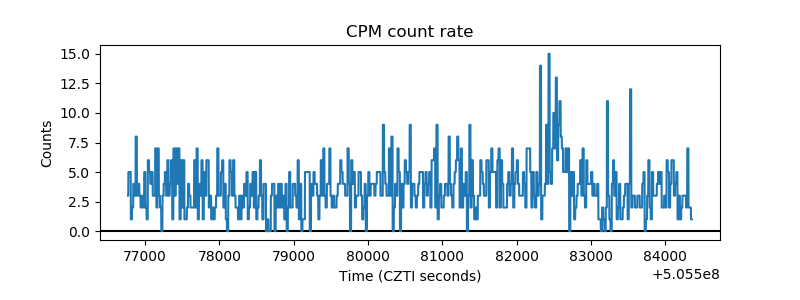 |
| CZT Counter | 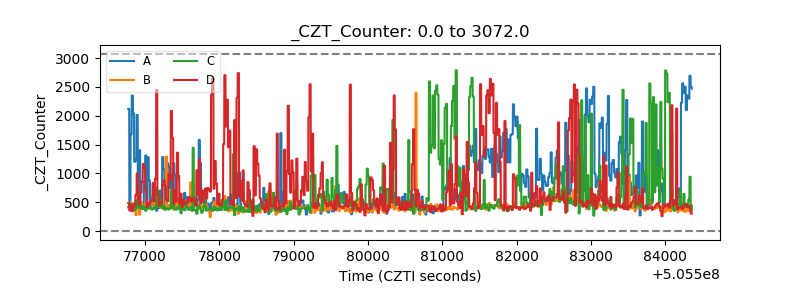 |
| +2.5 Volts monitor | 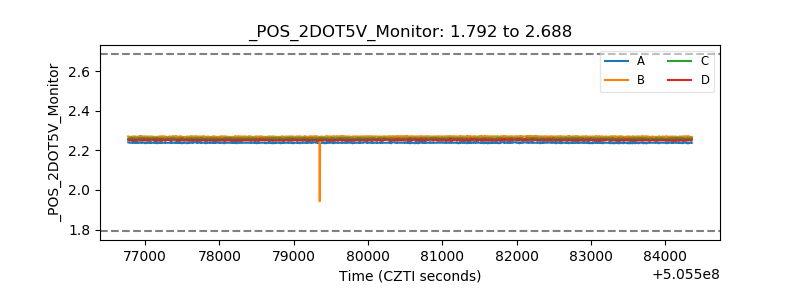 |
| +5 Volts monitor | 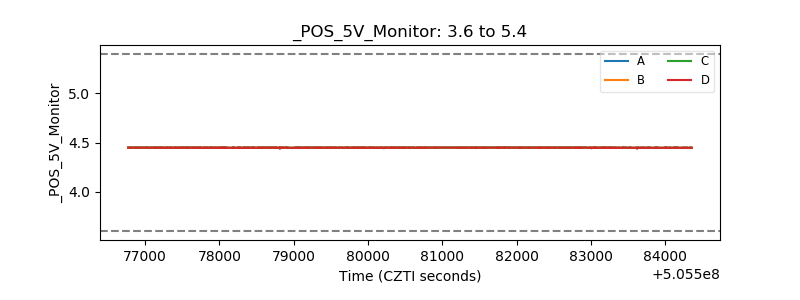 |
| _ROLL_ROT |  |
| _Roll_DEC | 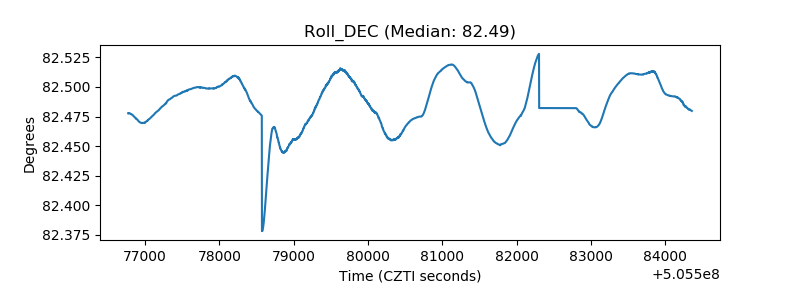 |
| _Roll_RA | 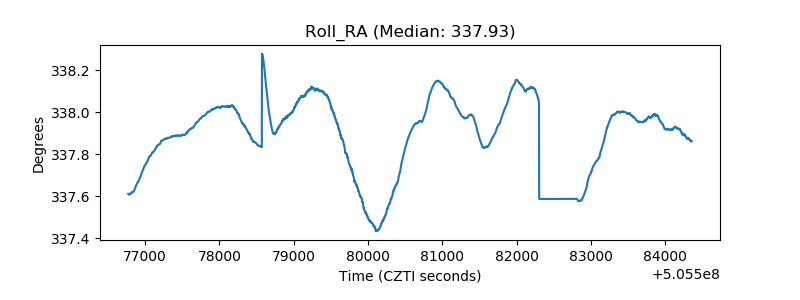 |
| Veto Counter | 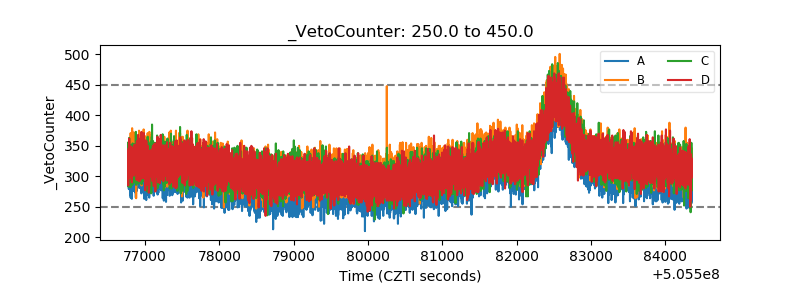 |