| Param | Original file | Final file |
|---|---|---|
| Filename | modeM0/AS1A14_021T06_9000006538_55626cztM0_level2.fits | modeM0/AS1A14_021T06_9000006538_55626cztM0_level2_quad_clean.evt |
| Size (bytes) | 667,581,120 | 106,770,240 |
| Size | 636.7 MB | 101.8 MB |
| Events in quadrant A | 8,073,920 | 670,170 |
| Events in quadrant B | 3,995,595 | 771,437 |
| Events in quadrant C | 6,539,370 | 625,334 |
| Events in quadrant D | 5,502,354 | 626,326 |
| Mode M0 | |||
|---|---|---|---|
| Quadrant | BADHDUFLAG | Total packets | Discarded packets |
| A | 0 | 29204 | 5 |
| B | 0 | 17596 | 0 |
| C | 0 | 25002 | 0 |
| D | 0 | 21832 | 2 |
| Mode SS | |||
|---|---|---|---|
| Quadrant | BADHDUFLAG | Total packets | Discarded packets |
| A | 0 | 154 | 0 |
| B | 0 | 154 | 0 |
| C | 0 | 154 | 0 |
| D | 0 | 154 | 0 |
| Quadrant | Total seconds | Saturated seconds | Saturation percentage |
|---|---|---|---|
| A | 7756 | 772 | 9.953584% |
| B | 7758 | 59 | 0.760505% |
| C | 7758 | 773 | 9.963908% |
| D | 7757 | 347 | 4.473379% |
Noise dominated data is calculated using 1-second bins in cleaned event files. If a bin has >2000 counts, and if more than 50% of those come from <1% of pixels, then it is considered to be noise-dominated and hence unusable.
| Quadrant | # 1 sec bins | Bins with >0 counts | Bins with >2000 counts | High rate bins dominated by noise | Noise dominated (total time) | Noise dominated (detector-on time) | Marked lightcurve |
|---|---|---|---|---|---|---|---|
| A | 7757 | 7757 | 966 | 966 | 12.45% | 12.45% | 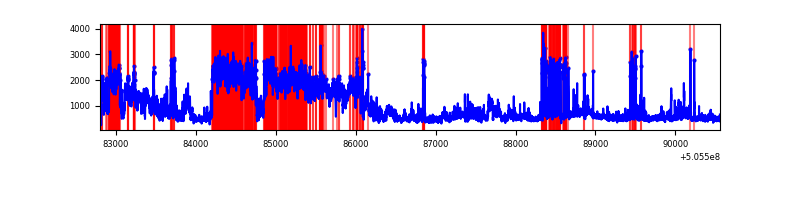 |
| B | 7758 | 7758 | 33 | 33 | 0.43% | 0.43% | 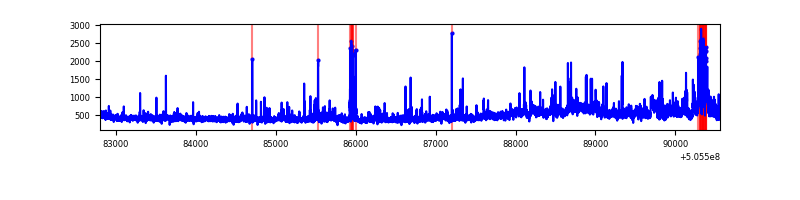 |
| C | 7758 | 7758 | 699 | 699 | 9.01% | 9.01% | 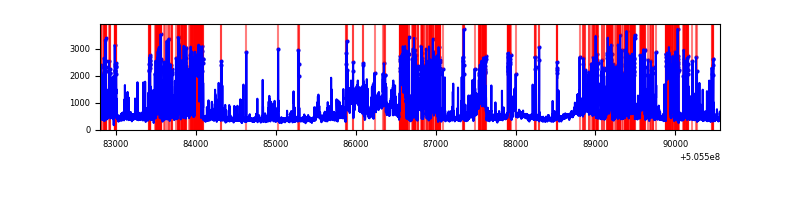 |
| D | 7757 | 7757 | 388 | 388 | 5.00% | 5.00% | 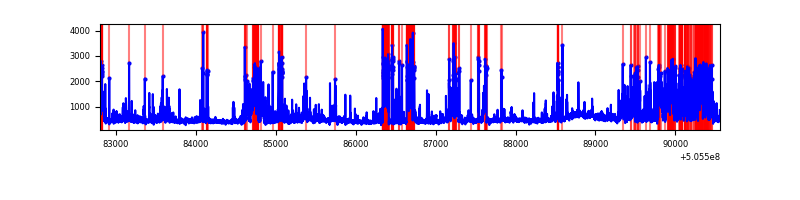 |
Top three noisy pixels from each quadrant. If the there are fewer than three noisy pixels in the level2.evt file, extra rows are filled as -1
| Pixel properties | Quadrant properties | ||||||
|---|---|---|---|---|---|---|---|
| Quadrant | DetID | PixID | Counts | Sigma | Mean | Median | Sigma |
| A | 12 | 115 | 3655360 | 18715.92 | 784 | 763 | 195.3 |
| A | 0 | 8 | 622106 | 3182.02 | 784 | 763 | 195.3 |
| A | 15 | 32 | 216256 | 1103.58 | 784 | 763 | 195.3 |
| B | 7 | 0 | 432474 | 2539.23 | 795 | 764 | 170.0 |
| B | 0 | 173 | 121353 | 709.28 | 795 | 764 | 170.0 |
| B | 10 | 247 | 79027 | 460.33 | 795 | 764 | 170.0 |
| C | 15 | 148 | 2284244 | 11172.14 | 751 | 743 | 204.4 |
| C | 12 | 2 | 826387 | 4039.5 | 751 | 743 | 204.4 |
| C | 13 | 3 | 266794 | 1301.67 | 751 | 743 | 204.4 |
| D | 11 | 129 | 662633 | 3038.58 | 774 | 738 | 217.8 |
| D | 8 | 245 | 654236 | 3000.03 | 774 | 738 | 217.8 |
| D | 6 | 46 | 326287 | 1494.51 | 774 | 738 | 217.8 |
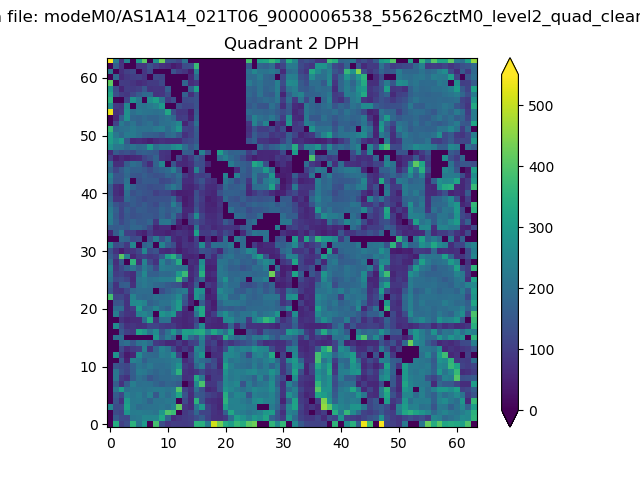
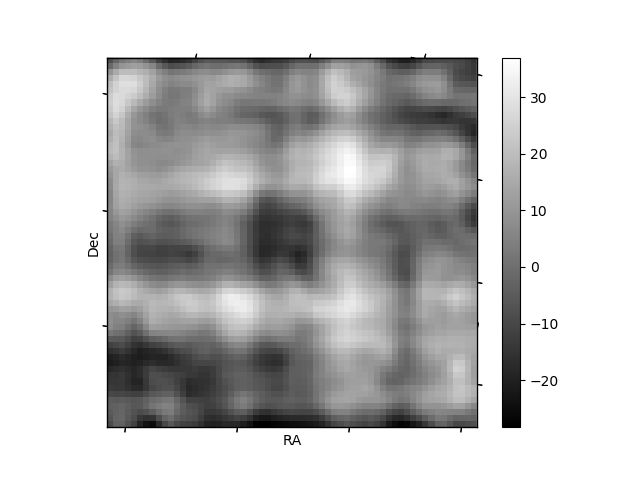
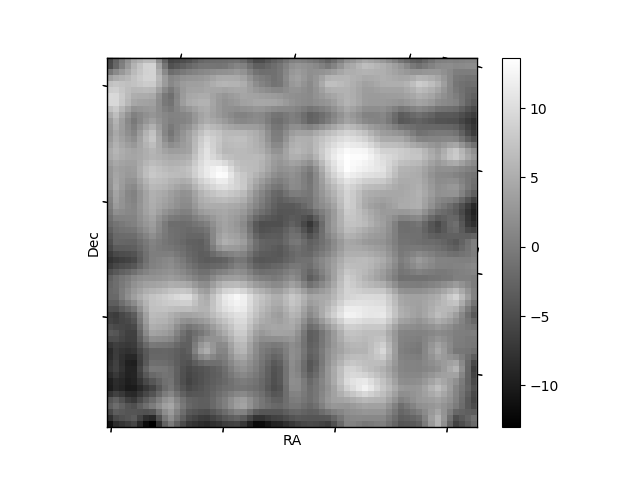
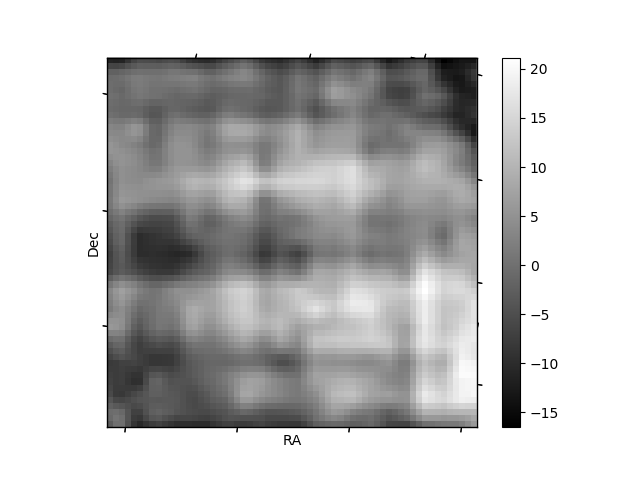
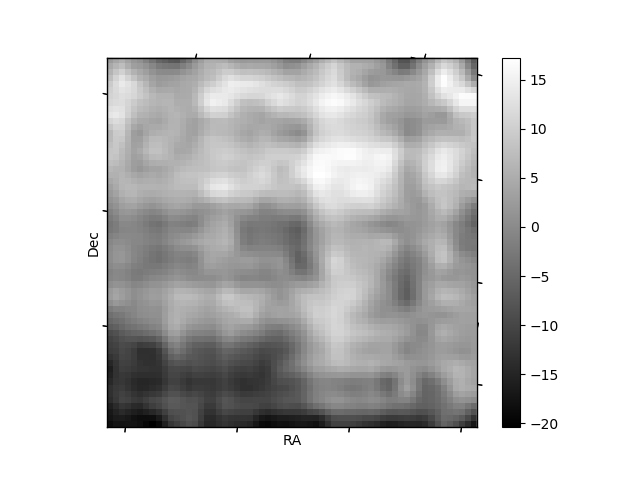
Histogram calculated using DETX and DETY for each event in the final _common_clean file
| Quadrant A | 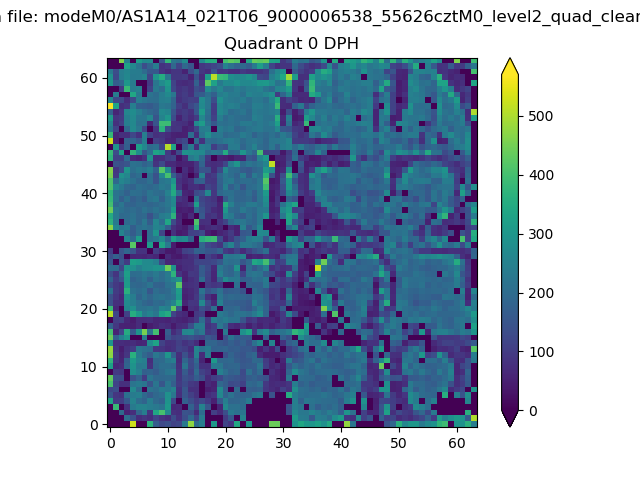 |
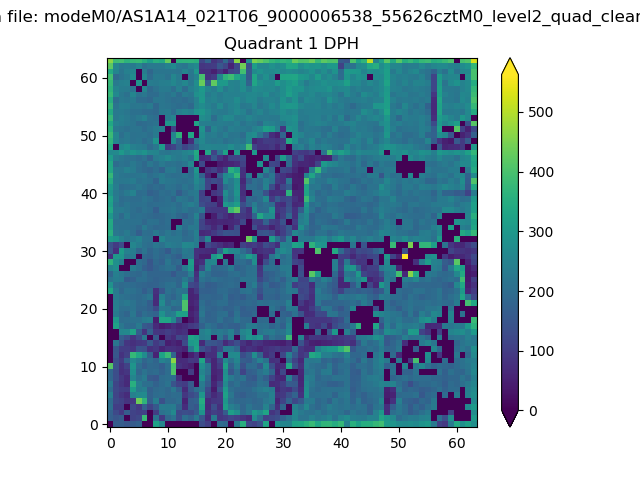 |
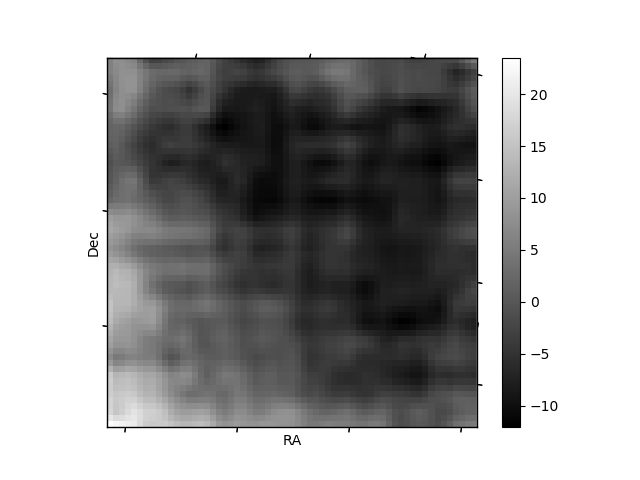
Quadrant B |
|---|---|---|---|
| Quadrant D | 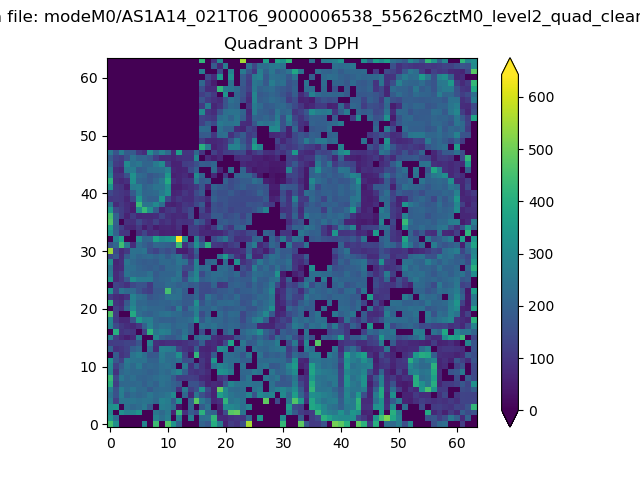 |
 |
Quadrant C |
| Plot type | Count rate plots | Images |
|---|---|---|
| Comparison with Poisson distribution Blue bars denote a histogram of data divided into 1 sec bins. Red curve is a Poisson curve with rate = median count rate of data. |
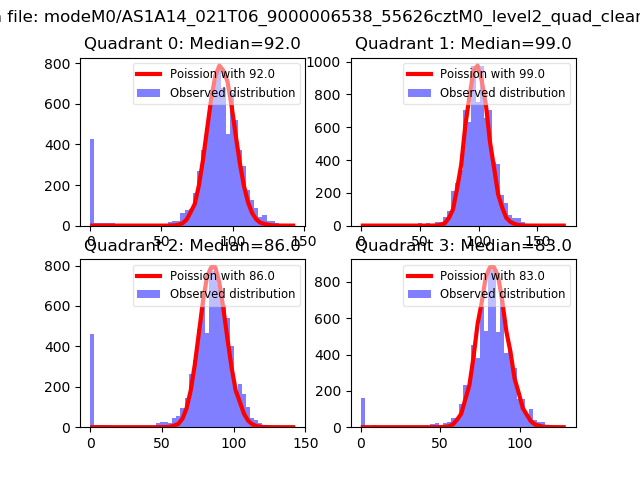 |
 |
| Quadrant-wise count rates Data is divided into 100 sec bins |
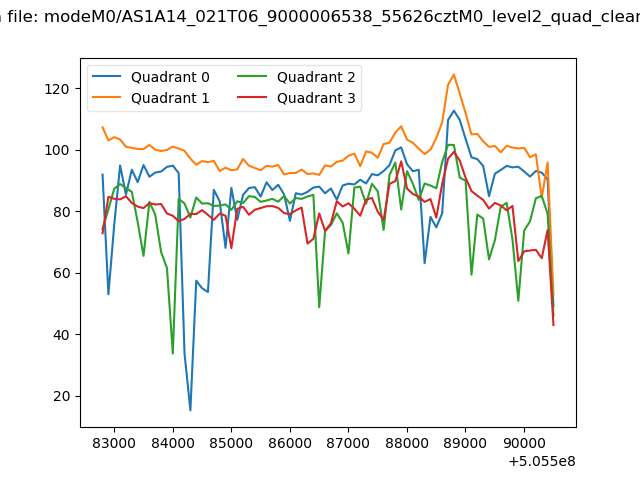 |
|
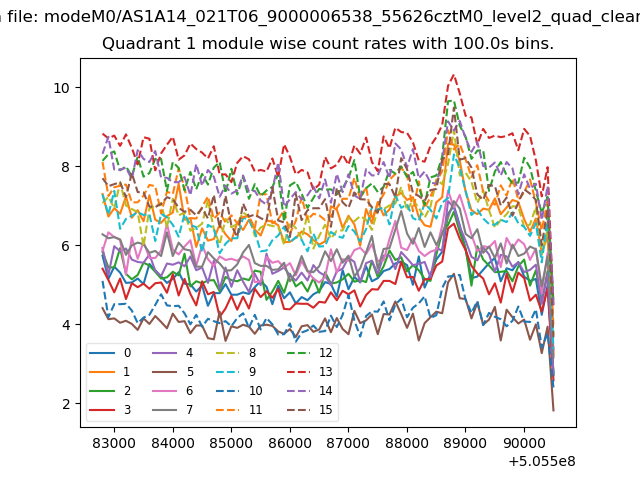
| Module-wise count rates for Quadrant A Data is divided into 100 sec bins |
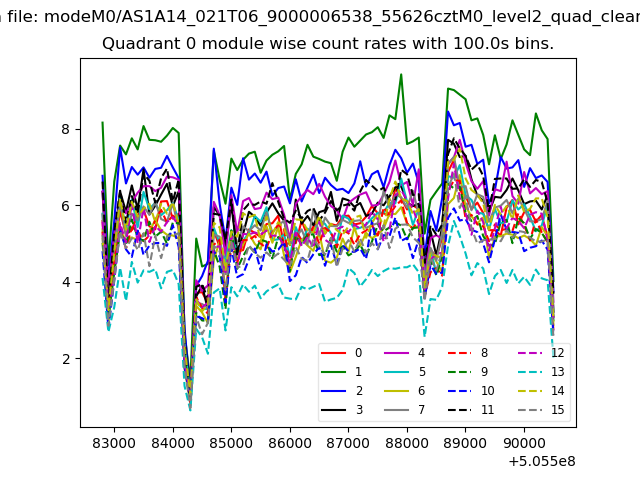 |
 |
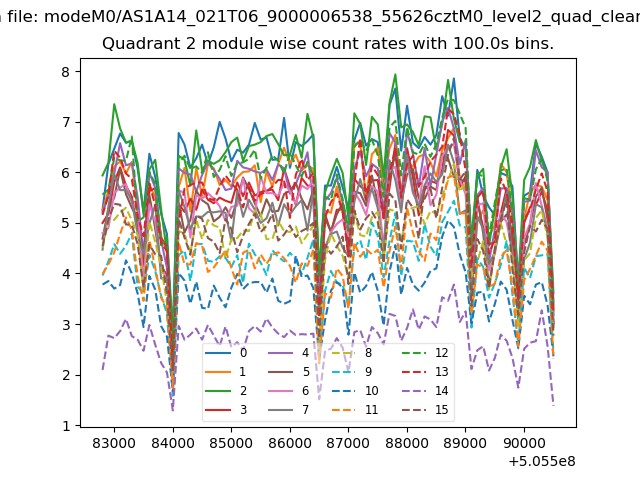
| Module-wise count rates for Quadrant B Data is divided into 100 sec bins |
 |
 |
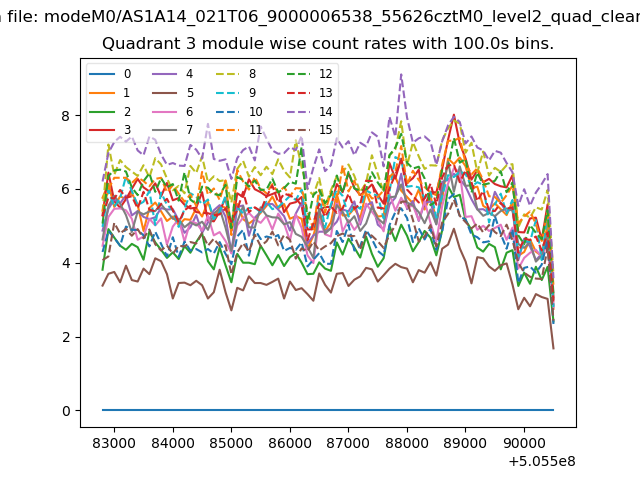
| Module-wise count rates for Quadrant C Data is divided into 100 sec bins |
 |
 |
| Module-wise count rates for Quadrant D Data is divided into 100 sec bins |
 |
 |
| Parameter | Plot |
|---|---|
| CZT HV Monitor | 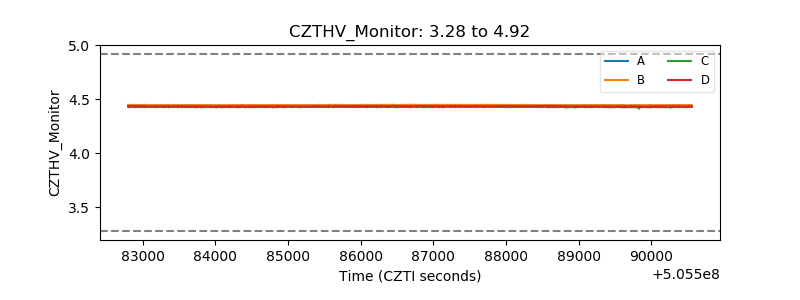 |
| D_VDD | 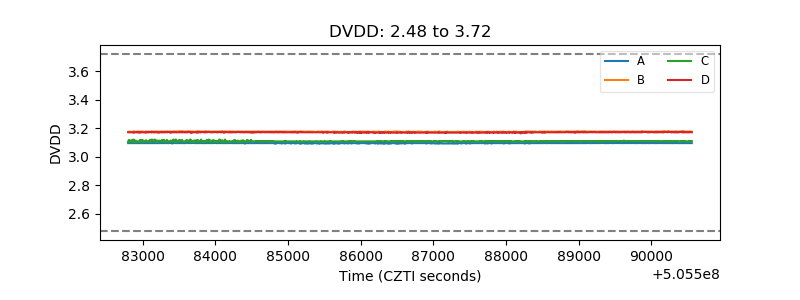 |
| Temperature 1 | 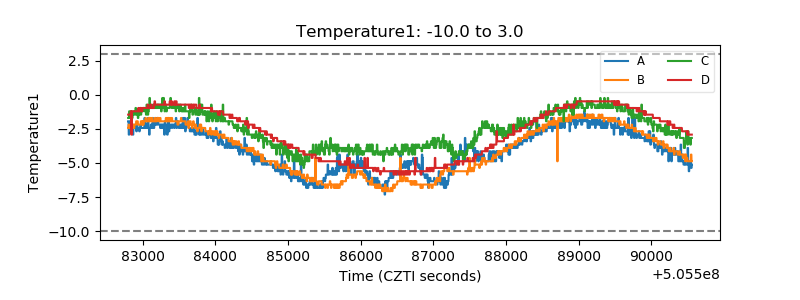 |
| Veto HV Monitor | 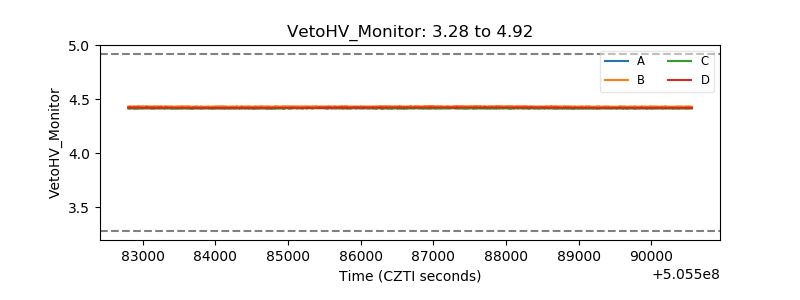 |
| Veto LLD | 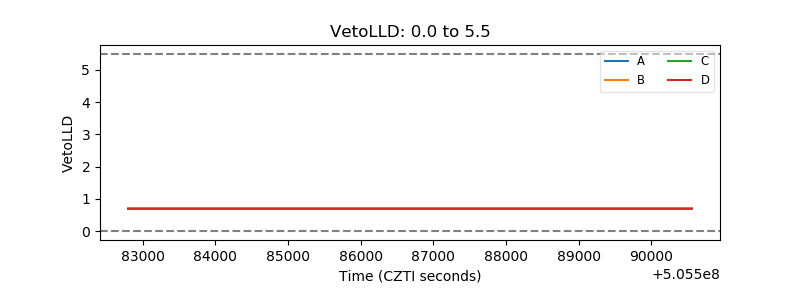 |
| Alpha Counter | 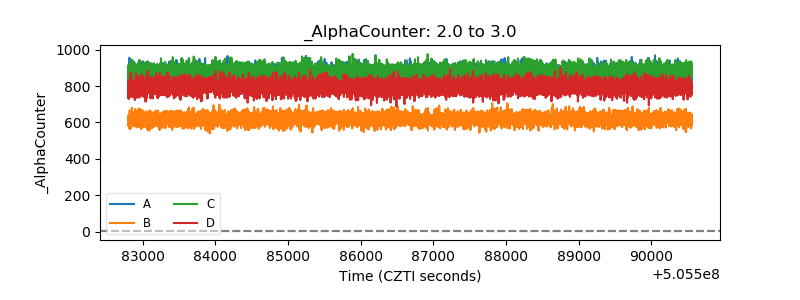 |
| _CPM_Rate | 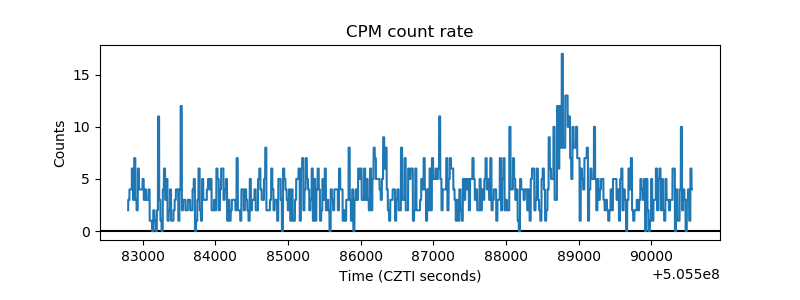 |
| CZT Counter | 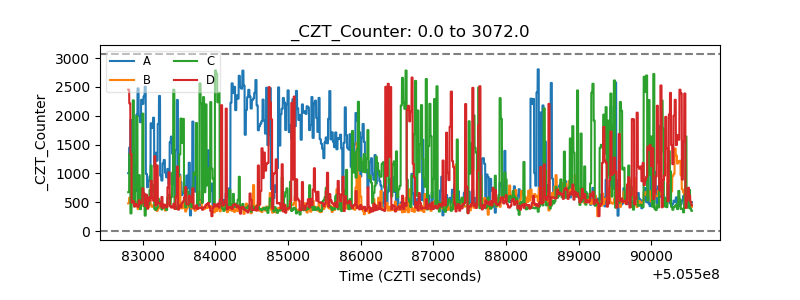 |
| +2.5 Volts monitor | 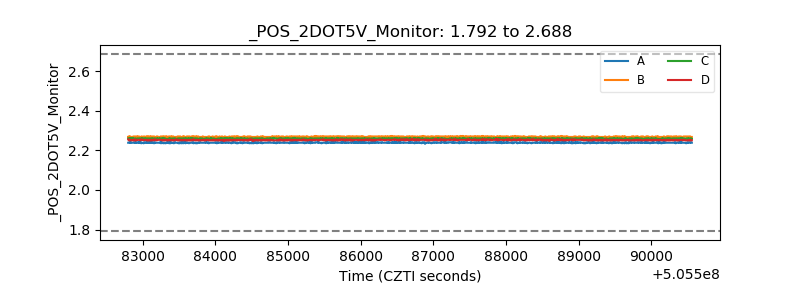 |
| +5 Volts monitor | 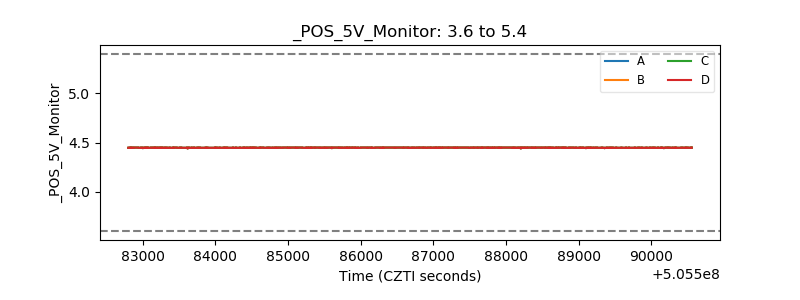 |
| _ROLL_ROT | 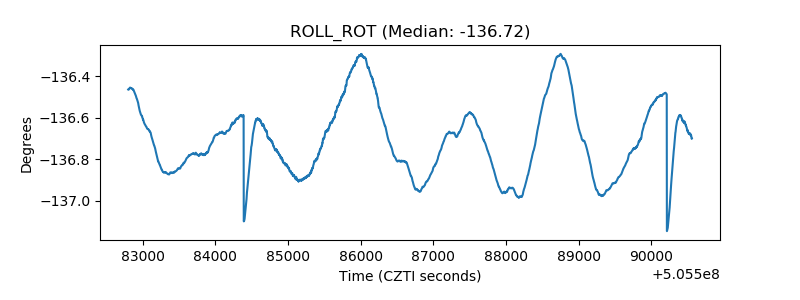 |
| _Roll_DEC | 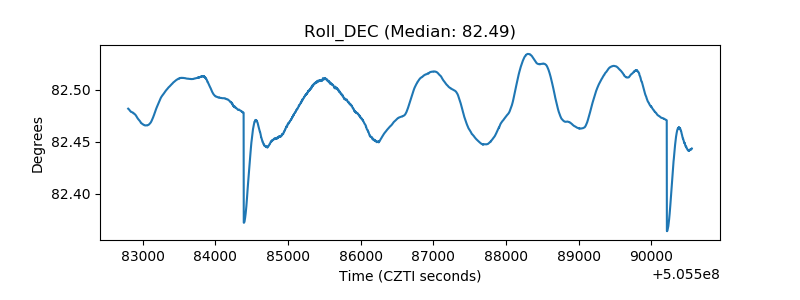 |
| _Roll_RA | 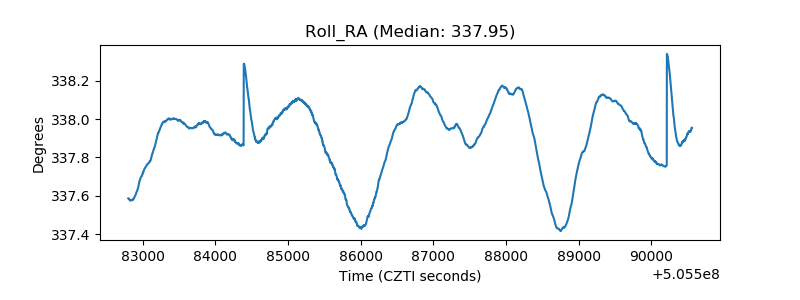 |
| Veto Counter | 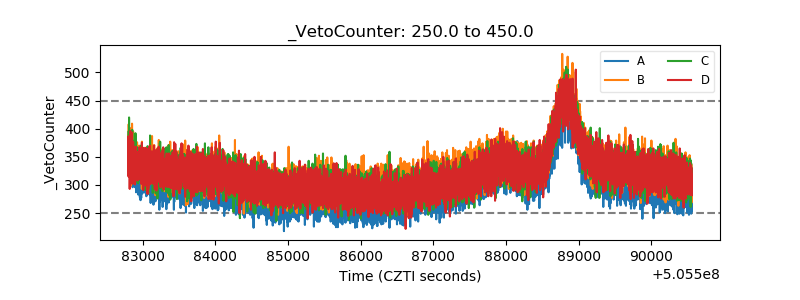 |