| Param | Original file | Final file |
|---|---|---|
| Filename | modeM0/AS1A14_021T06_9000006538_55629cztM0_level2.fits | modeM0/AS1A14_021T06_9000006538_55629cztM0_level2_quad_clean.evt |
| Size (bytes) | 1,319,650,560 | 233,305,920 |
| Size | 1.2 GB | 222.5 MB |
| Events in quadrant A | 15,026,869 | 1,432,057 |
| Events in quadrant B | 9,079,473 | 1,683,576 |
| Events in quadrant C | 8,859,289 | 1,477,498 |
| Events in quadrant D | 14,529,592 | 1,264,398 |
| Mode M9 | |||
|---|---|---|---|
| Quadrant | BADHDUFLAG | Total packets | Discarded packets |
| A | 0 | 15 | 0 |
| B | 0 | 15 | 0 |
| C | 0 | 15 | 0 |
| D | 0 | 15 | 0 |
| Mode M0 | |||
|---|---|---|---|
| Quadrant | BADHDUFLAG | Total packets | Discarded packets |
| A | 0 | 56893 | 3 |
| B | 0 | 40022 | 3 |
| C | 0 | 40171 | 3 |
| D | 0 | 56213 | 3 |
| Mode SS | |||
|---|---|---|---|
| Quadrant | BADHDUFLAG | Total packets | Discarded packets |
| A | 0 | 354 | 0 |
| B | 0 | 354 | 0 |
| C | 0 | 354 | 0 |
| D | 0 | 354 | 0 |
| Quadrant | Total seconds | Saturated seconds | Saturation percentage |
|---|---|---|---|
| A | 17499 | 1892 | 10.812046% |
| B | 17500 | 260 | 1.485714% |
| C | 17499 | 443 | 2.531573% |
| D | 17499 | 2043 | 11.674953% |
Noise dominated data is calculated using 1-second bins in cleaned event files. If a bin has >2000 counts, and if more than 50% of those come from <1% of pixels, then it is considered to be noise-dominated and hence unusable.
| Quadrant | # 1 sec bins | Bins with >0 counts | Bins with >2000 counts | High rate bins dominated by noise | Noise dominated (total time) | Noise dominated (detector-on time) | Marked lightcurve |
|---|---|---|---|---|---|---|---|
| A | 18914 | 17501 | 1897 | 1897 | 10.03% | 10.84% | 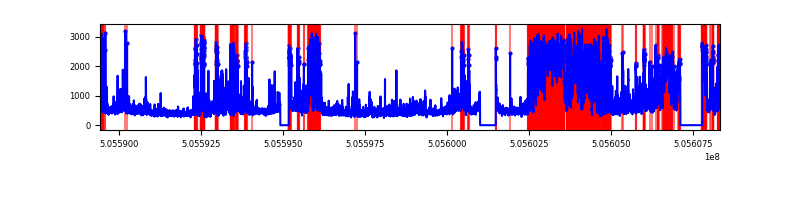 |
| B | 18915 | 17500 | 106 | 106 | 0.56% | 0.61% | 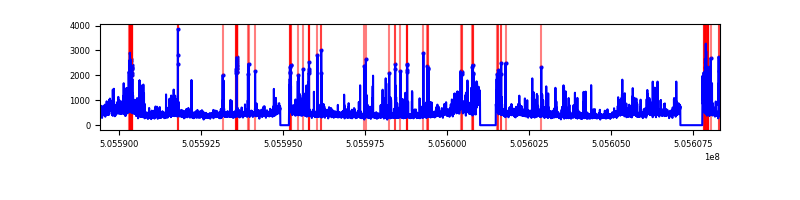 |
| C | 18914 | 17502 | 381 | 381 | 2.01% | 2.18% | 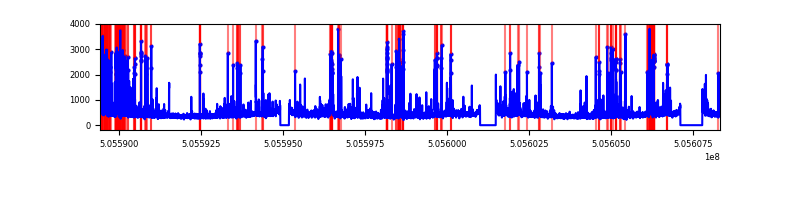 |
| D | 18914 | 17500 | 1945 | 1945 | 10.28% | 11.11% | 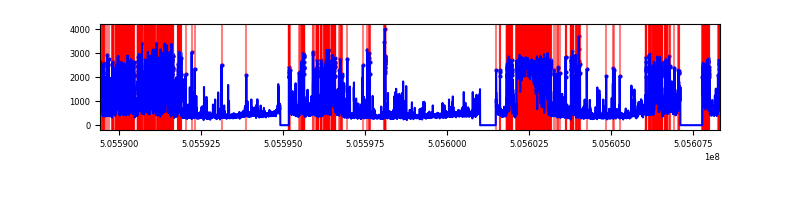 |
Top three noisy pixels from each quadrant. If the there are fewer than three noisy pixels in the level2.evt file, extra rows are filled as -1
| Pixel properties | Quadrant properties | ||||||
|---|---|---|---|---|---|---|---|
| Quadrant | DetID | PixID | Counts | Sigma | Mean | Median | Sigma |
| A | 12 | 115 | 5247386 | 12119.36 | 1746 | 1700 | 432.8 |
| A | 15 | 32 | 1445905 | 3336.61 | 1746 | 1700 | 432.8 |
| A | 0 | 8 | 522067 | 1202.23 | 1746 | 1700 | 432.8 |
| B | 7 | 0 | 597320 | 1579.07 | 1768 | 1703 | 377.2 |
| B | 5 | 185 | 466369 | 1231.9 | 1768 | 1703 | 377.2 |
| B | 1 | 159 | 373133 | 984.71 | 1768 | 1703 | 377.2 |
| C | 15 | 148 | 591751 | 1253.18 | 1730 | 1713 | 470.8 |
| C | 6 | 223 | 484958 | 1026.36 | 1730 | 1713 | 470.8 |
| C | 12 | 2 | 320361 | 676.78 | 1730 | 1713 | 470.8 |
| D | 11 | 129 | 6169344 | 13179.61 | 1656 | 1581 | 468.0 |
| D | 8 | 245 | 572531 | 1220.04 | 1656 | 1581 | 468.0 |
| D | 6 | 46 | 368500 | 784.05 | 1656 | 1581 | 468.0 |
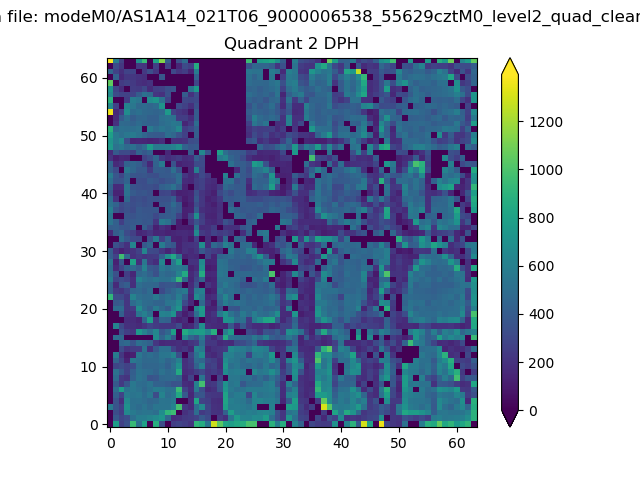
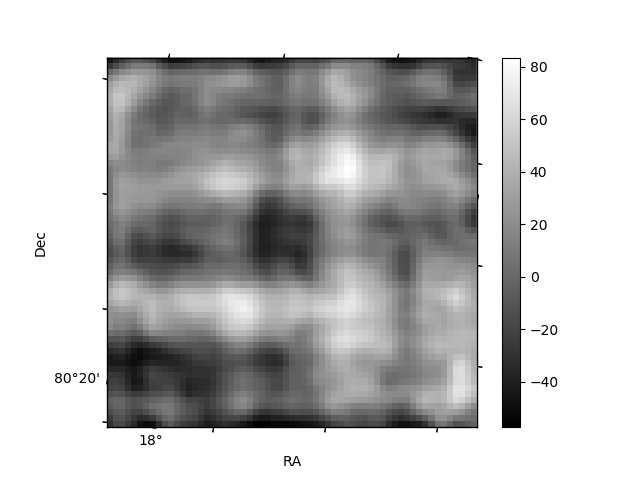
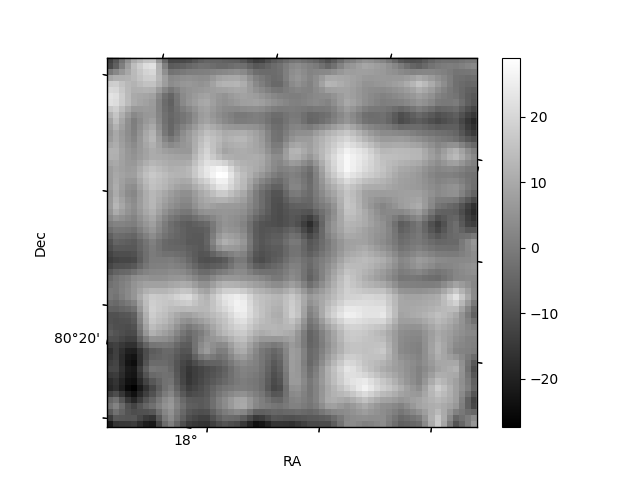
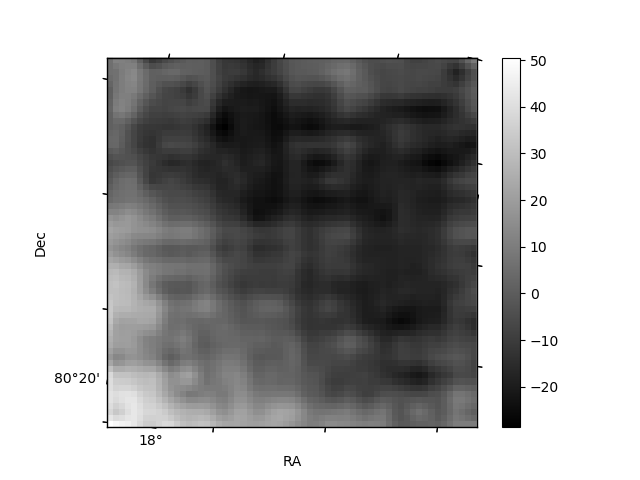
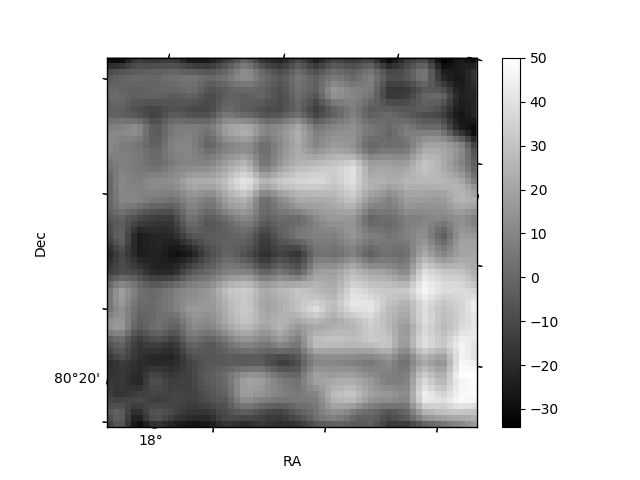
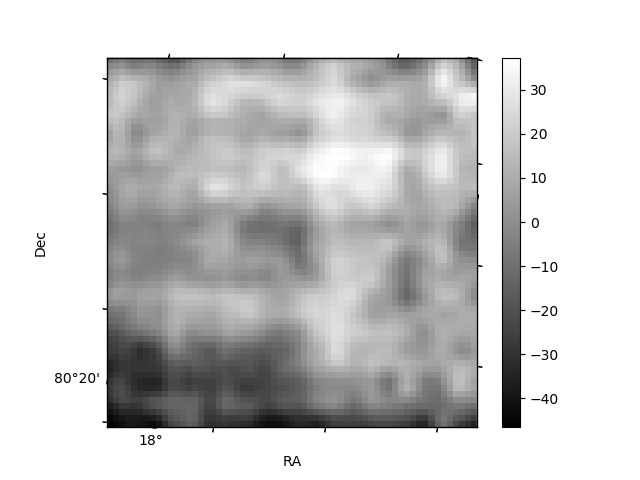
Histogram calculated using DETX and DETY for each event in the final _common_clean file
| Quadrant A | 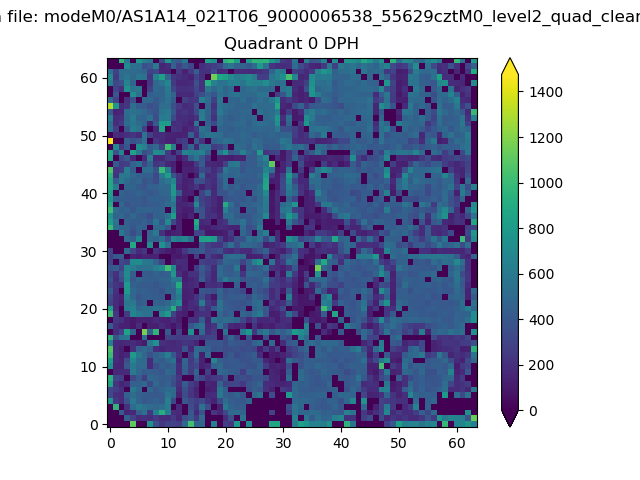 |
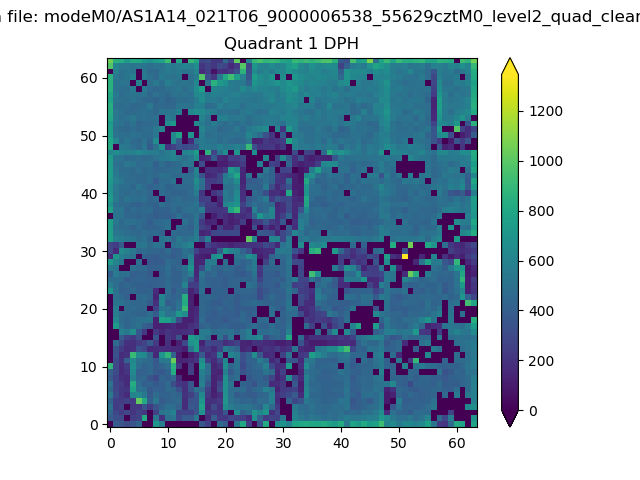 |
Quadrant B |
|---|---|---|---|
| Quadrant D | 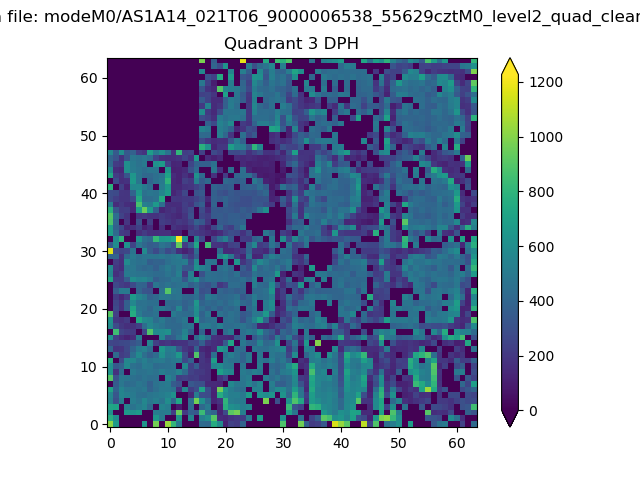 |
 |
Quadrant C |
| Plot type | Count rate plots | Images |
|---|---|---|
| Comparison with Poisson distribution Blue bars denote a histogram of data divided into 1 sec bins. Red curve is a Poisson curve with rate = median count rate of data. |
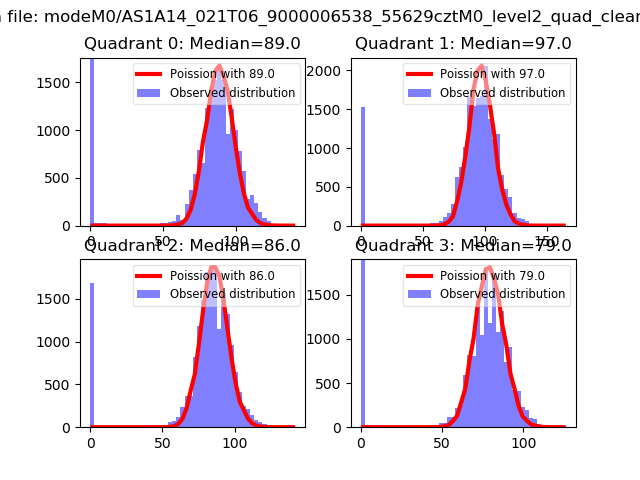 |
 |
| Quadrant-wise count rates Data is divided into 100 sec bins |
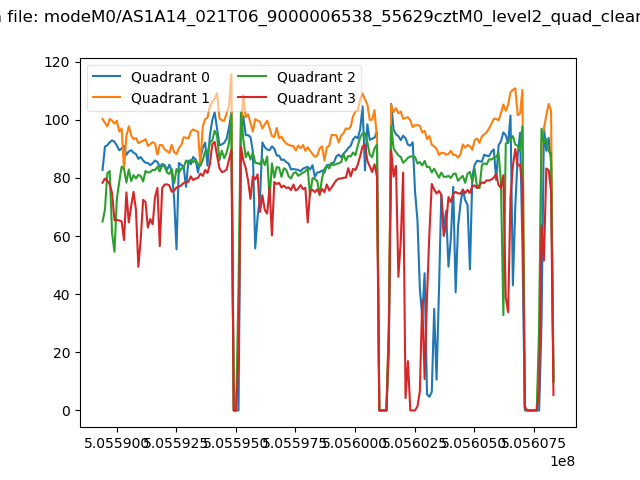 |
|
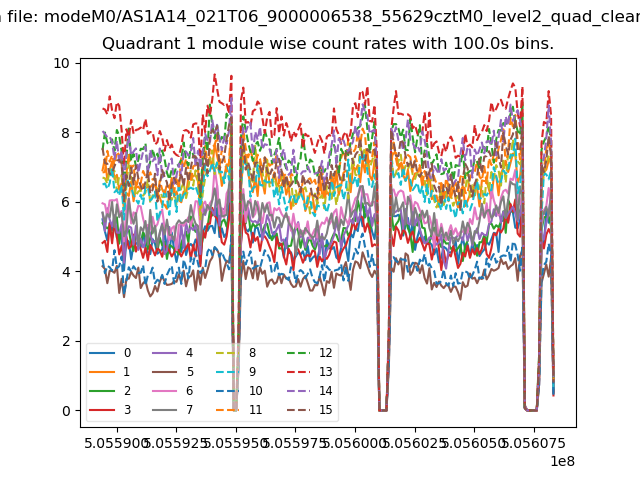
| Module-wise count rates for Quadrant A Data is divided into 100 sec bins |
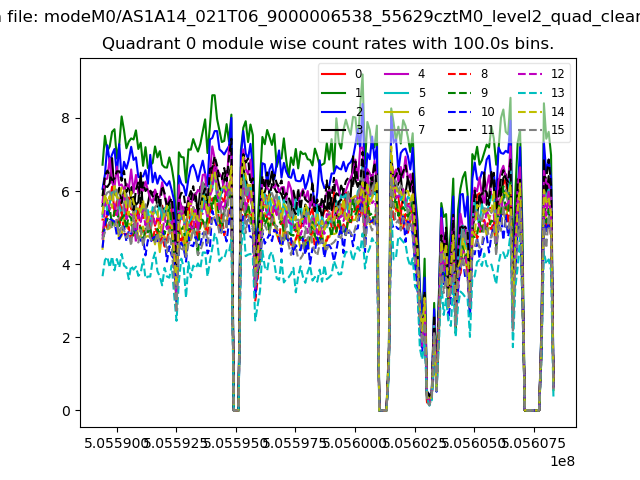 |
 |
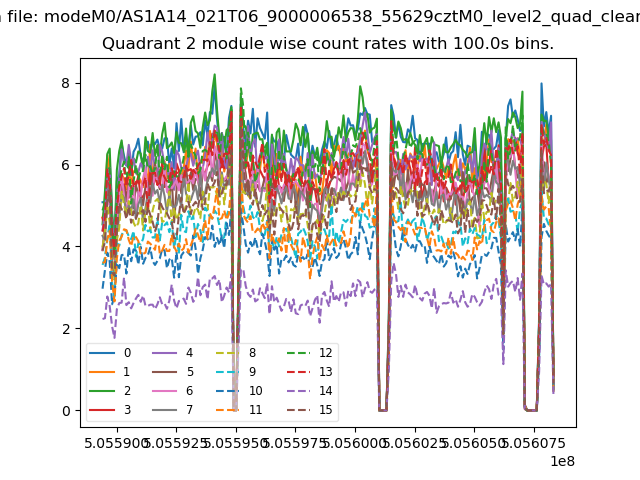
| Module-wise count rates for Quadrant B Data is divided into 100 sec bins |
 |
 |
| Module-wise count rates for Quadrant C Data is divided into 100 sec bins |
 |
 |
| Module-wise count rates for Quadrant D Data is divided into 100 sec bins |
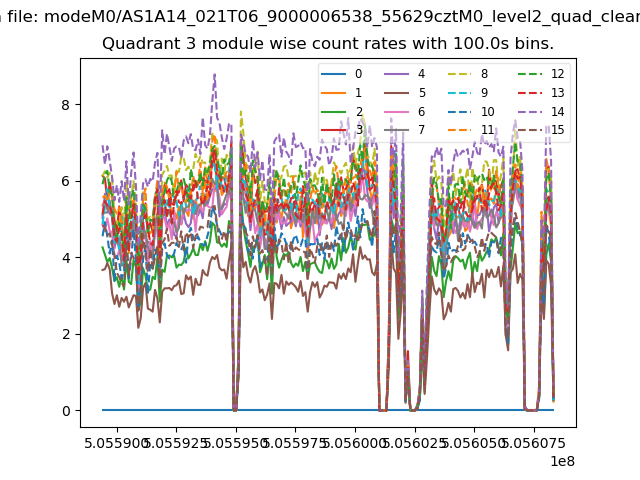 |
 |
| Parameter | Plot |
|---|---|
| CZT HV Monitor | 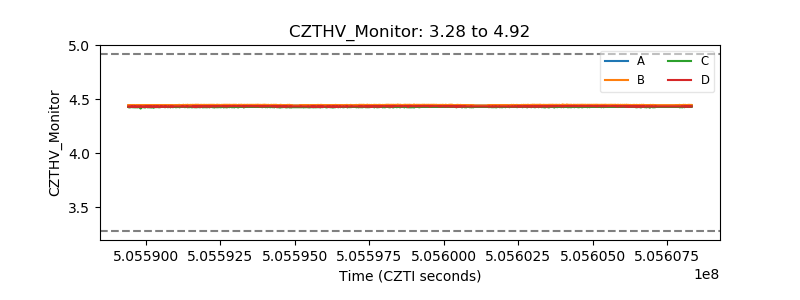 |
| D_VDD | 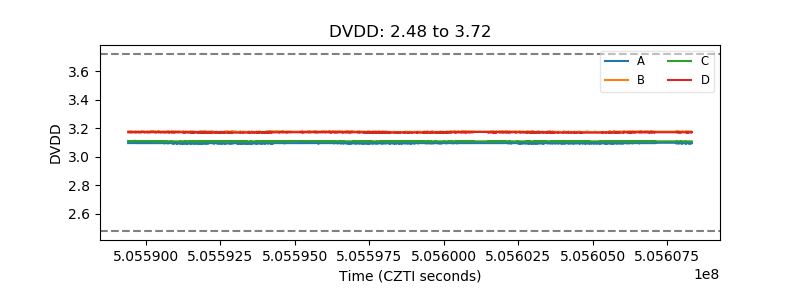 |
| Temperature 1 | 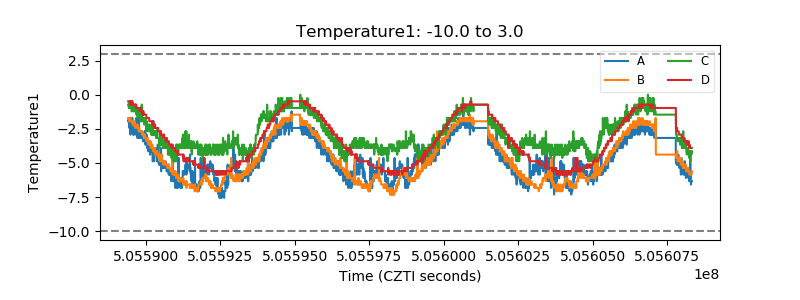 |
| Veto HV Monitor | 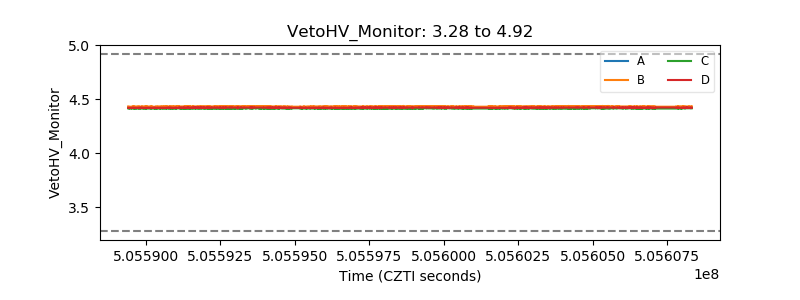 |
| Veto LLD | 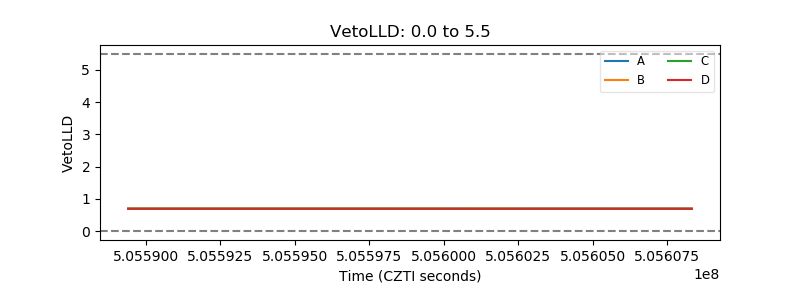 |
| Alpha Counter | 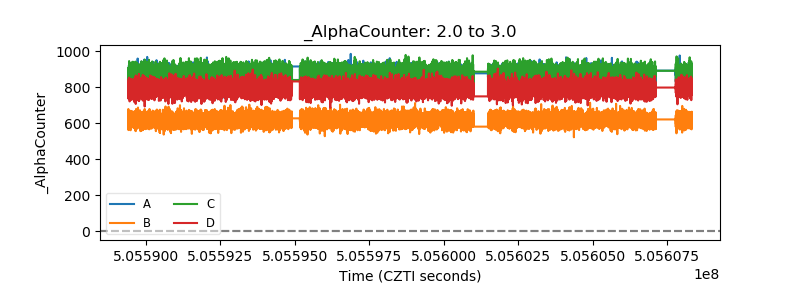 |
| _CPM_Rate | 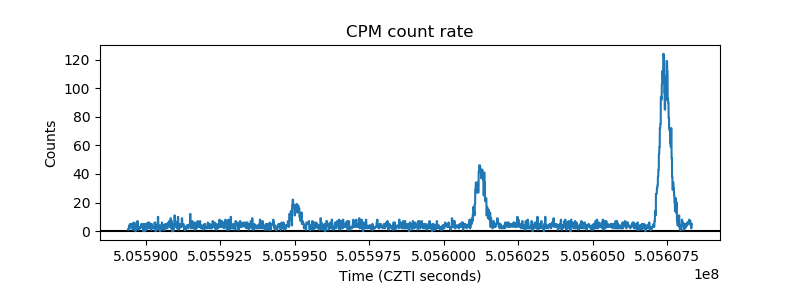 |
| CZT Counter | 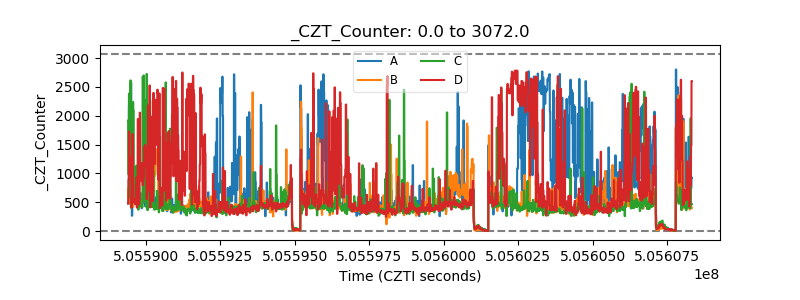 |
| +2.5 Volts monitor | 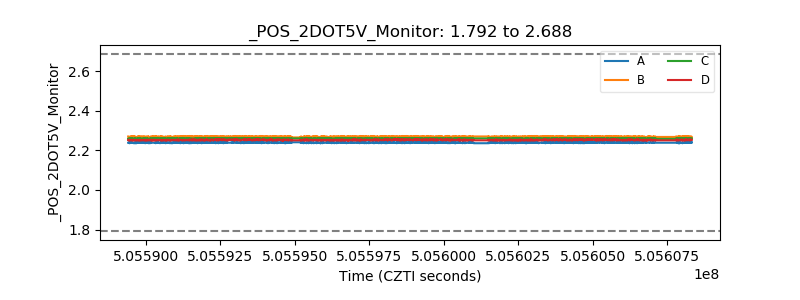 |
| +5 Volts monitor | 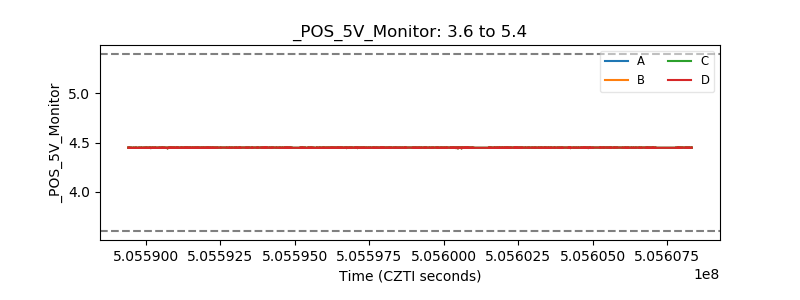 |
| _ROLL_ROT | 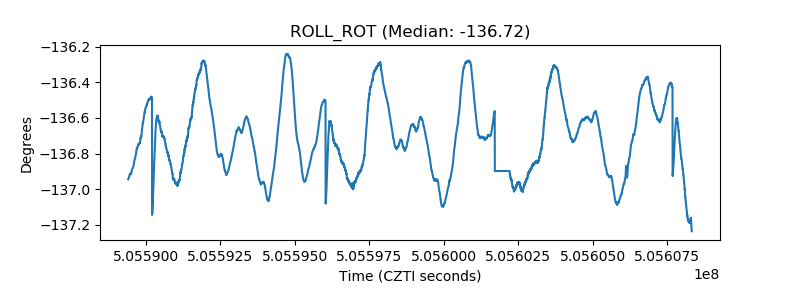 |
| _Roll_DEC | 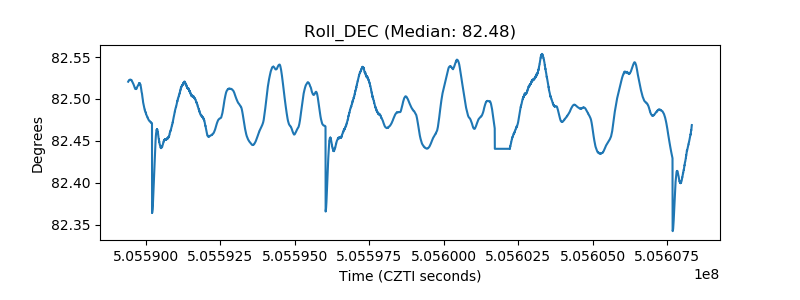 |
| _Roll_RA | 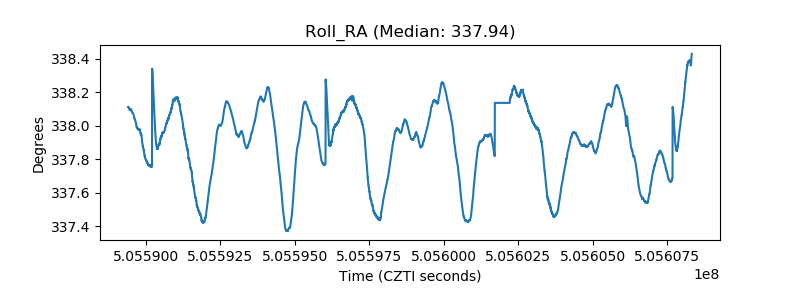 |
| Veto Counter | 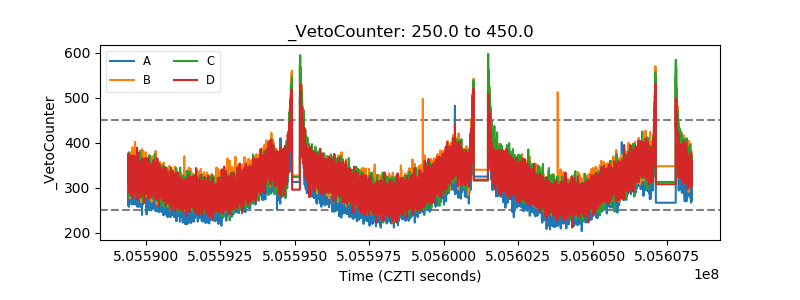 |