| Param | Original file | Final file |
|---|---|---|
| Filename | modeM0/AS1A14_021T06_9000006538_55630cztM0_level2.fits | modeM0/AS1A14_021T06_9000006538_55630cztM0_level2_quad_clean.evt |
| Size (bytes) | 447,272,640 | 98,832,960 |
| Size | 426.6 MB | 94.3 MB |
| Events in quadrant A | 4,733,749 | 624,482 |
| Events in quadrant B | 3,632,747 | 687,717 |
| Events in quadrant C | 3,524,718 | 613,927 |
| Events in quadrant D | 4,118,694 | 577,016 |
| Mode M9 | |||
|---|---|---|---|
| Quadrant | BADHDUFLAG | Total packets | Discarded packets |
| A | 0 | 15 | 0 |
| B | 0 | 15 | 0 |
| C | 0 | 15 | 0 |
| D | 0 | 15 | 0 |
| Mode M0 | |||
|---|---|---|---|
| Quadrant | BADHDUFLAG | Total packets | Discarded packets |
| A | 0 | 19029 | 2 |
| B | 0 | 16163 | 2 |
| C | 0 | 15956 | 2 |
| D | 0 | 17449 | 2 |
| Mode SS | |||
|---|---|---|---|
| Quadrant | BADHDUFLAG | Total packets | Discarded packets |
| A | 0 | 144 | 0 |
| B | 0 | 144 | 0 |
| C | 0 | 144 | 0 |
| D | 0 | 144 | 0 |
| Quadrant | Total seconds | Saturated seconds | Saturation percentage |
|---|---|---|---|
| A | 7028 | 313 | 4.453614% |
| B | 7029 | 159 | 2.262057% |
| C | 7029 | 108 | 1.536492% |
| D | 7029 | 165 | 2.347418% |
Noise dominated data is calculated using 1-second bins in cleaned event files. If a bin has >2000 counts, and if more than 50% of those come from <1% of pixels, then it is considered to be noise-dominated and hence unusable.
| Quadrant | # 1 sec bins | Bins with >0 counts | Bins with >2000 counts | High rate bins dominated by noise | Noise dominated (total time) | Noise dominated (detector-on time) | Marked lightcurve |
|---|---|---|---|---|---|---|---|
| A | 8558 | 7029 | 302 | 302 | 3.53% | 4.30% | 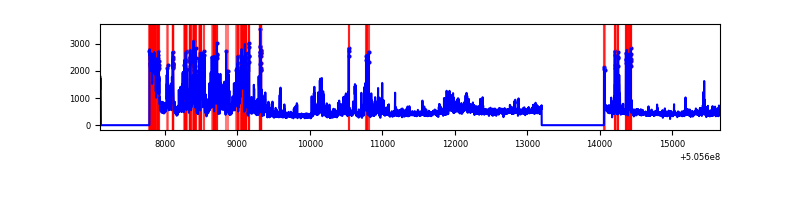 |
| B | 8559 | 7030 | 73 | 73 | 0.85% | 1.04% | 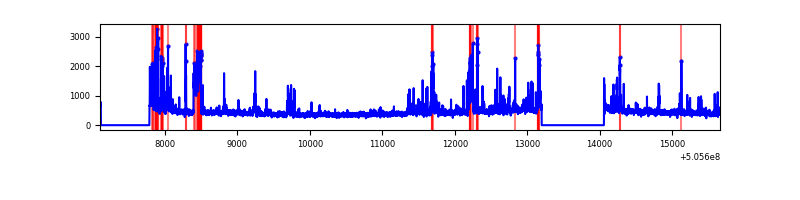 |
| C | 8559 | 7031 | 120 | 120 | 1.40% | 1.71% | 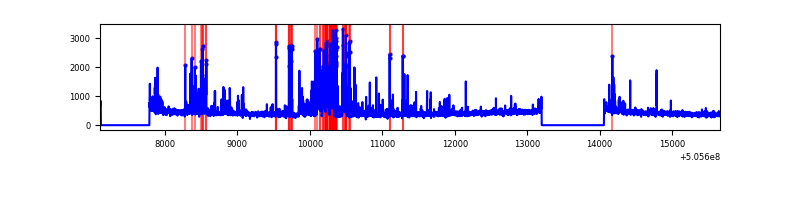 |
| D | 8559 | 7030 | 147 | 147 | 1.72% | 2.09% | 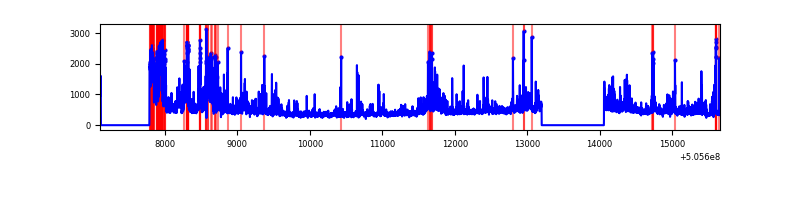 |
Top three noisy pixels from each quadrant. If the there are fewer than three noisy pixels in the level2.evt file, extra rows are filled as -1
| Pixel properties | Quadrant properties | ||||||
|---|---|---|---|---|---|---|---|
| Quadrant | DetID | PixID | Counts | Sigma | Mean | Median | Sigma |
| A | 12 | 115 | 1243184 | 7079.67 | 708 | 691 | 175.5 |
| A | 15 | 32 | 394400 | 2243.33 | 708 | 691 | 175.5 |
| A | 8 | 249 | 217389 | 1234.73 | 708 | 691 | 175.5 |
| B | 5 | 185 | 474777 | 3128.92 | 710 | 684 | 151.5 |
| B | 1 | 159 | 190632 | 1253.62 | 710 | 684 | 151.5 |
| B | 9 | 251 | 62683 | 409.18 | 710 | 684 | 151.5 |
| C | 6 | 223 | 357269 | 1846.87 | 701 | 694 | 193.1 |
| C | 12 | 2 | 190674 | 984.0 | 701 | 694 | 193.1 |
| C | 15 | 178 | 76015 | 390.12 | 701 | 694 | 193.1 |
| D | 11 | 129 | 1194270 | 5993.15 | 695 | 663 | 199.2 |
| D | 5 | 173 | 53710 | 266.35 | 695 | 663 | 199.2 |
| D | 15 | 91 | 32934 | 162.03 | 695 | 663 | 199.2 |
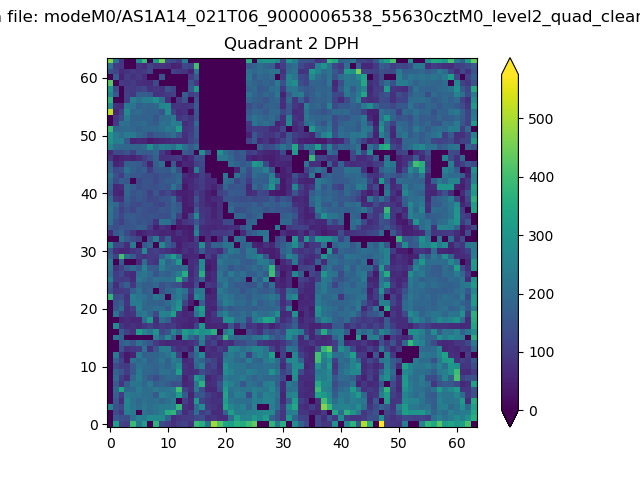
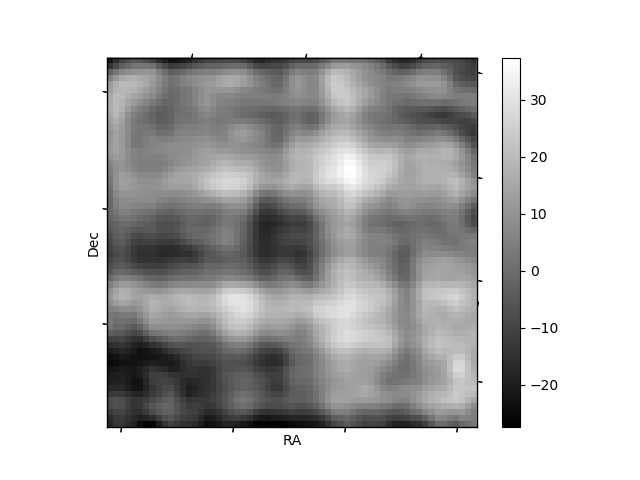
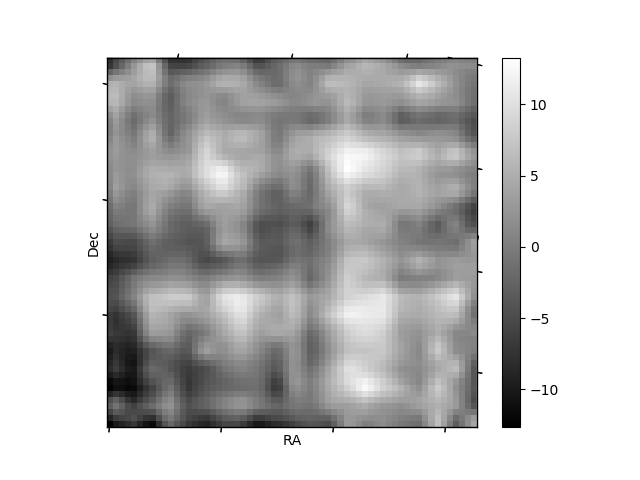
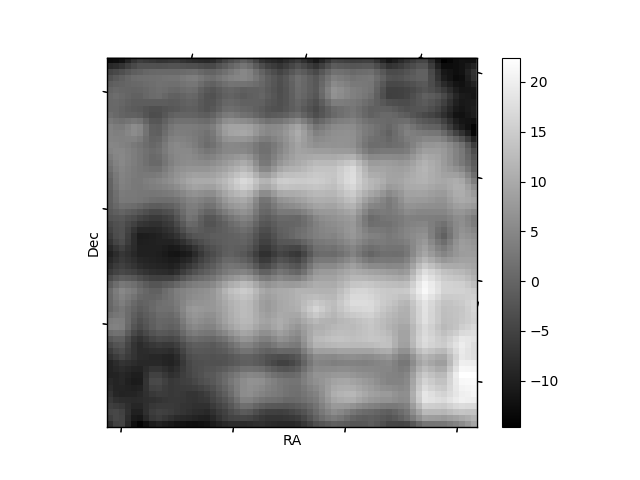
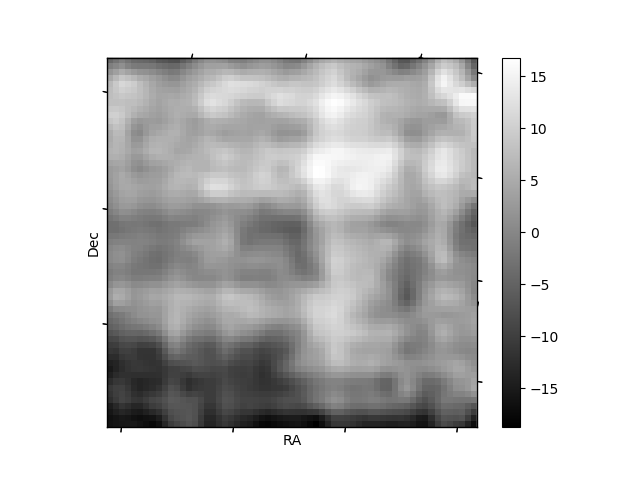
Histogram calculated using DETX and DETY for each event in the final _common_clean file
| Quadrant A | 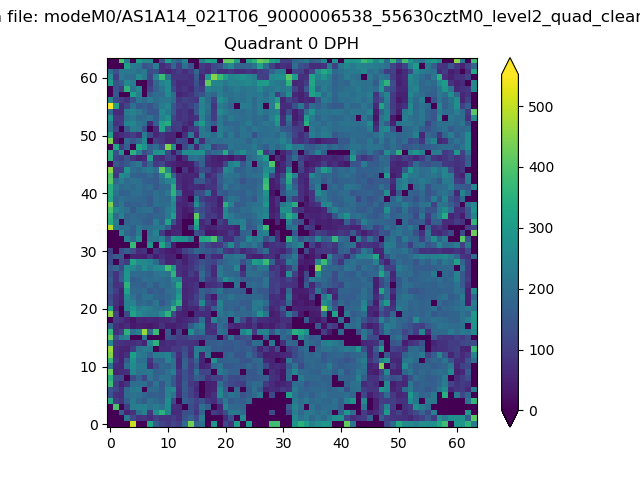 |
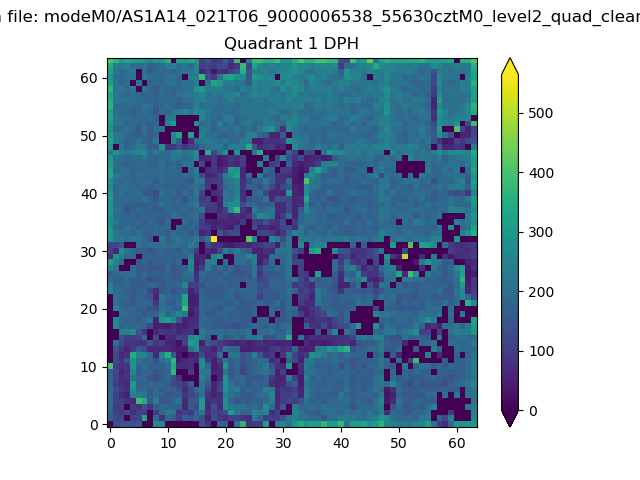 |
Quadrant B |
|---|---|---|---|
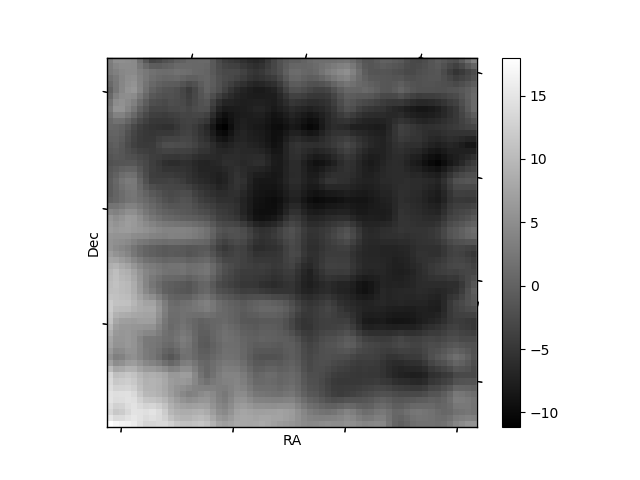
| Quadrant D | 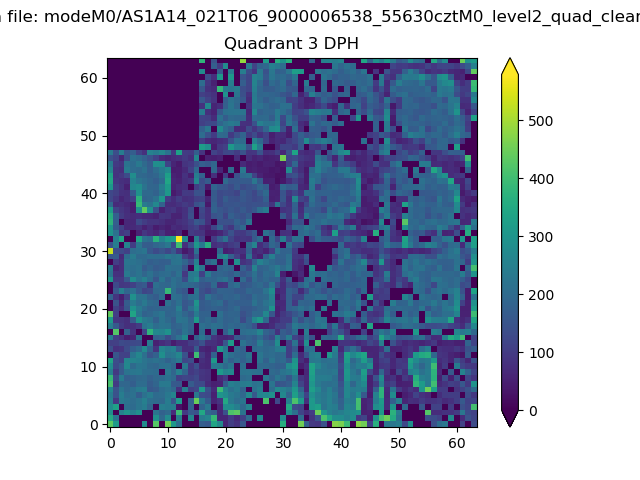 |
 |
Quadrant C |
| Plot type | Count rate plots | Images |
|---|---|---|
| Comparison with Poisson distribution Blue bars denote a histogram of data divided into 1 sec bins. Red curve is a Poisson curve with rate = median count rate of data. |
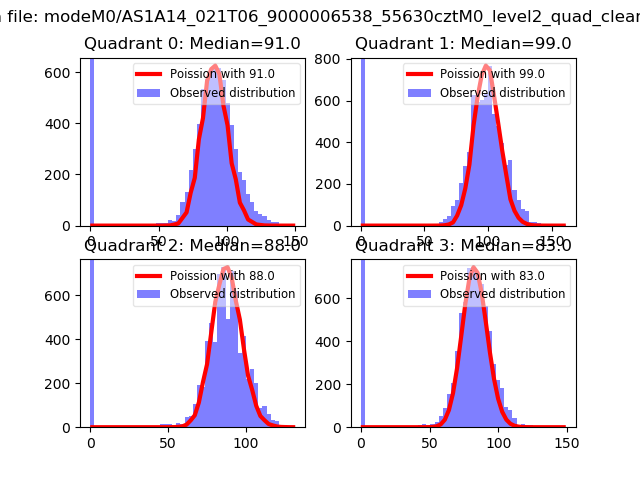 |
 |
| Quadrant-wise count rates Data is divided into 100 sec bins |
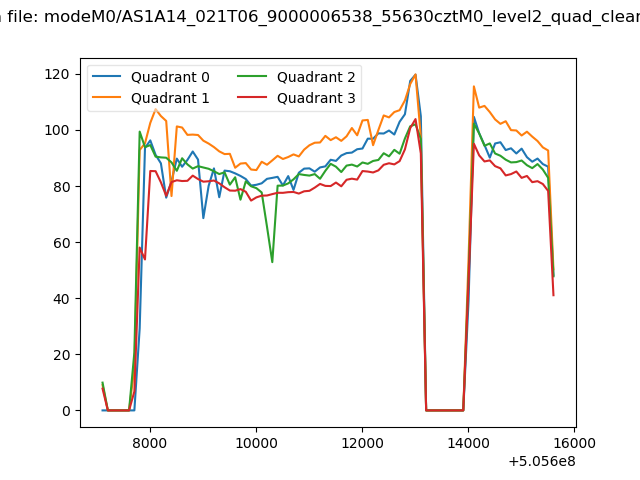 |
|
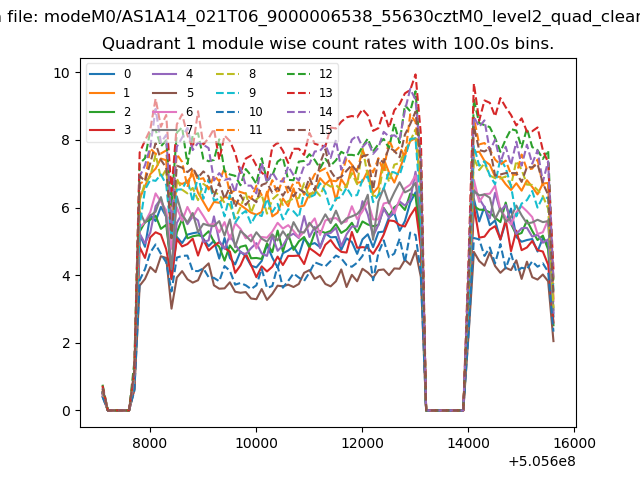
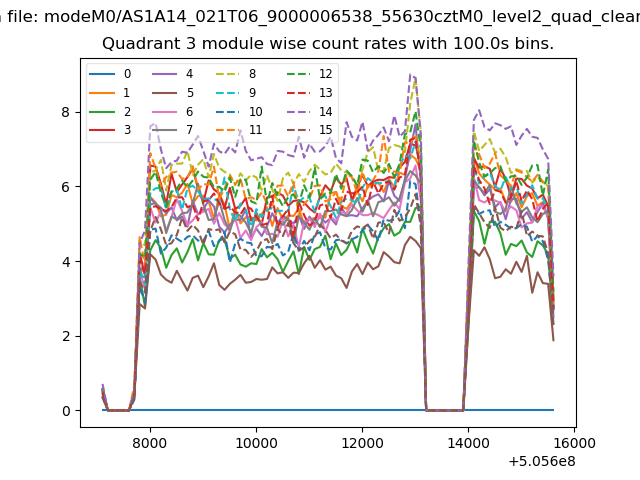
| Module-wise count rates for Quadrant A Data is divided into 100 sec bins |
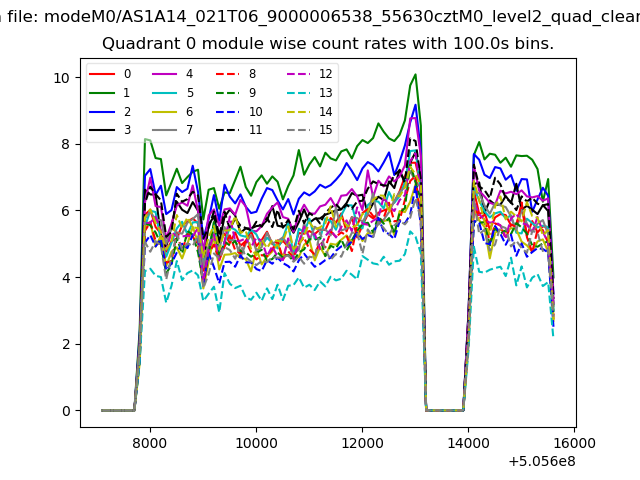 |
 |
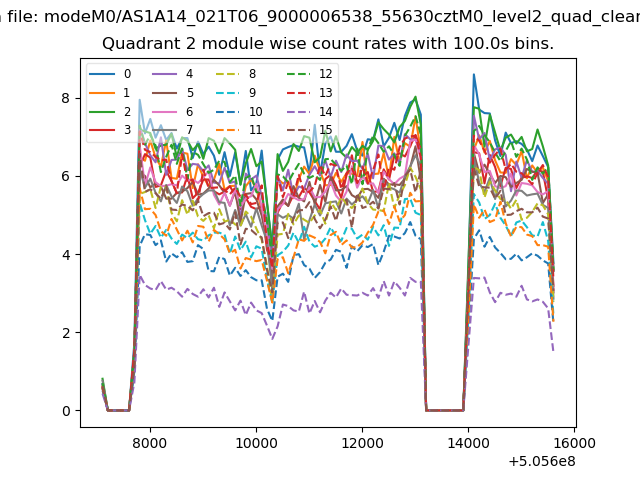
| Module-wise count rates for Quadrant B Data is divided into 100 sec bins |
 |
 |
| Module-wise count rates for Quadrant C Data is divided into 100 sec bins |
 |
 |
| Module-wise count rates for Quadrant D Data is divided into 100 sec bins |
 |
 |
| Parameter | Plot |
|---|---|
| CZT HV Monitor | 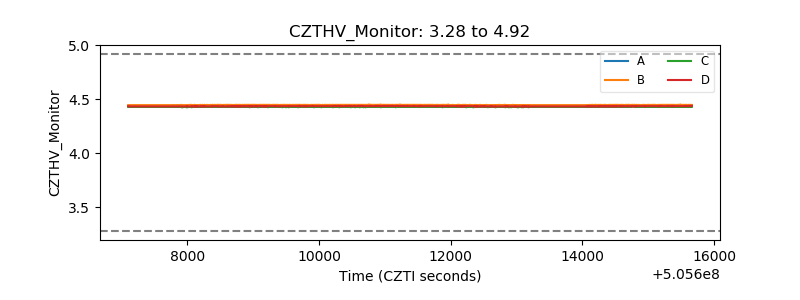 |
| D_VDD | 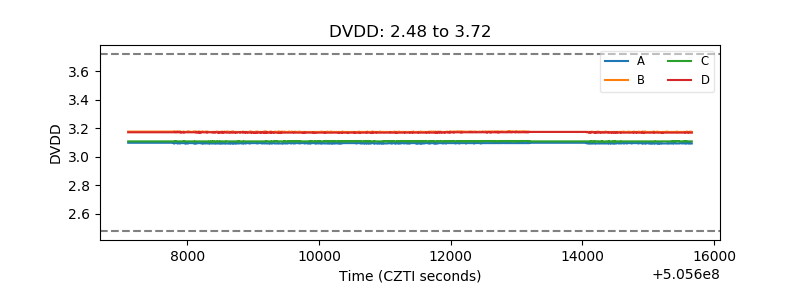 |
| Temperature 1 | 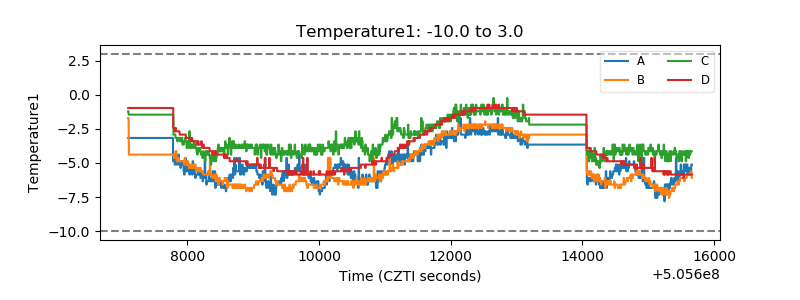 |
| Veto HV Monitor | 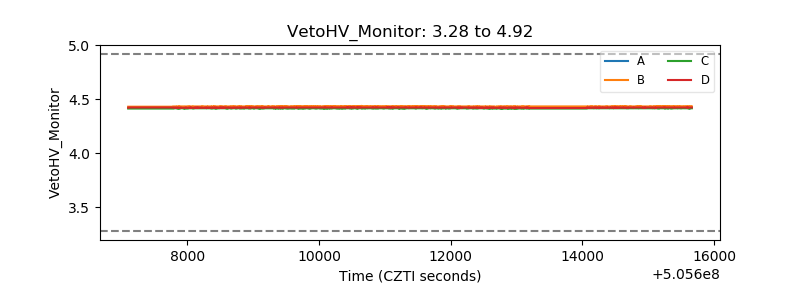 |
| Veto LLD | 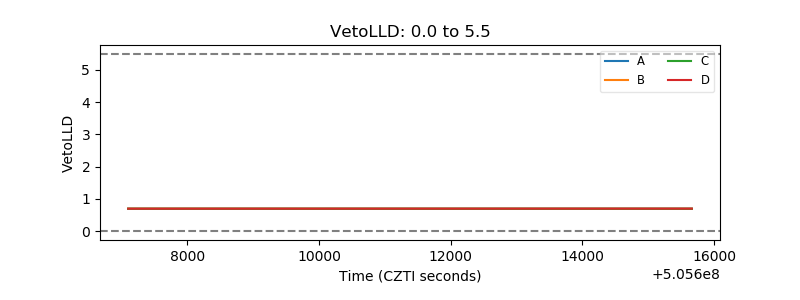 |
| Alpha Counter | 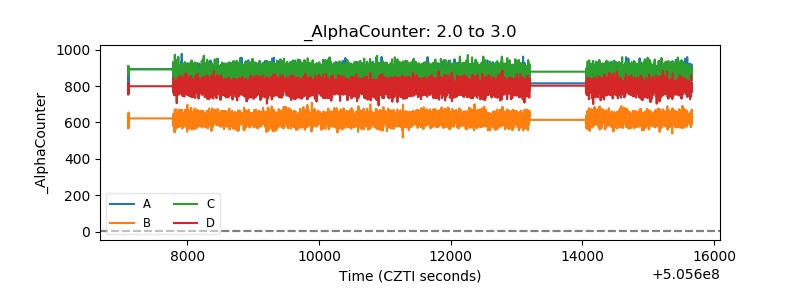 |
| _CPM_Rate | 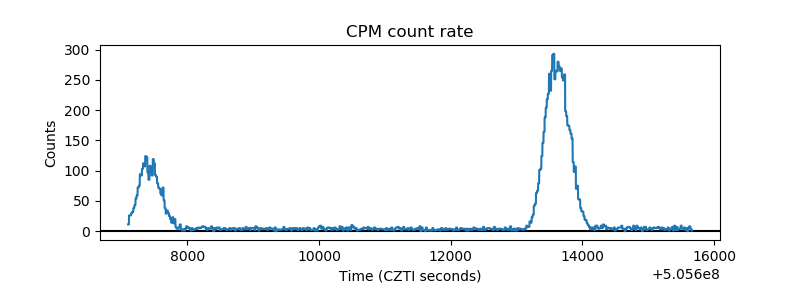 |
| CZT Counter | 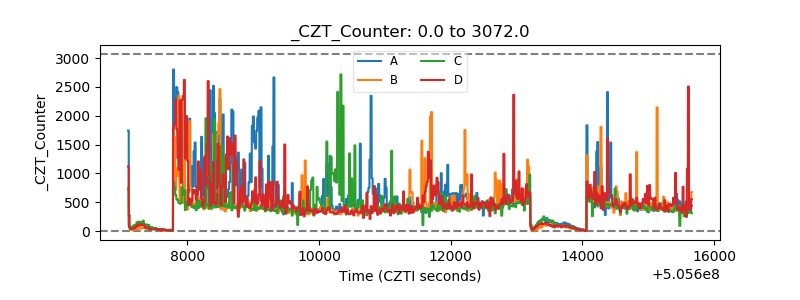 |
| +2.5 Volts monitor | 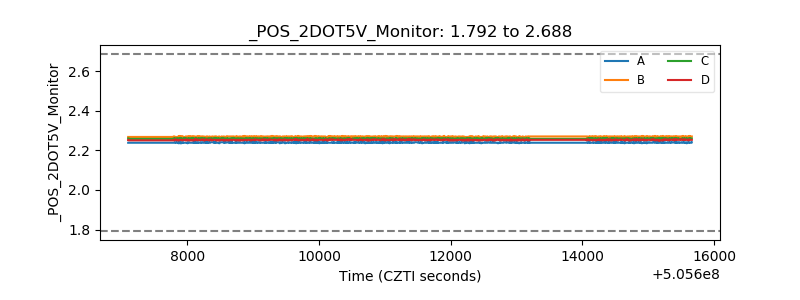 |
| +5 Volts monitor | 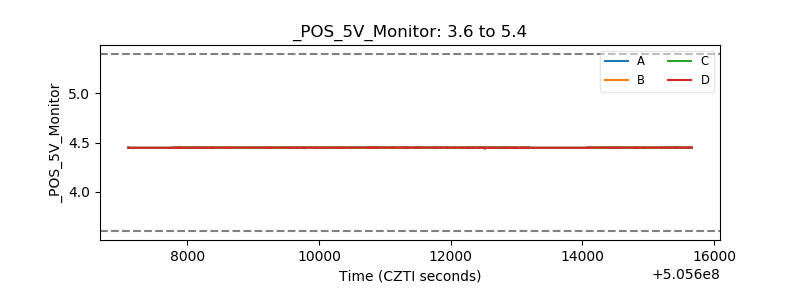 |
| _ROLL_ROT | 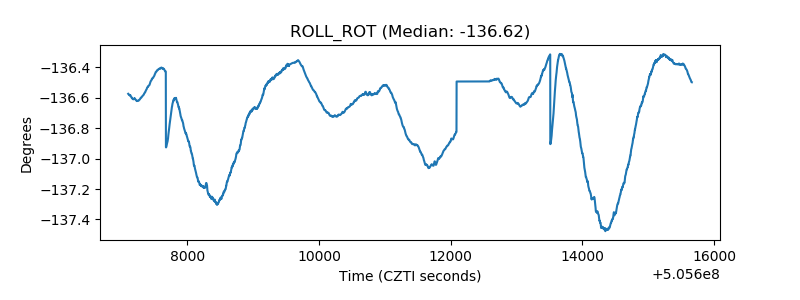 |
| _Roll_DEC | 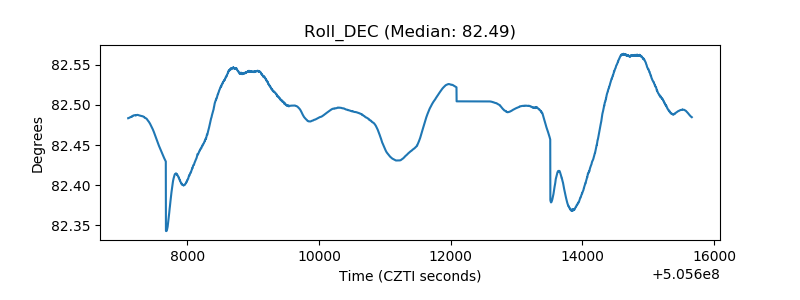 |
| _Roll_RA | 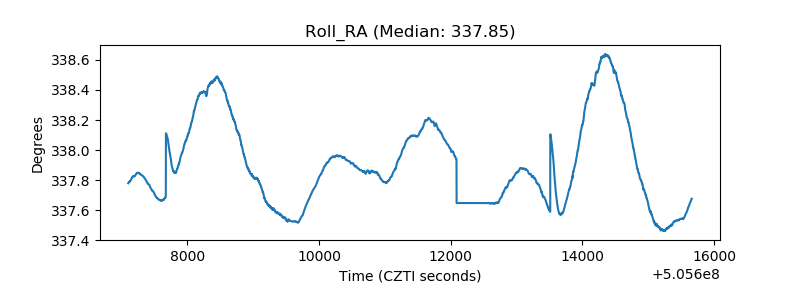 |
| Veto Counter | 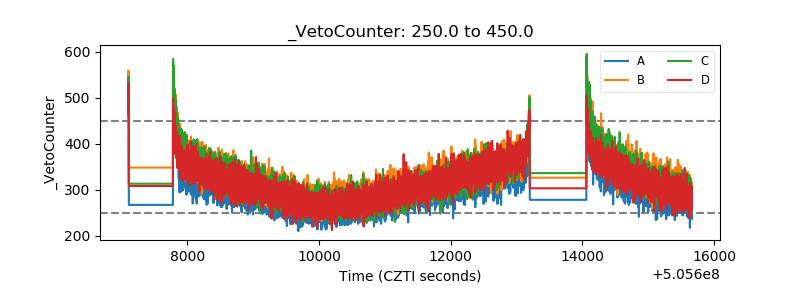 |