| Param | Original file | Final file |
|---|---|---|
| Filename | modeM0/AS1A14_021T06_9000006538_55633cztM0_level2.fits | modeM0/AS1A14_021T06_9000006538_55633cztM0_level2_quad_clean.evt |
| Size (bytes) | 512,645,760 | 93,600,000 |
| Size | 488.9 MB | 89.3 MB |
| Events in quadrant A | 5,559,118 | 577,024 |
| Events in quadrant B | 2,923,857 | 693,381 |
| Events in quadrant C | 3,164,371 | 611,033 |
| Events in quadrant D | 6,801,642 | 480,201 |
| Mode M9 | |||
|---|---|---|---|
| Quadrant | BADHDUFLAG | Total packets | Discarded packets |
| A | 0 | 21 | 0 |
| B | 0 | 21 | 0 |
| C | 0 | 21 | 0 |
| D | 0 | 21 | 0 |
| Mode M0 | |||
|---|---|---|---|
| Quadrant | BADHDUFLAG | Total packets | Discarded packets |
| A | 0 | 21496 | 2 |
| B | 0 | 13962 | 2 |
| C | 0 | 14712 | 2 |
| D | 0 | 25259 | 2 |
| Mode SS | |||
|---|---|---|---|
| Quadrant | BADHDUFLAG | Total packets | Discarded packets |
| A | 0 | 138 | 0 |
| B | 0 | 138 | 0 |
| C | 0 | 138 | 0 |
| D | 0 | 138 | 0 |
| Quadrant | Total seconds | Saturated seconds | Saturation percentage |
|---|---|---|---|
| A | 6785 | 757 | 11.156964% |
| B | 6786 | 29 | 0.427350% |
| C | 6786 | 54 | 0.795756% |
| D | 6786 | 1176 | 17.329797% |
Noise dominated data is calculated using 1-second bins in cleaned event files. If a bin has >2000 counts, and if more than 50% of those come from <1% of pixels, then it is considered to be noise-dominated and hence unusable.
| Quadrant | # 1 sec bins | Bins with >0 counts | Bins with >2000 counts | High rate bins dominated by noise | Noise dominated (total time) | Noise dominated (detector-on time) | Marked lightcurve |
|---|---|---|---|---|---|---|---|
| A | 8850 | 6787 | 728 | 728 | 8.23% | 10.73% | 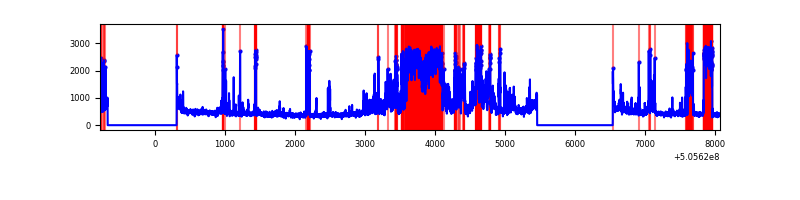 |
| B | 8851 | 6788 | 3 | 3 | 0.03% | 0.04% | 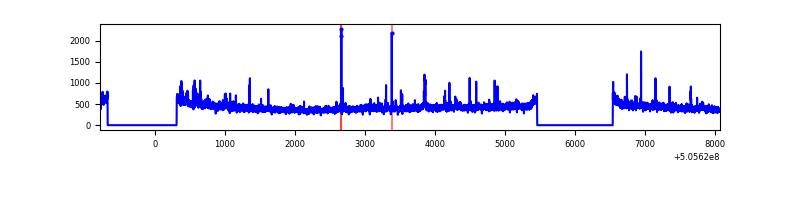 |
| C | 8851 | 6788 | 51 | 51 | 0.58% | 0.75% | 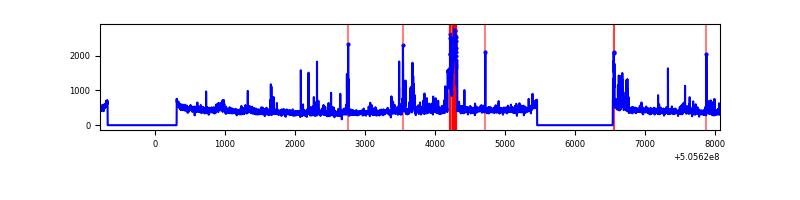 |
| D | 8851 | 6786 | 1120 | 1120 | 12.65% | 16.50% | 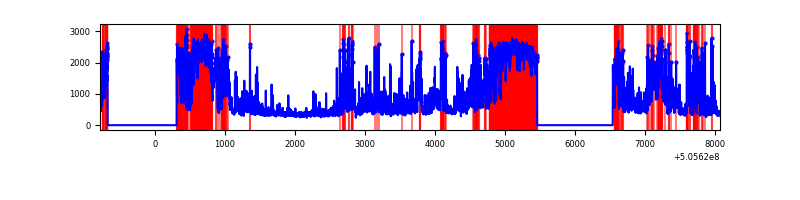 |
Top three noisy pixels from each quadrant. If the there are fewer than three noisy pixels in the level2.evt file, extra rows are filled as -1
| Pixel properties | Quadrant properties | ||||||
|---|---|---|---|---|---|---|---|
| Quadrant | DetID | PixID | Counts | Sigma | Mean | Median | Sigma |
| A | 12 | 115 | 2174964 | 13069.99 | 678 | 659 | 166.4 |
| A | 0 | 8 | 317419 | 1904.08 | 678 | 659 | 166.4 |
| A | 15 | 32 | 251147 | 1505.71 | 678 | 659 | 166.4 |
| B | 5 | 185 | 58608 | 388.08 | 699 | 674 | 149.3 |
| B | 0 | 171 | 38580 | 253.92 | 699 | 674 | 149.3 |
| B | 10 | 247 | 24205 | 157.63 | 699 | 674 | 149.3 |
| C | 6 | 9 | 247270 | 1318.38 | 682 | 673 | 187.0 |
| C | 9 | 38 | 168099 | 895.11 | 682 | 673 | 187.0 |
| C | 12 | 250 | 27094 | 141.25 | 682 | 673 | 187.0 |
| D | 11 | 129 | 3246669 | 18130.1 | 621 | 591 | 179.0 |
| D | 8 | 245 | 868345 | 4846.61 | 621 | 591 | 179.0 |
| D | 15 | 234 | 124303 | 690.96 | 621 | 591 | 179.0 |
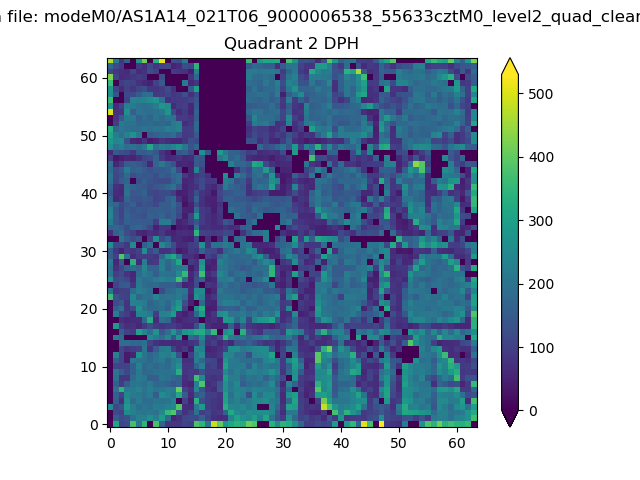
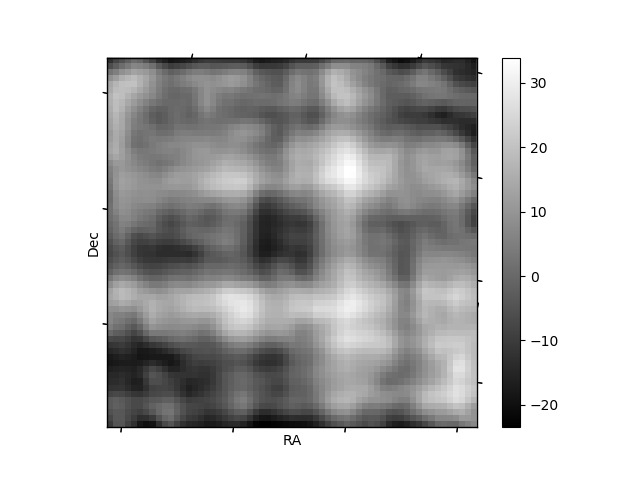
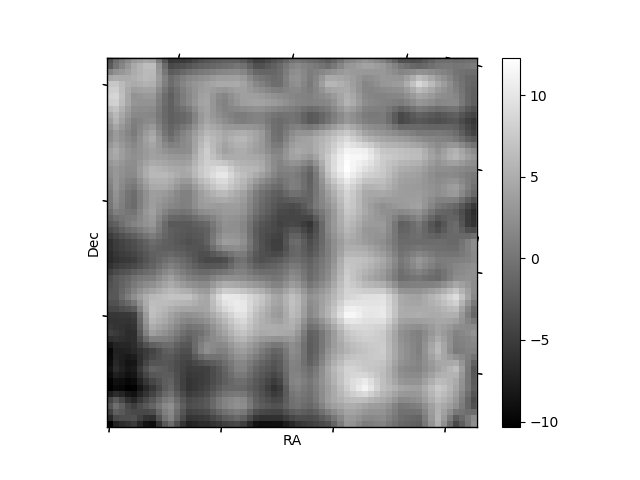
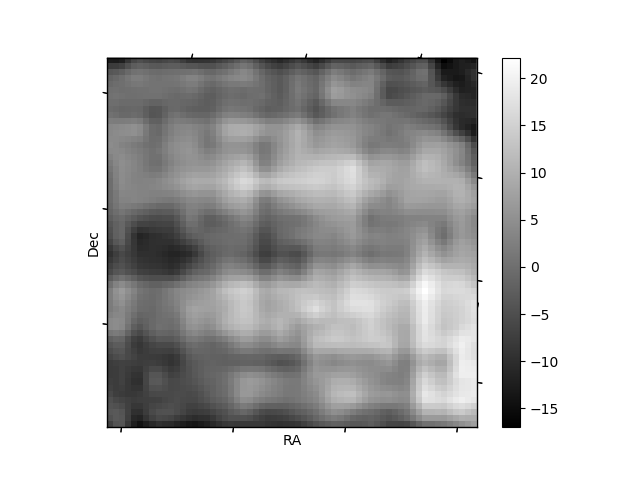
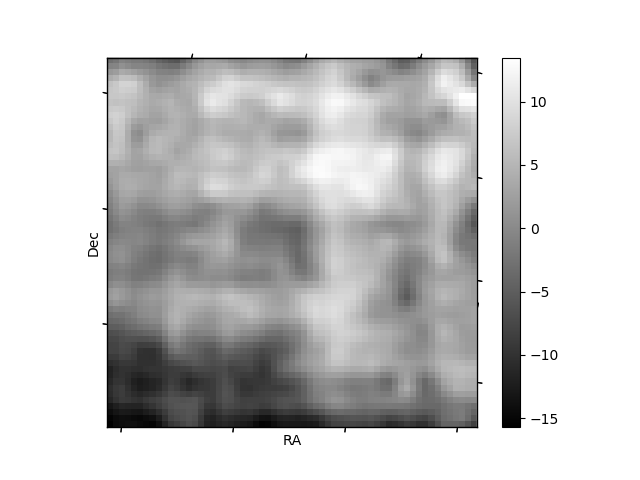
Histogram calculated using DETX and DETY for each event in the final _common_clean file
| Quadrant A | 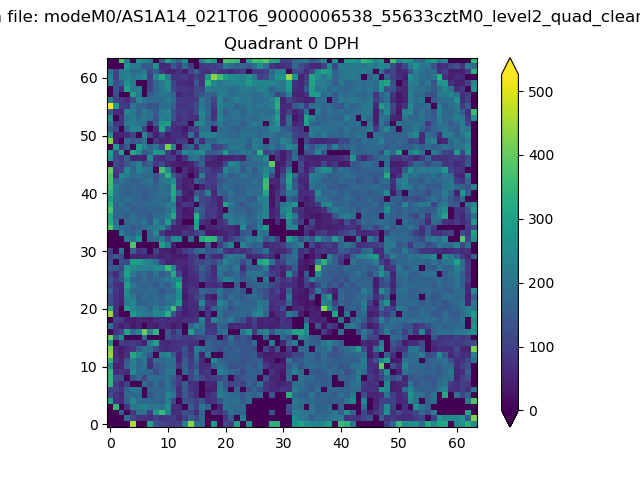 |
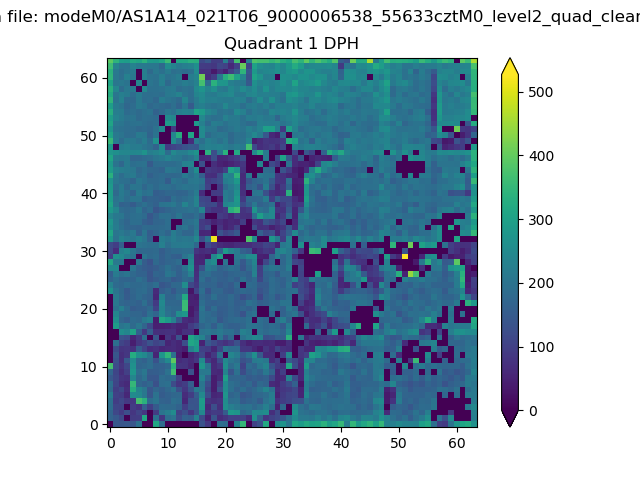 |
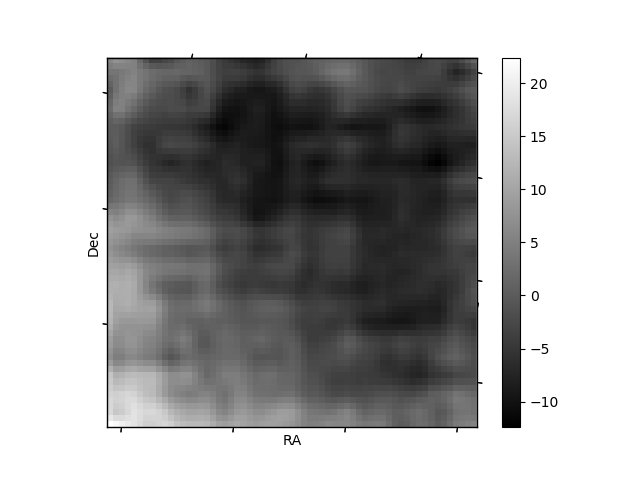
Quadrant B |
|---|---|---|---|
| Quadrant D | 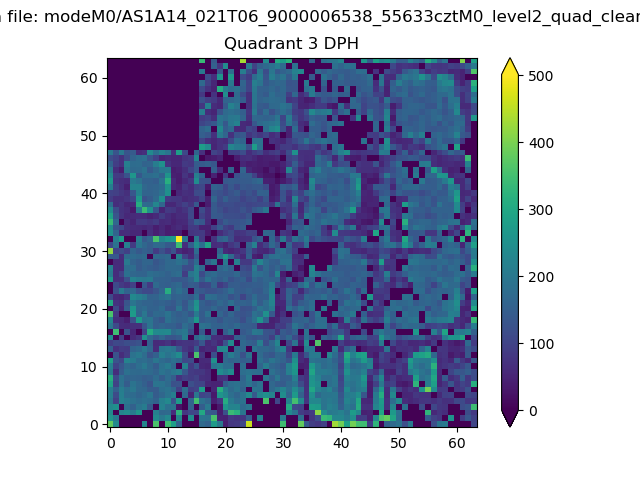 |
 |
Quadrant C |
| Plot type | Count rate plots | Images |
|---|---|---|
| Comparison with Poisson distribution Blue bars denote a histogram of data divided into 1 sec bins. Red curve is a Poisson curve with rate = median count rate of data. |
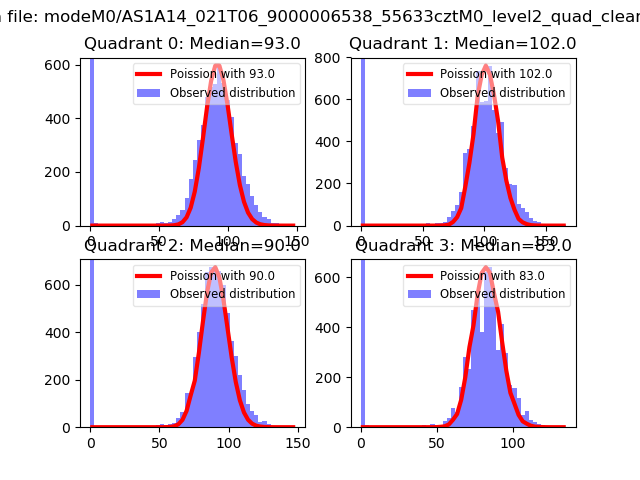 |
 |
| Quadrant-wise count rates Data is divided into 100 sec bins |
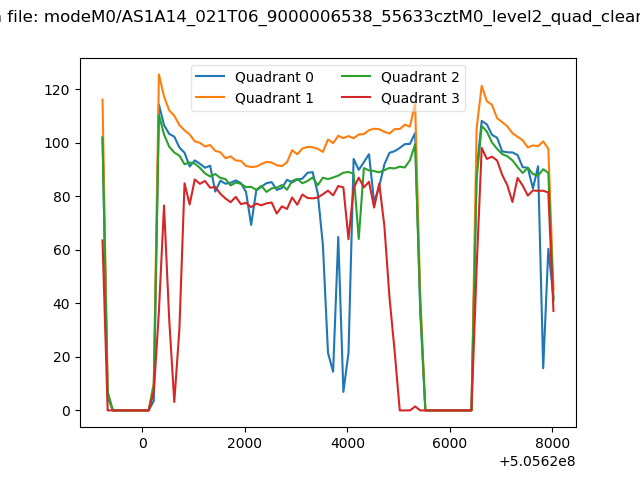 |
|
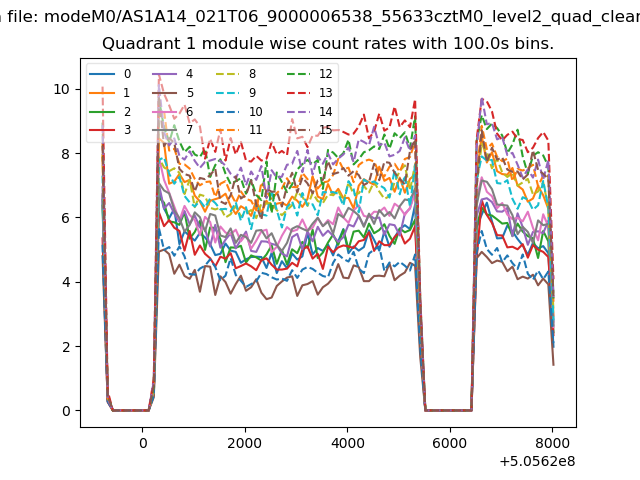
| Module-wise count rates for Quadrant A Data is divided into 100 sec bins |
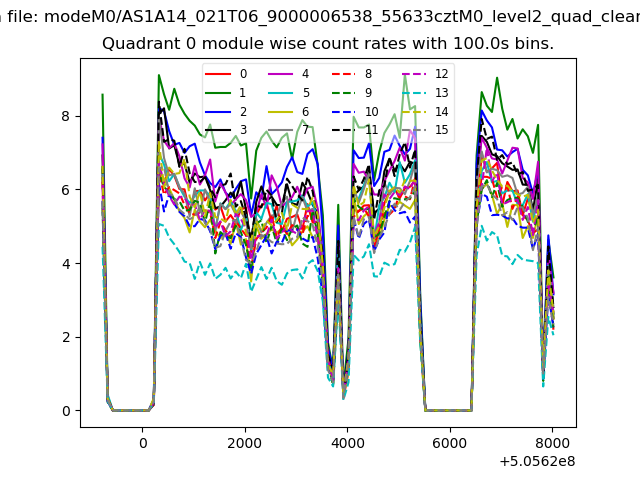 |
 |
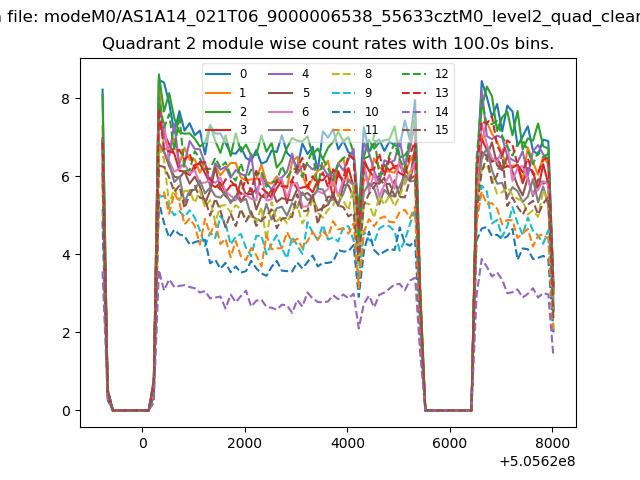
| Module-wise count rates for Quadrant B Data is divided into 100 sec bins |
 |
 |
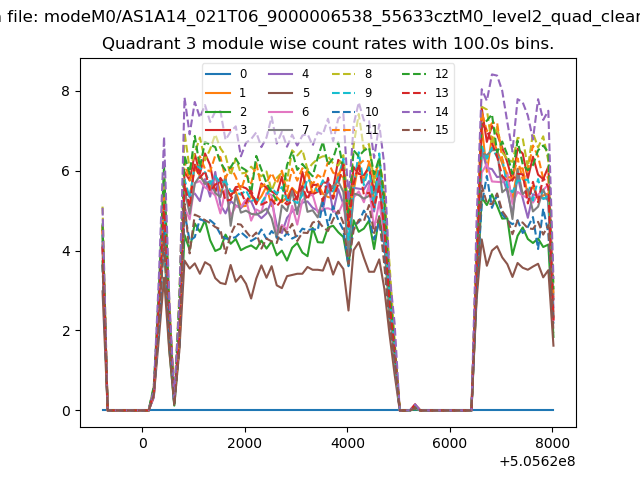
| Module-wise count rates for Quadrant C Data is divided into 100 sec bins |
 |
 |
| Module-wise count rates for Quadrant D Data is divided into 100 sec bins |
 |
 |
| Parameter | Plot |
|---|---|
| CZT HV Monitor | 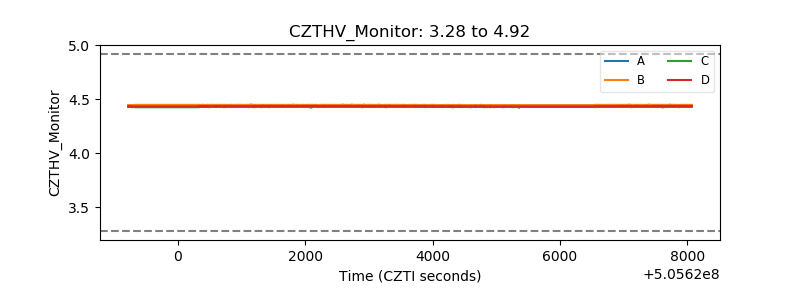 |
| D_VDD | 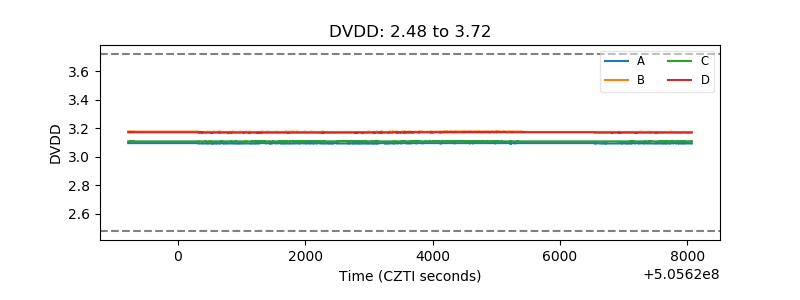 |
| Temperature 1 | 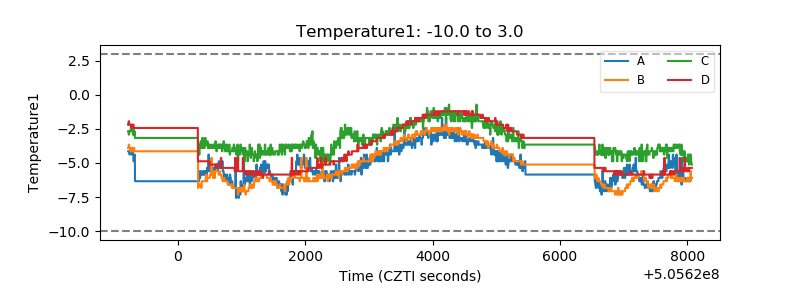 |
| Veto HV Monitor | 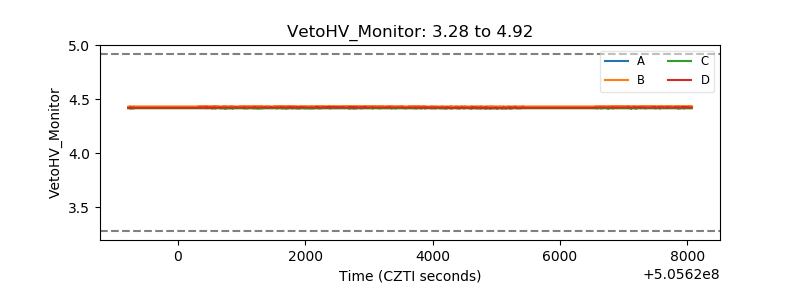 |
| Veto LLD | 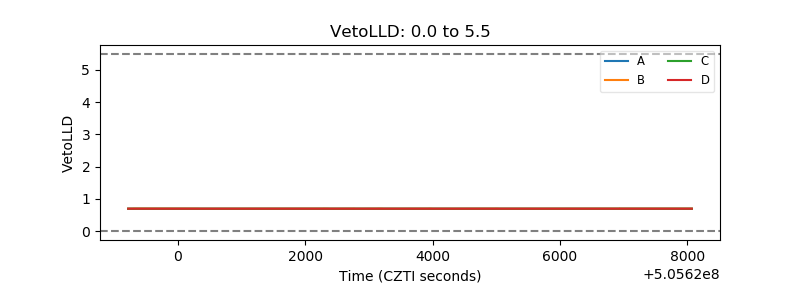 |
| Alpha Counter | 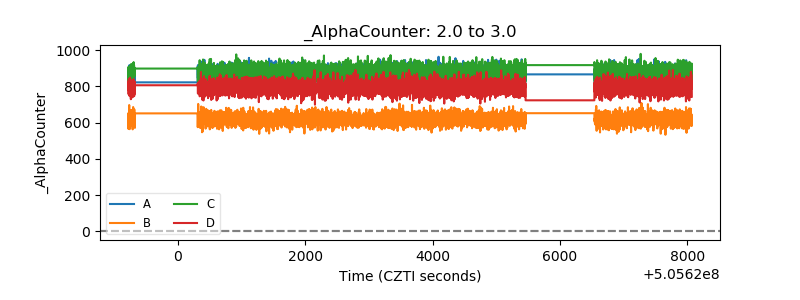 |
| _CPM_Rate | 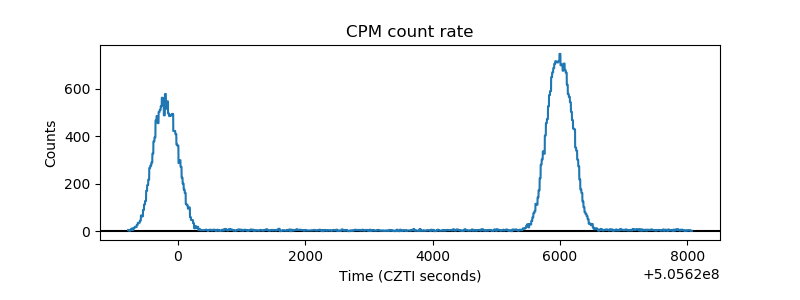 |
| CZT Counter | 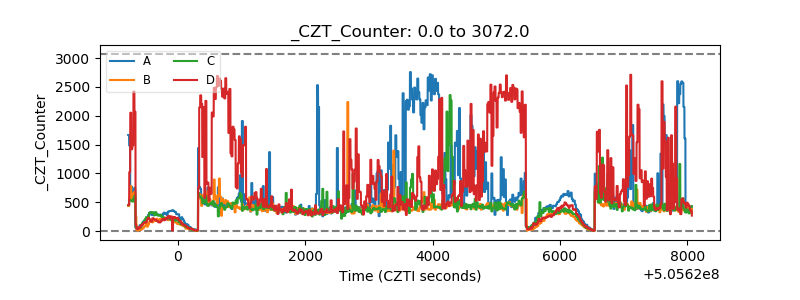 |
| +2.5 Volts monitor | 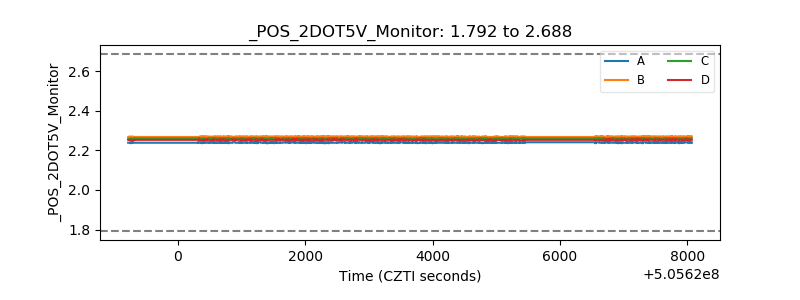 |
| +5 Volts monitor | 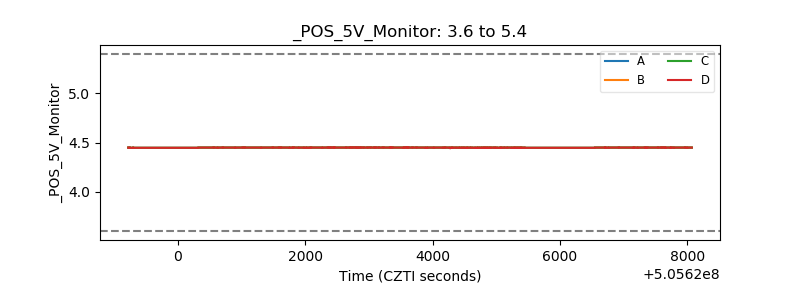 |
| _ROLL_ROT | 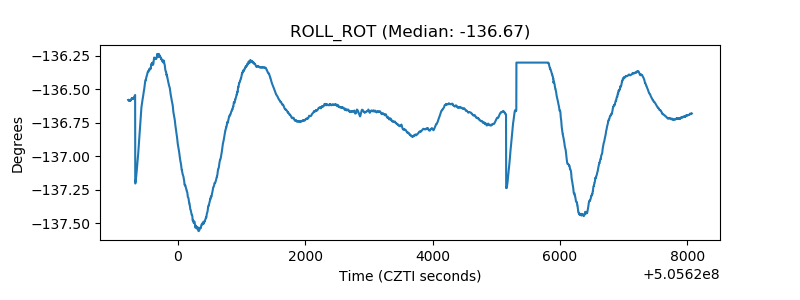 |
| _Roll_DEC | 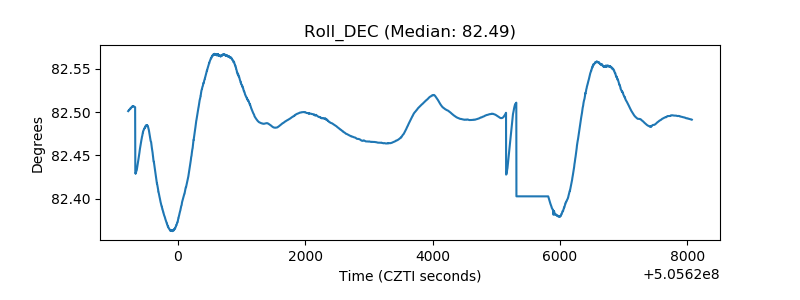 |
| _Roll_RA | 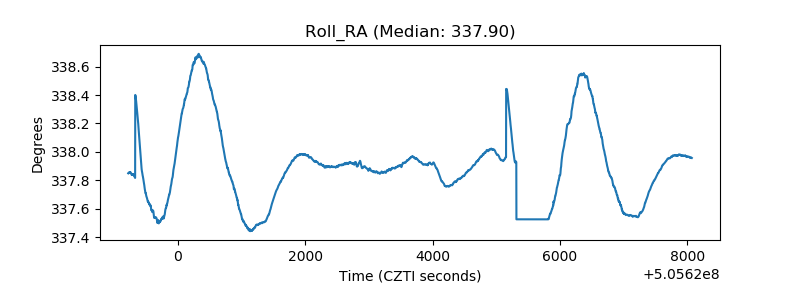 |
| Veto Counter | 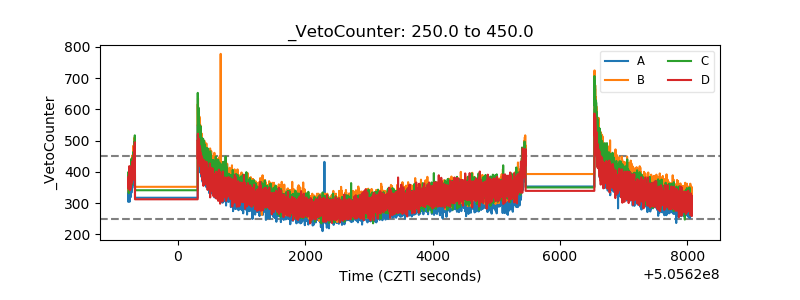 |