| Param | Original file | Final file |
|---|---|---|
| Filename | modeM0/AS1A14_021T06_9000006538_55634cztM0_level2.fits | modeM0/AS1A14_021T06_9000006538_55634cztM0_level2_quad_clean.evt |
| Size (bytes) | 408,464,640 | 94,965,120 |
| Size | 389.5 MB | 90.6 MB |
| Events in quadrant A | 4,265,154 | 606,681 |
| Events in quadrant B | 2,829,182 | 673,924 |
| Events in quadrant C | 2,785,807 | 597,487 |
| Events in quadrant D | 4,732,987 | 542,998 |
| Mode M9 | |||
|---|---|---|---|
| Quadrant | BADHDUFLAG | Total packets | Discarded packets |
| A | 0 | 17 | 0 |
| B | 0 | 18 | 0 |
| C | 0 | 18 | 0 |
| D | 0 | 18 | 0 |
| Mode M0 | |||
|---|---|---|---|
| Quadrant | BADHDUFLAG | Total packets | Discarded packets |
| A | 0 | 17475 | 2 |
| B | 0 | 13484 | 2 |
| C | 0 | 13621 | 2 |
| D | 0 | 18886 | 2 |
| Mode SS | |||
|---|---|---|---|
| Quadrant | BADHDUFLAG | Total packets | Discarded packets |
| A | 0 | 132 | 0 |
| B | 0 | 132 | 0 |
| C | 0 | 132 | 0 |
| D | 0 | 132 | 0 |
| Quadrant | Total seconds | Saturated seconds | Saturation percentage |
|---|---|---|---|
| A | 6516 | 326 | 5.003069% |
| B | 6516 | 81 | 1.243094% |
| C | 6516 | 38 | 0.583180% |
| D | 6516 | 291 | 4.465930% |
Noise dominated data is calculated using 1-second bins in cleaned event files. If a bin has >2000 counts, and if more than 50% of those come from <1% of pixels, then it is considered to be noise-dominated and hence unusable.
| Quadrant | # 1 sec bins | Bins with >0 counts | Bins with >2000 counts | High rate bins dominated by noise | Noise dominated (total time) | Noise dominated (detector-on time) | Marked lightcurve |
|---|---|---|---|---|---|---|---|
| A | 7631 | 6516 | 251 | 251 | 3.29% | 3.85% | 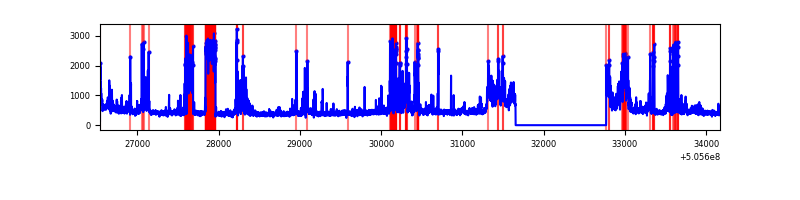 |
| B | 7631 | 6516 | 11 | 11 | 0.14% | 0.17% | 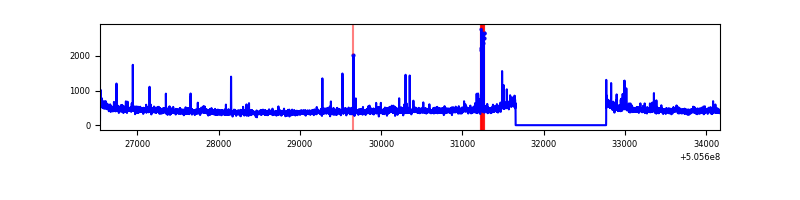 |
| C | 7631 | 6517 | 9 | 9 | 0.12% | 0.14% | 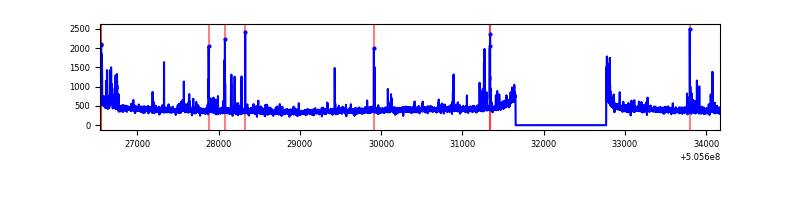 |
| D | 7631 | 6516 | 292 | 292 | 3.83% | 4.48% | 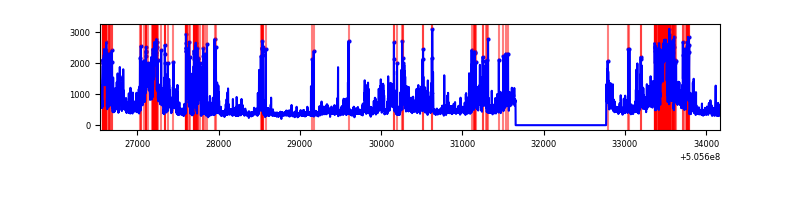 |
Top three noisy pixels from each quadrant. If the there are fewer than three noisy pixels in the level2.evt file, extra rows are filled as -1
| Pixel properties | Quadrant properties | ||||||
|---|---|---|---|---|---|---|---|
| Quadrant | DetID | PixID | Counts | Sigma | Mean | Median | Sigma |
| A | 12 | 115 | 995882 | 5969.25 | 672 | 654 | 166.7 |
| A | 15 | 32 | 300135 | 1796.25 | 672 | 654 | 166.7 |
| A | 0 | 8 | 158225 | 945.09 | 672 | 654 | 166.7 |
| B | 5 | 185 | 65200 | 443.37 | 676 | 651 | 145.6 |
| B | 7 | 252 | 34759 | 234.28 | 676 | 651 | 145.6 |
| B | 10 | 247 | 27154 | 182.04 | 676 | 651 | 145.6 |
| C | 9 | 38 | 85424 | 469.15 | 657 | 649 | 180.7 |
| C | 6 | 223 | 48930 | 267.19 | 657 | 649 | 180.7 |
| C | 12 | 250 | 25426 | 137.11 | 657 | 649 | 180.7 |
| D | 11 | 129 | 1224123 | 6631.03 | 646 | 617 | 184.5 |
| D | 8 | 245 | 640818 | 3469.7 | 646 | 617 | 184.5 |
| D | 15 | 234 | 104945 | 565.43 | 646 | 617 | 184.5 |
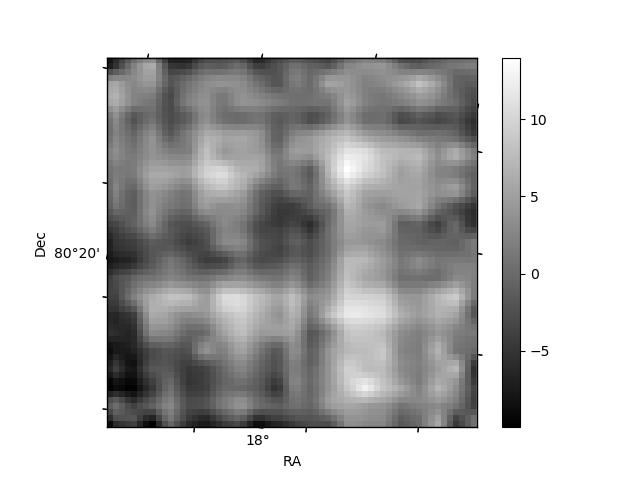
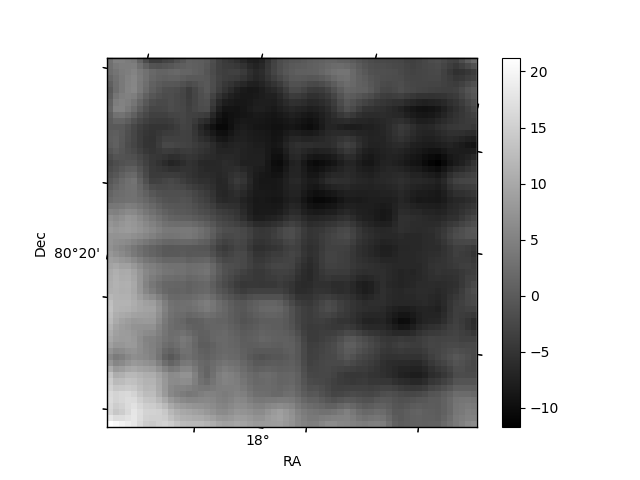
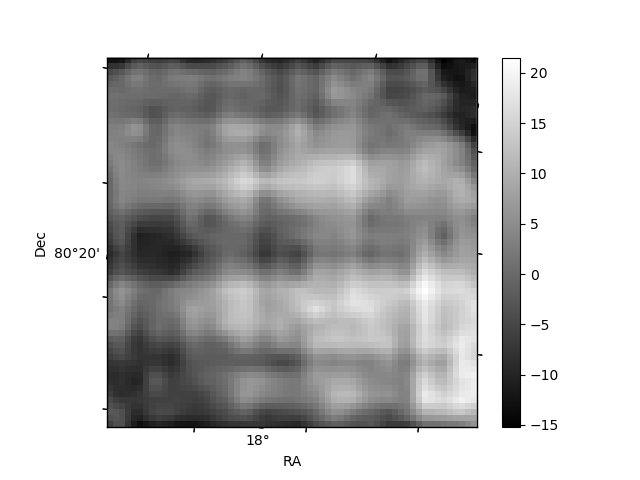
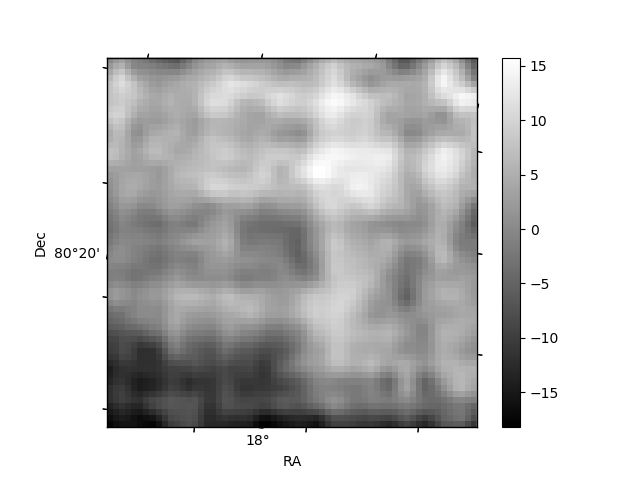
Histogram calculated using DETX and DETY for each event in the final _common_clean file
| Quadrant A | 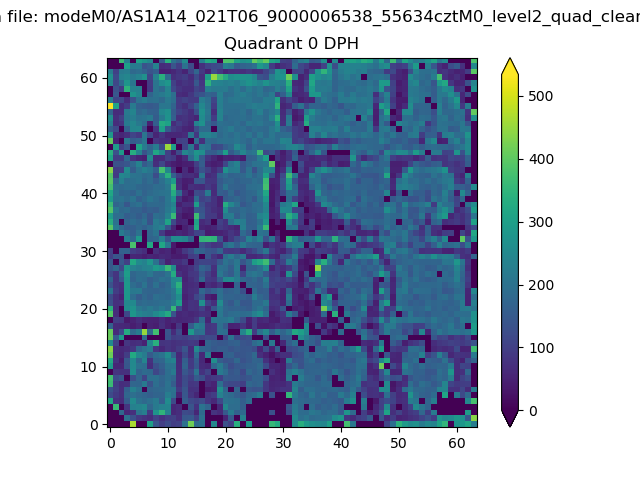 |
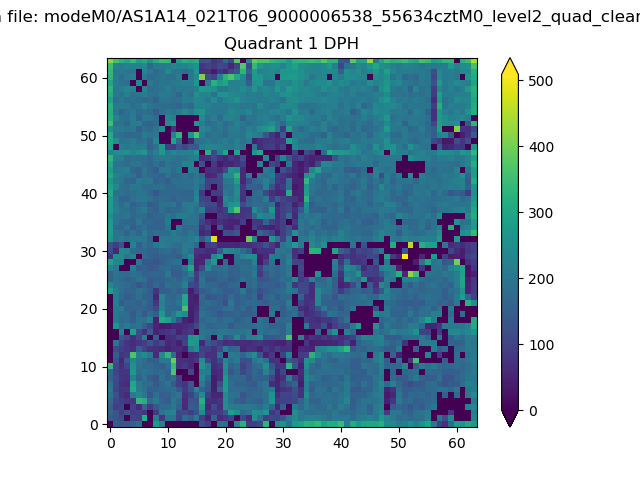 |
Quadrant B |
|---|---|---|---|
| Quadrant D | 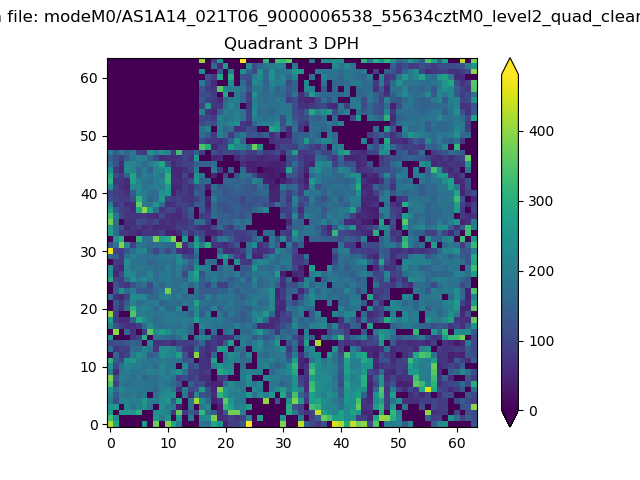 |
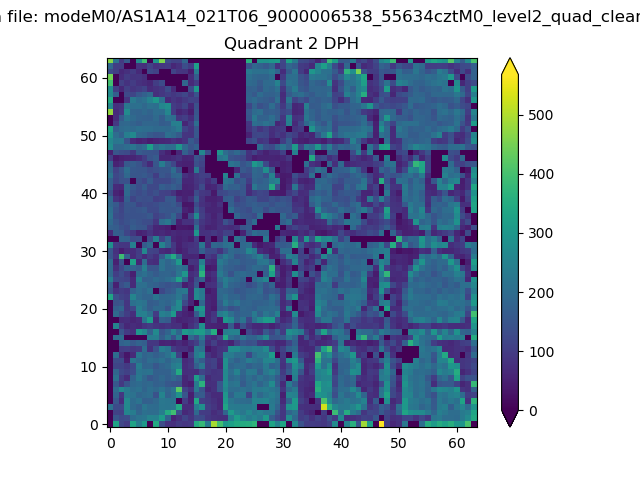 |
Quadrant C |
| Plot type | Count rate plots | Images |
|---|---|---|
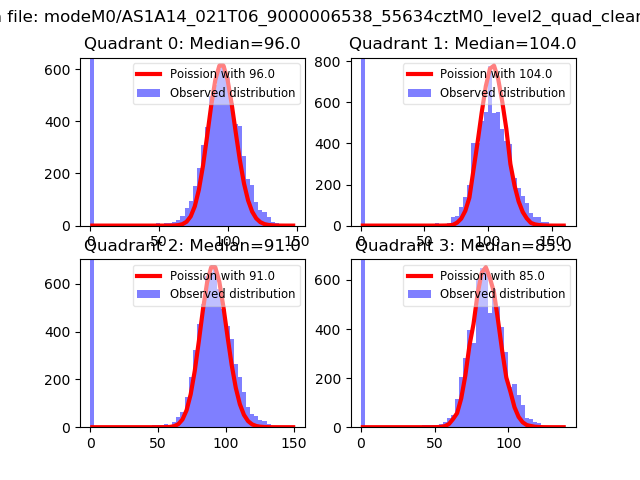
| Comparison with Poisson distribution Blue bars denote a histogram of data divided into 1 sec bins. Red curve is a Poisson curve with rate = median count rate of data. |
 |
 |
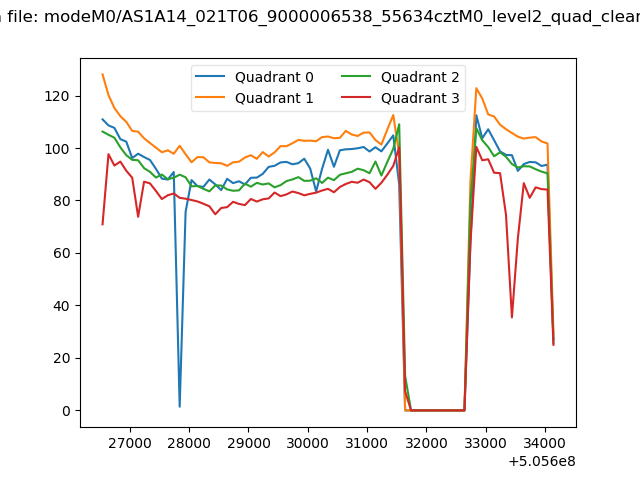
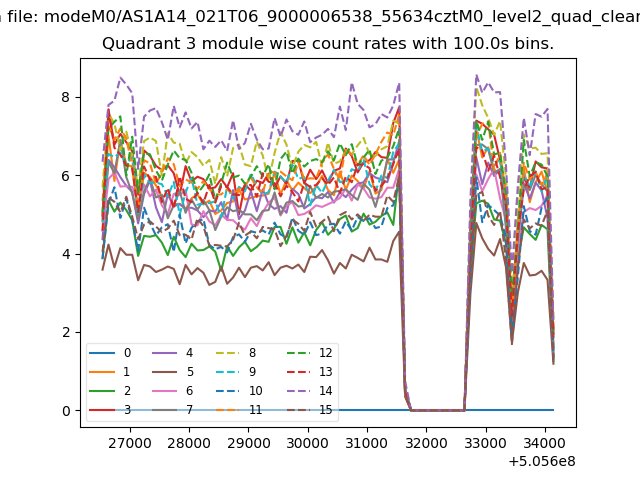
| Quadrant-wise count rates Data is divided into 100 sec bins |
 |
|
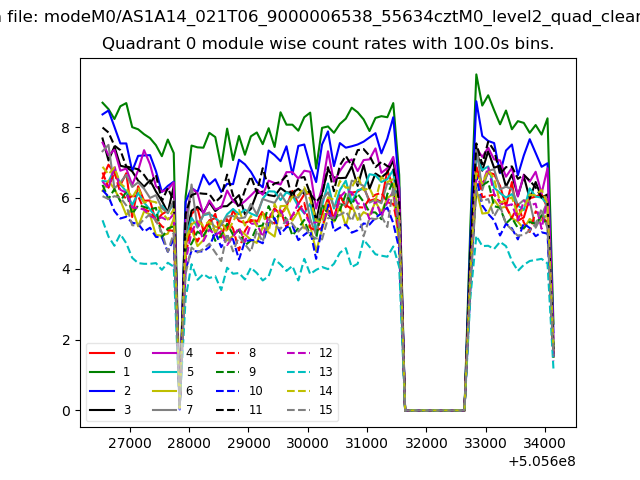
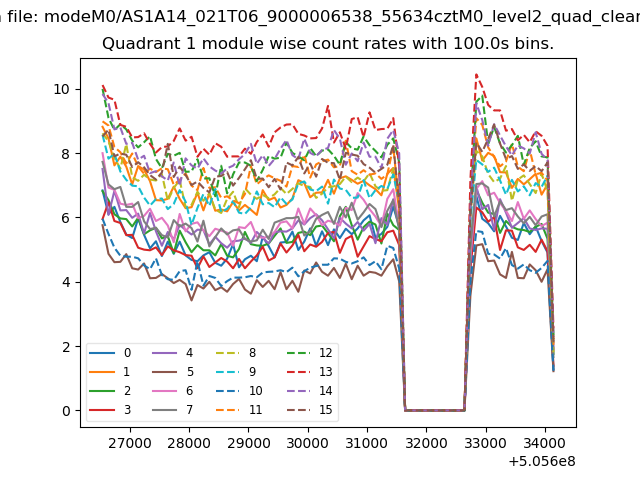
| Module-wise count rates for Quadrant A Data is divided into 100 sec bins |
 |
 |
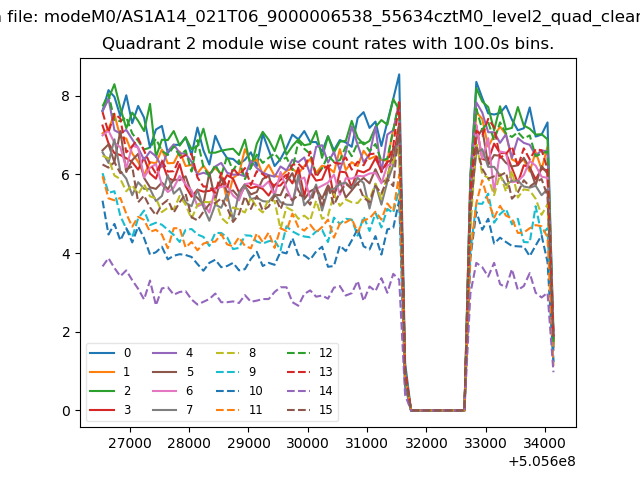
| Module-wise count rates for Quadrant B Data is divided into 100 sec bins |
 |
 |
| Module-wise count rates for Quadrant C Data is divided into 100 sec bins |
 |
 |
| Module-wise count rates for Quadrant D Data is divided into 100 sec bins |
 |
 |
| Parameter | Plot |
|---|---|
| CZT HV Monitor | 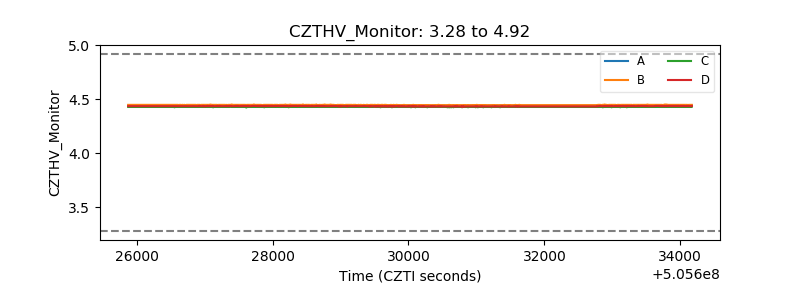 |
| D_VDD | 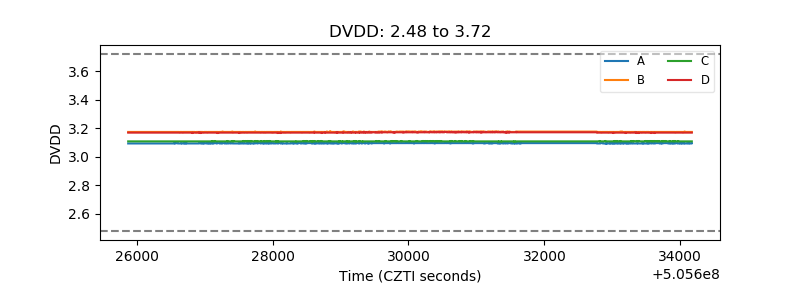 |
| Temperature 1 | 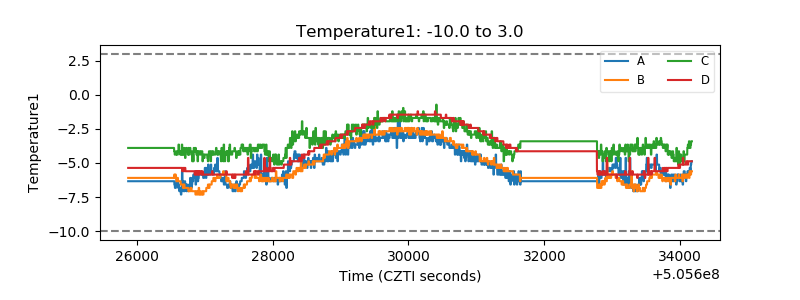 |
| Veto HV Monitor | 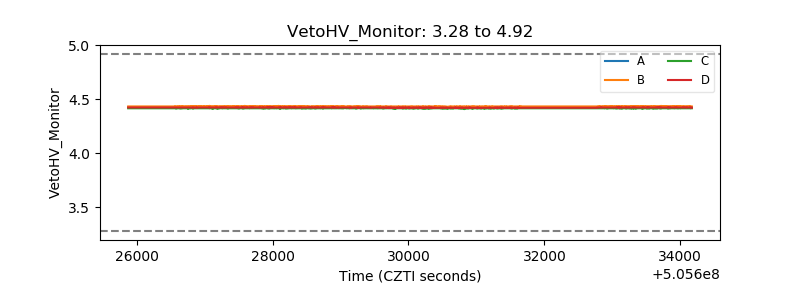 |
| Veto LLD | 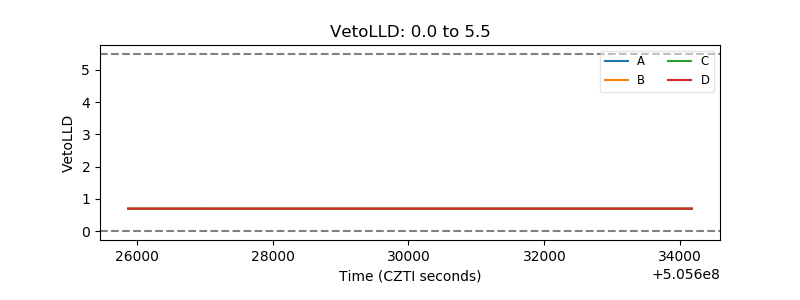 |
| Alpha Counter | 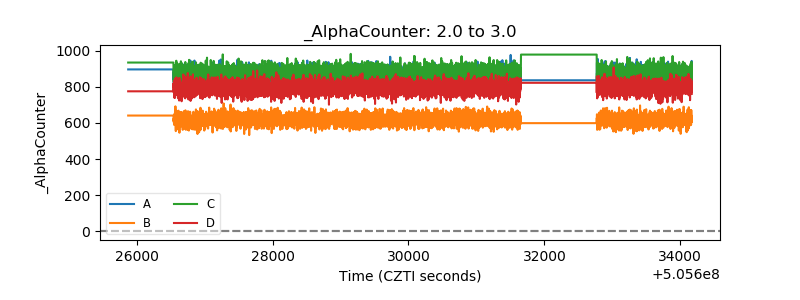 |
| _CPM_Rate | 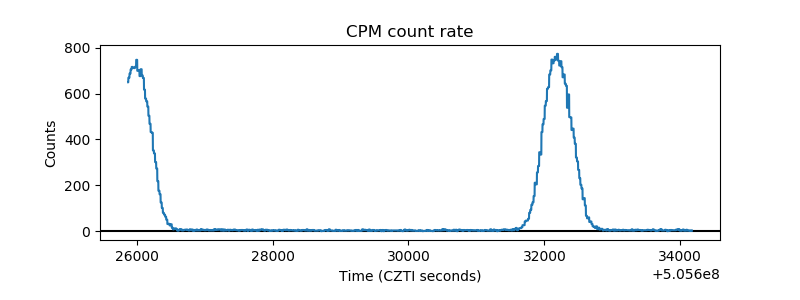 |
| CZT Counter | 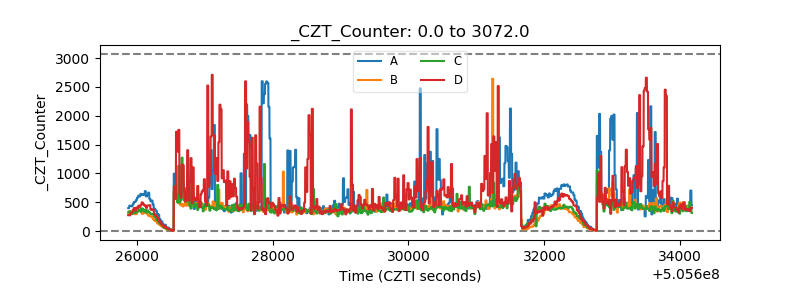 |
| +2.5 Volts monitor |  |
| +5 Volts monitor | 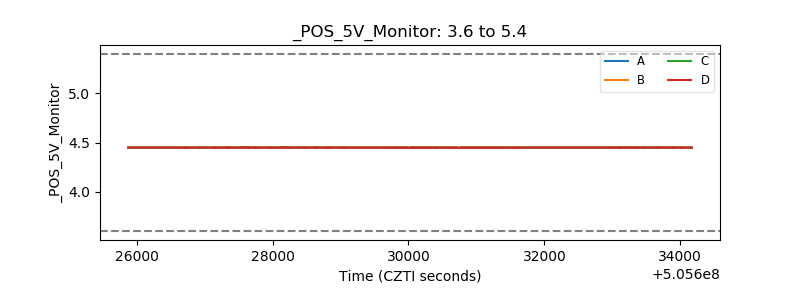 |
| _ROLL_ROT | 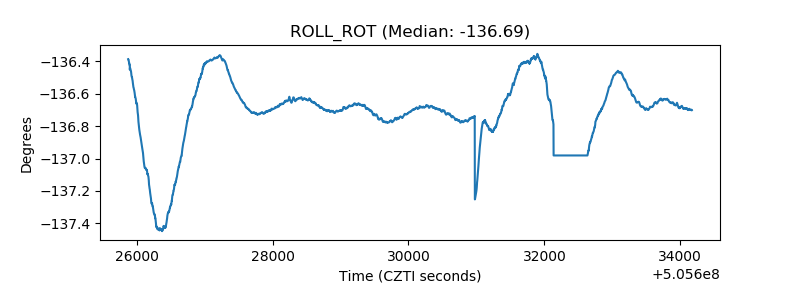 |
| _Roll_DEC | 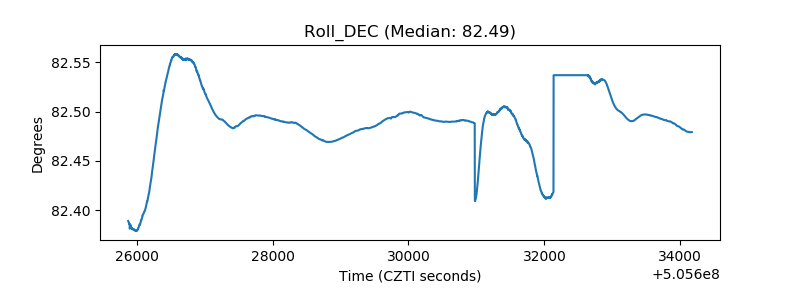 |
| _Roll_RA | 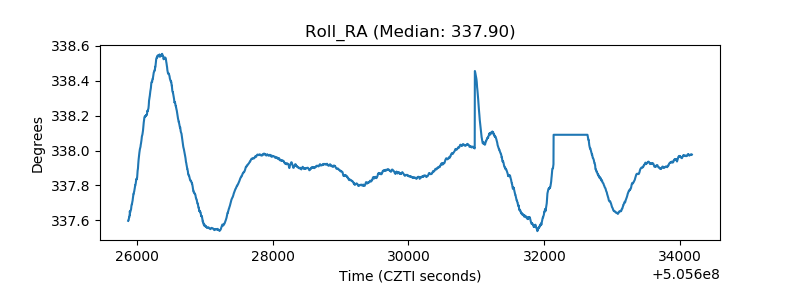 |
| Veto Counter | 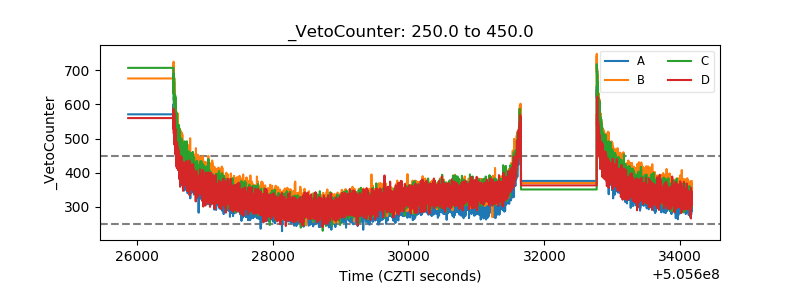 |