| Param | Original file | Final file |
|---|---|---|
| Filename | modeM0/AS1A14_021T06_9000006538_55635cztM0_level2.fits | modeM0/AS1A14_021T06_9000006538_55635cztM0_level2_quad_clean.evt |
| Size (bytes) | 463,452,480 | 91,575,360 |
| Size | 442.0 MB | 87.3 MB |
| Events in quadrant A | 6,866,530 | 499,050 |
| Events in quadrant B | 2,842,564 | 678,602 |
| Events in quadrant C | 2,839,915 | 596,805 |
| Events in quadrant D | 4,099,855 | 544,520 |
| Mode M9 | |||
|---|---|---|---|
| Quadrant | BADHDUFLAG | Total packets | Discarded packets |
| A | 0 | 12 | 0 |
| B | 0 | 13 | 0 |
| C | 0 | 13 | 0 |
| D | 0 | 13 | 0 |
| Mode M0 | |||
|---|---|---|---|
| Quadrant | BADHDUFLAG | Total packets | Discarded packets |
| A | 0 | 25107 | 2 |
| B | 0 | 13435 | 2 |
| C | 0 | 13737 | 2 |
| D | 0 | 16934 | 2 |
| Mode SS | |||
|---|---|---|---|
| Quadrant | BADHDUFLAG | Total packets | Discarded packets |
| A | 0 | 132 | 0 |
| B | 0 | 132 | 0 |
| C | 0 | 132 | 0 |
| D | 0 | 132 | 0 |
| Quadrant | Total seconds | Saturated seconds | Saturation percentage |
|---|---|---|---|
| A | 6508 | 1474 | 22.649047% |
| B | 6508 | 83 | 1.275353% |
| C | 6507 | 49 | 0.753035% |
| D | 6507 | 288 | 4.426003% |
Noise dominated data is calculated using 1-second bins in cleaned event files. If a bin has >2000 counts, and if more than 50% of those come from <1% of pixels, then it is considered to be noise-dominated and hence unusable.
| Quadrant | # 1 sec bins | Bins with >0 counts | Bins with >2000 counts | High rate bins dominated by noise | Noise dominated (total time) | Noise dominated (detector-on time) | Marked lightcurve |
|---|---|---|---|---|---|---|---|
| A | 7653 | 6508 | 1385 | 1385 | 18.10% | 21.28% | 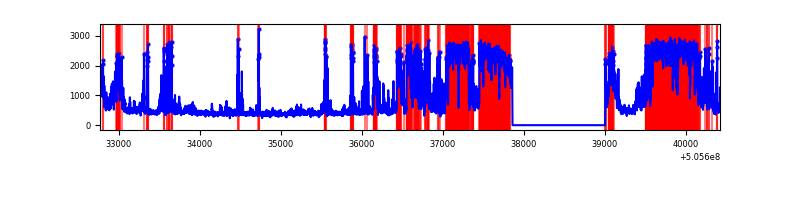 |
| B | 7653 | 6508 | 4 | 4 | 0.05% | 0.06% | 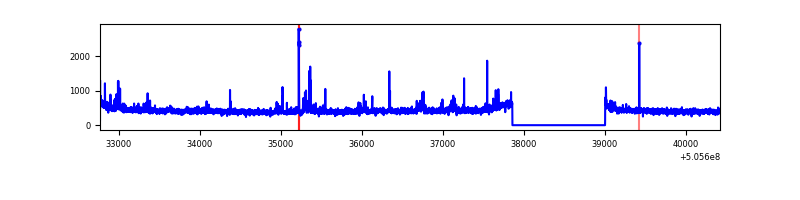 |
| C | 7652 | 6507 | 21 | 21 | 0.27% | 0.32% | 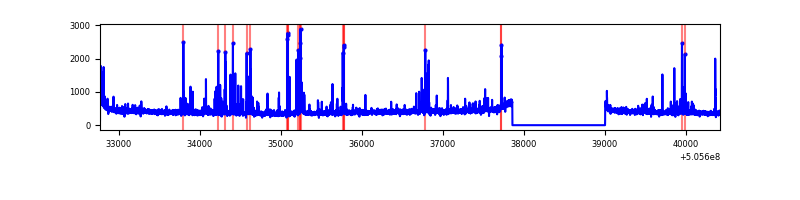 |
| D | 7652 | 6507 | 227 | 227 | 2.97% | 3.49% | 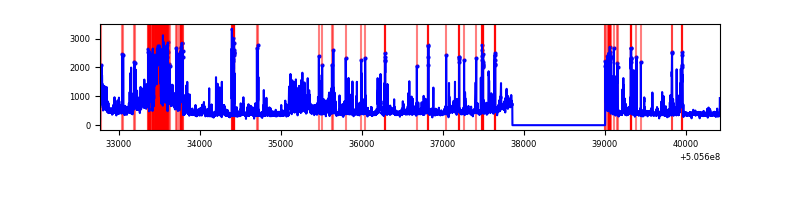 |
Top three noisy pixels from each quadrant. If the there are fewer than three noisy pixels in the level2.evt file, extra rows are filled as -1
| Pixel properties | Quadrant properties | ||||||
|---|---|---|---|---|---|---|---|
| Quadrant | DetID | PixID | Counts | Sigma | Mean | Median | Sigma |
| A | 12 | 115 | 3804493 | 24538.5 | 624 | 609 | 155.0 |
| A | 15 | 32 | 194948 | 1253.66 | 624 | 609 | 155.0 |
| A | 8 | 249 | 130697 | 839.19 | 624 | 609 | 155.0 |
| B | 5 | 185 | 114752 | 785.84 | 676 | 651 | 145.2 |
| B | 12 | 111 | 17478 | 115.89 | 676 | 651 | 145.2 |
| B | 11 | 111 | 16227 | 107.28 | 676 | 651 | 145.2 |
| C | 13 | 3 | 133883 | 739.84 | 654 | 648 | 180.1 |
| C | 6 | 223 | 55903 | 306.83 | 654 | 648 | 180.1 |
| C | 12 | 250 | 41218 | 225.28 | 654 | 648 | 180.1 |
| D | 11 | 129 | 946860 | 5131.76 | 646 | 616 | 184.4 |
| D | 10 | 181 | 178924 | 967.02 | 646 | 616 | 184.4 |
| D | 15 | 234 | 129523 | 699.1 | 646 | 616 | 184.4 |
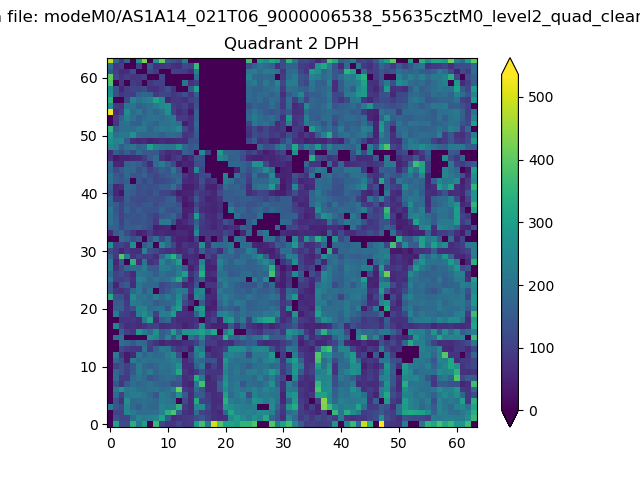
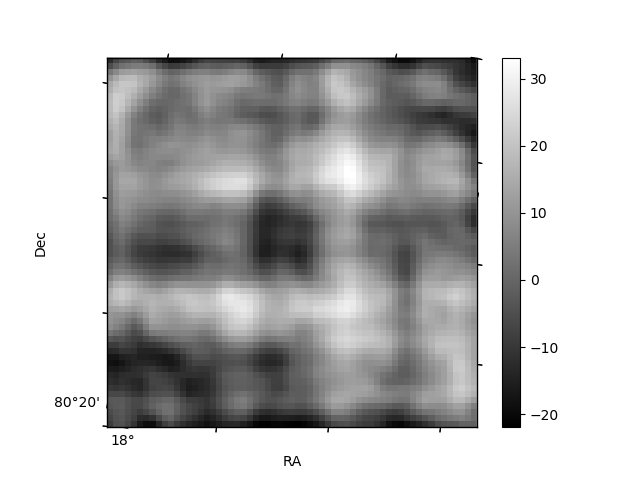
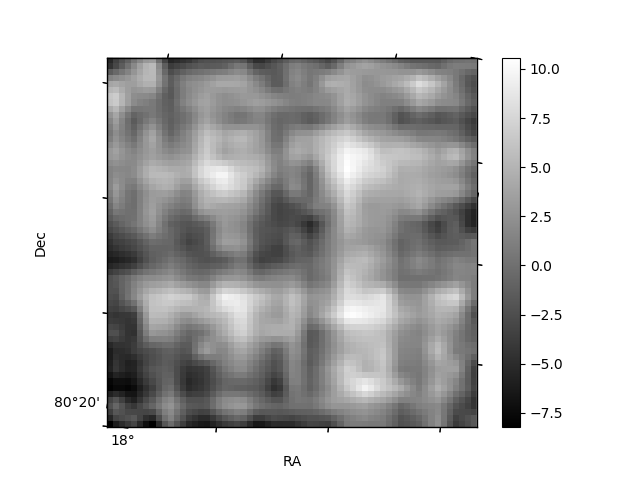
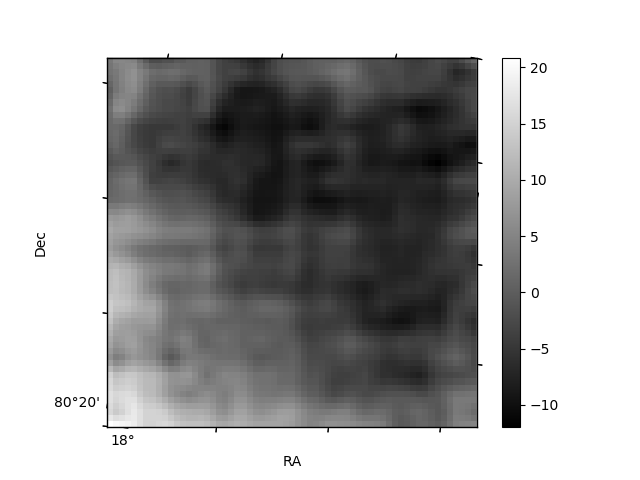
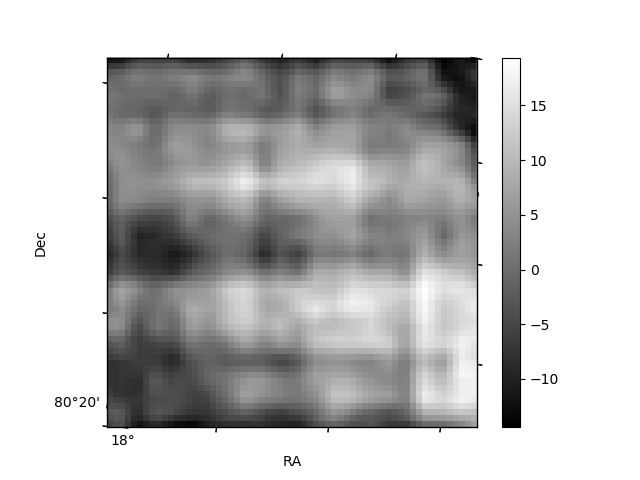
Histogram calculated using DETX and DETY for each event in the final _common_clean file
| Quadrant A | 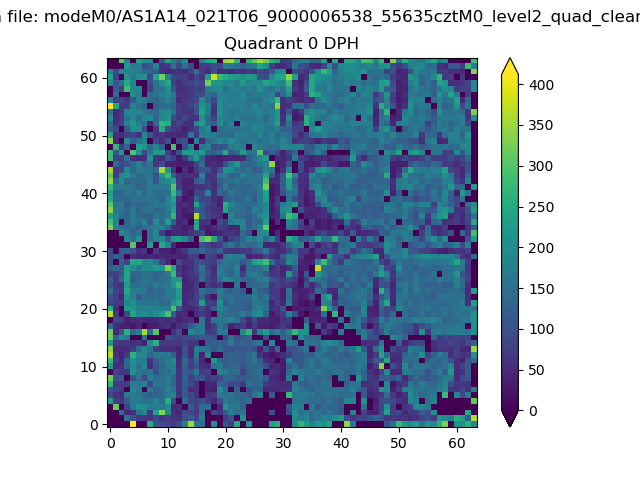 |
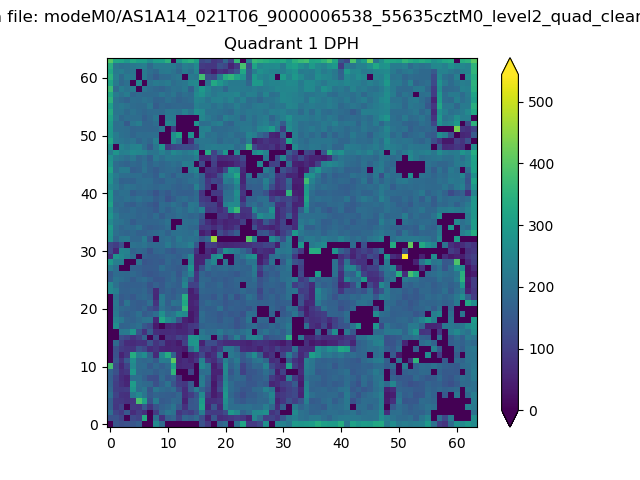 |
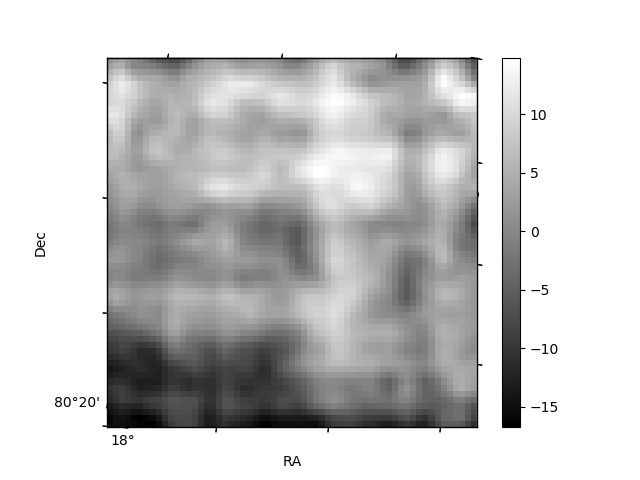
Quadrant B |
|---|---|---|---|
| Quadrant D | 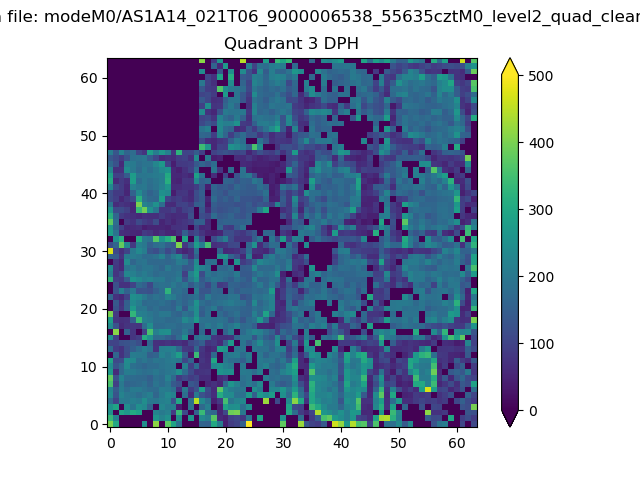 |
 |
Quadrant C |
| Plot type | Count rate plots | Images |
|---|---|---|
| Comparison with Poisson distribution Blue bars denote a histogram of data divided into 1 sec bins. Red curve is a Poisson curve with rate = median count rate of data. |
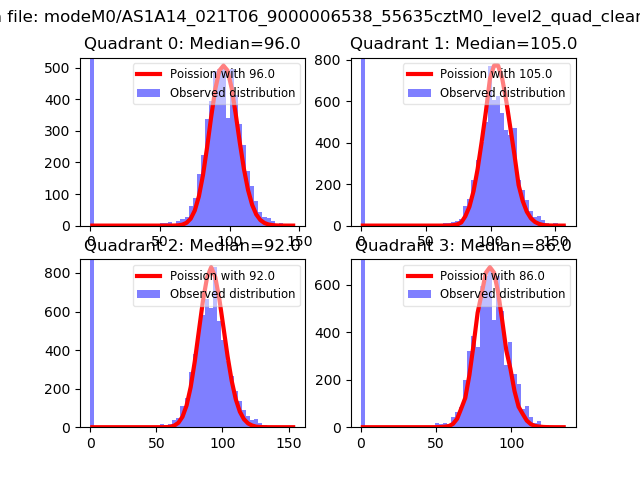 |
 |
| Quadrant-wise count rates Data is divided into 100 sec bins |
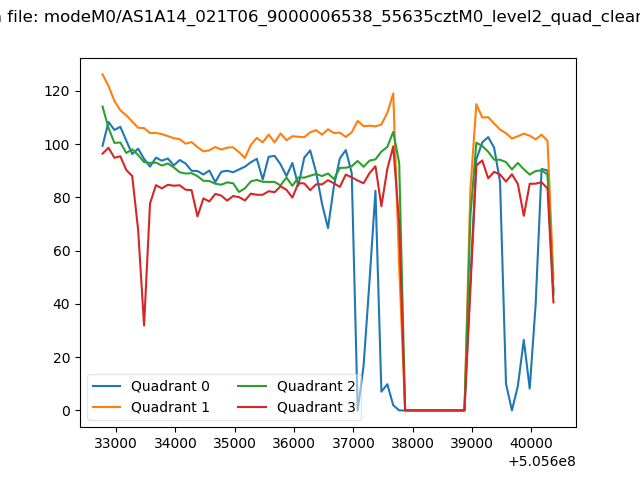 |
|
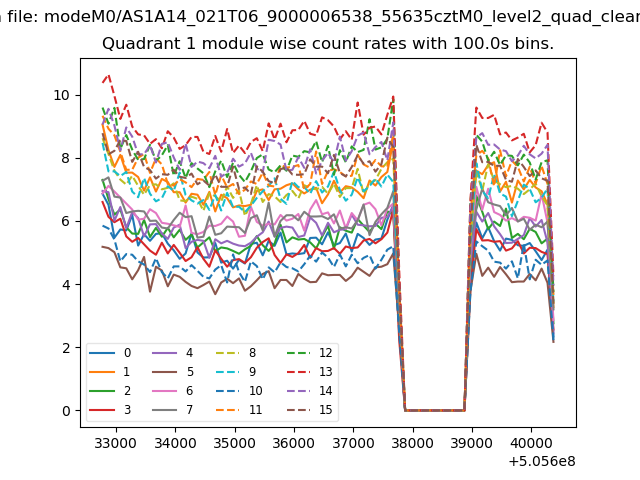
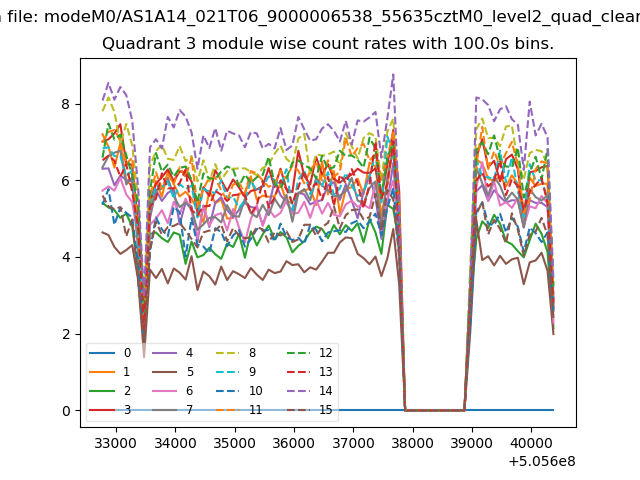
| Module-wise count rates for Quadrant A Data is divided into 100 sec bins |
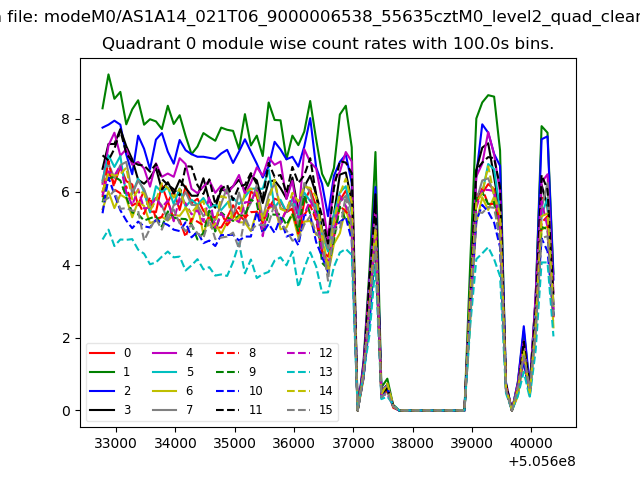 |
 |
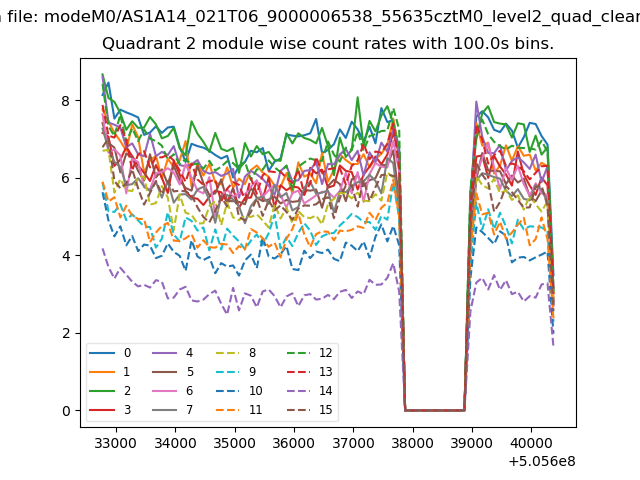
| Module-wise count rates for Quadrant B Data is divided into 100 sec bins |
 |
 |
| Module-wise count rates for Quadrant C Data is divided into 100 sec bins |
 |
 |
| Module-wise count rates for Quadrant D Data is divided into 100 sec bins |
 |
 |
| Parameter | Plot |
|---|---|
| CZT HV Monitor | 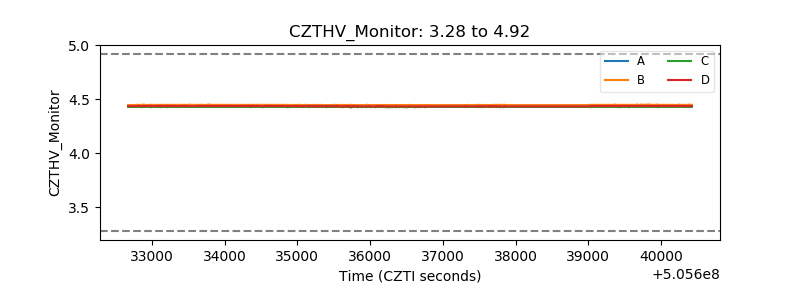 |
| D_VDD | 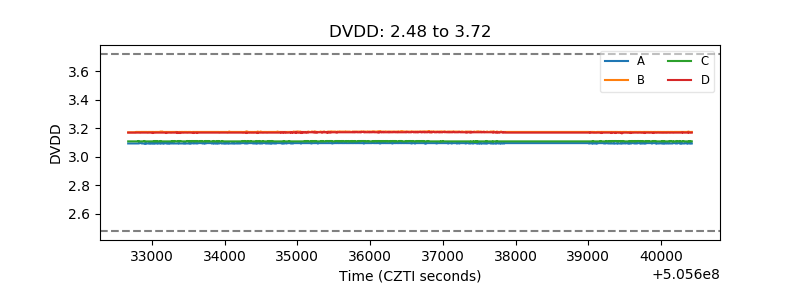 |
| Temperature 1 | 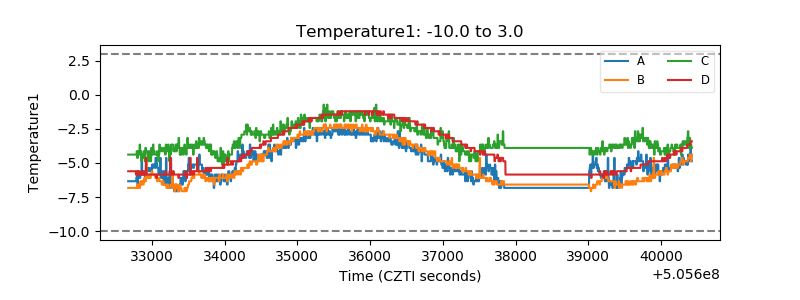 |
| Veto HV Monitor | 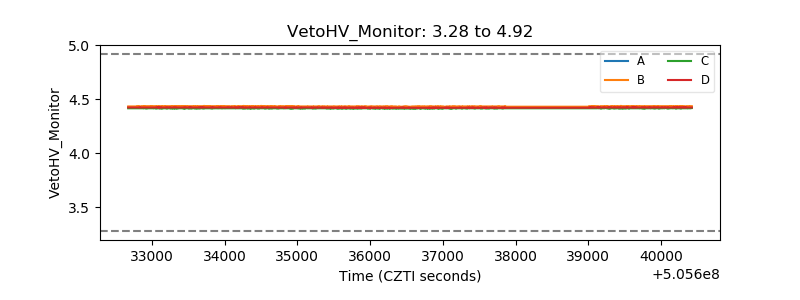 |
| Veto LLD | 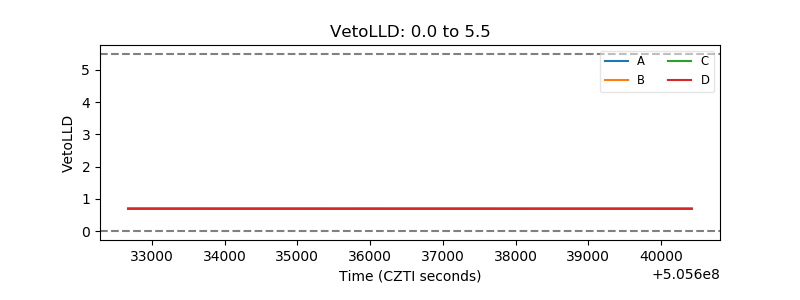 |
| Alpha Counter | 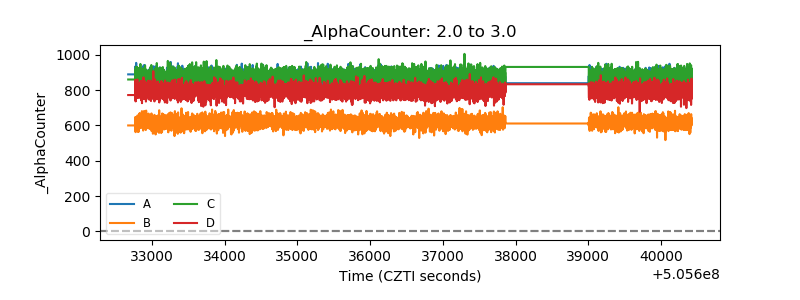 |
| _CPM_Rate | 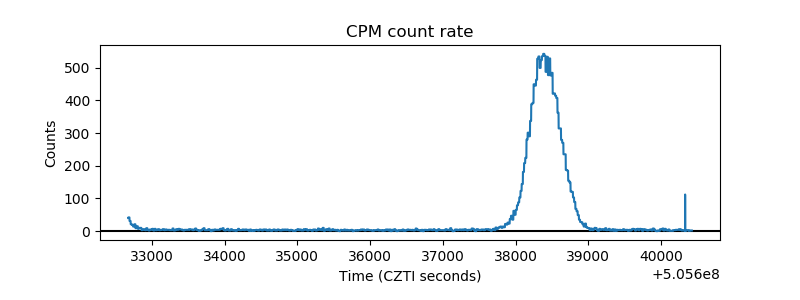 |
| CZT Counter | 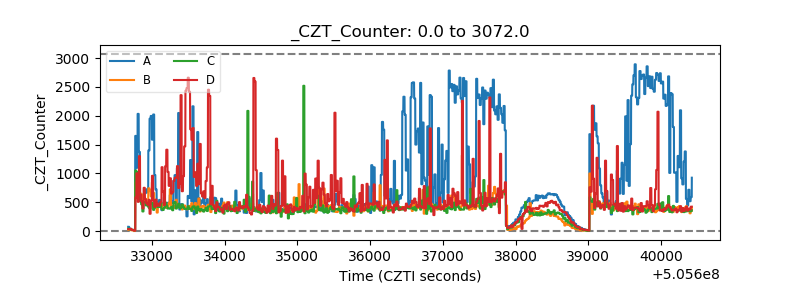 |
| +2.5 Volts monitor | 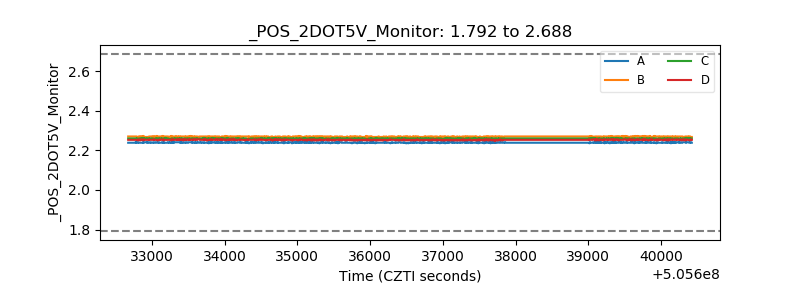 |
| +5 Volts monitor | 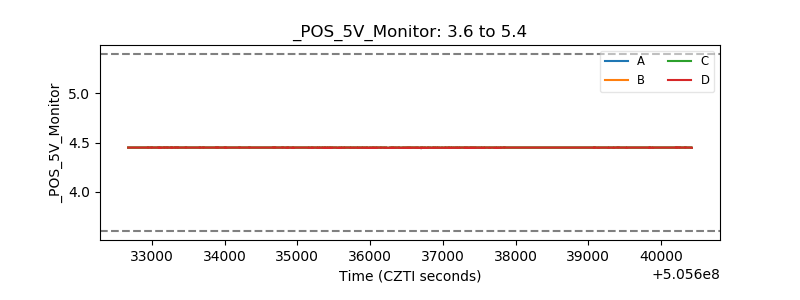 |
| _ROLL_ROT | 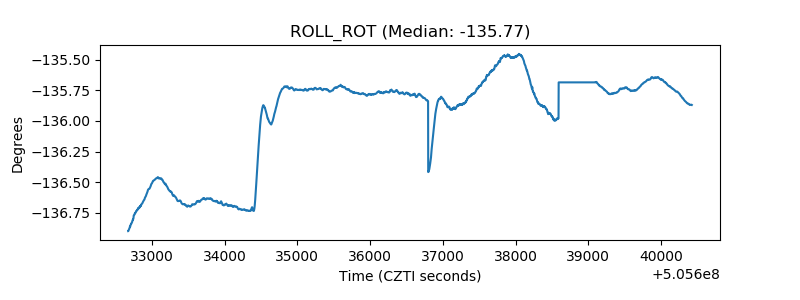 |
| _Roll_DEC | 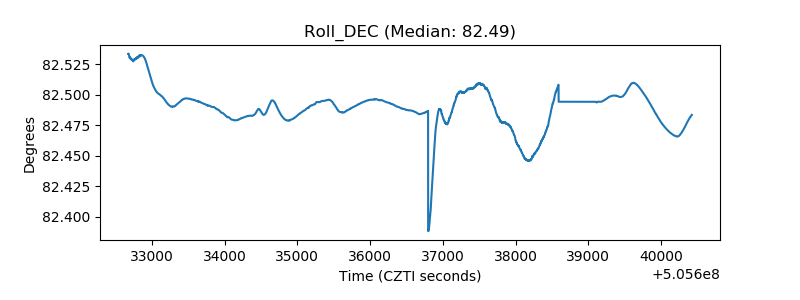 |
| _Roll_RA | 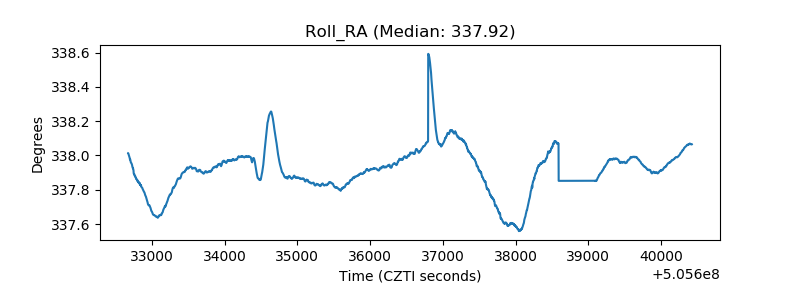 |
| Veto Counter | 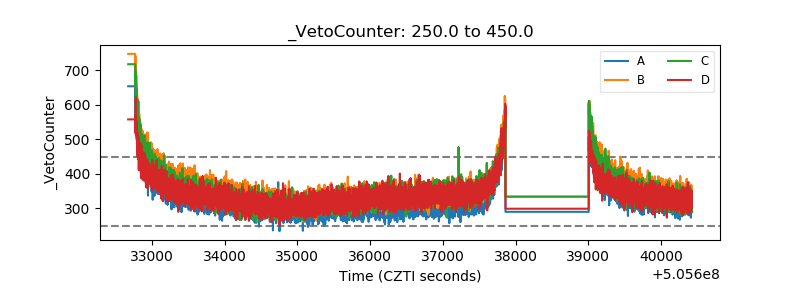 |