| Param | Original file | Final file |
|---|---|---|
| Filename | modeM0/AS1A14_021T06_9000006538_55636cztM0_level2.fits | modeM0/AS1A14_021T06_9000006538_55636cztM0_level2_quad_clean.evt |
| Size (bytes) | 458,472,960 | 91,765,440 |
| Size | 437.2 MB | 87.5 MB |
| Events in quadrant A | 6,505,878 | 535,467 |
| Events in quadrant B | 2,721,693 | 671,120 |
| Events in quadrant C | 2,927,274 | 587,036 |
| Events in quadrant D | 4,310,271 | 531,460 |
| Mode M9 | |||
|---|---|---|---|
| Quadrant | BADHDUFLAG | Total packets | Discarded packets |
| A | 0 | 10 | 0 |
| B | 0 | 10 | 0 |
| C | 0 | 10 | 0 |
| D | 0 | 10 | 0 |
| Mode M0 | |||
|---|---|---|---|
| Quadrant | BADHDUFLAG | Total packets | Discarded packets |
| A | 0 | 23818 | 1 |
| B | 0 | 13257 | 1 |
| C | 0 | 13962 | 1 |
| D | 0 | 17603 | 1 |
| Mode SS | |||
|---|---|---|---|
| Quadrant | BADHDUFLAG | Total packets | Discarded packets |
| A | 0 | 132 | 0 |
| B | 0 | 132 | 0 |
| C | 0 | 132 | 0 |
| D | 0 | 132 | 0 |
| Quadrant | Total seconds | Saturated seconds | Saturation percentage |
|---|---|---|---|
| A | 6504 | 1058 | 16.266913% |
| B | 6505 | 67 | 1.029977% |
| C | 6504 | 44 | 0.676507% |
| D | 6504 | 347 | 5.335178% |
Noise dominated data is calculated using 1-second bins in cleaned event files. If a bin has >2000 counts, and if more than 50% of those come from <1% of pixels, then it is considered to be noise-dominated and hence unusable.
| Quadrant | # 1 sec bins | Bins with >0 counts | Bins with >2000 counts | High rate bins dominated by noise | Noise dominated (total time) | Noise dominated (detector-on time) | Marked lightcurve |
|---|---|---|---|---|---|---|---|
| A | 7554 | 6504 | 998 | 998 | 13.21% | 15.34% | 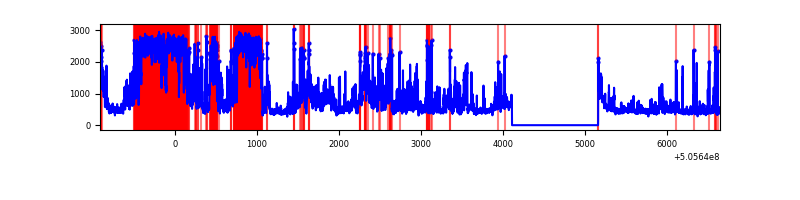 |
| B | 7555 | 6506 | 3 | 3 | 0.04% | 0.05% | 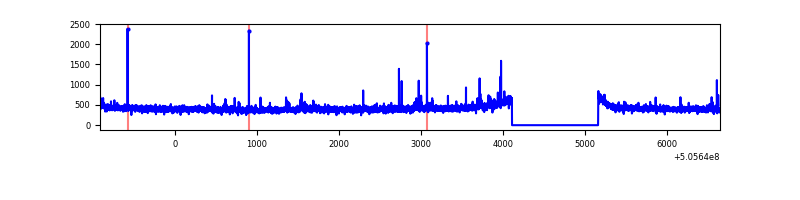 |
| C | 7554 | 6505 | 33 | 33 | 0.44% | 0.51% | 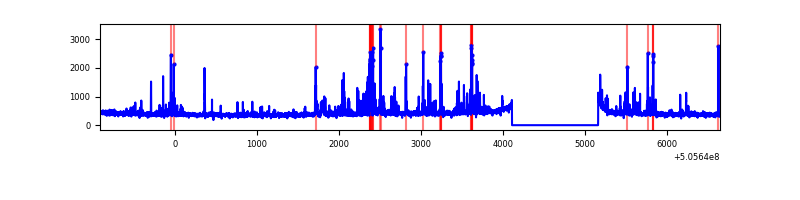 |
| D | 7554 | 6505 | 285 | 285 | 3.77% | 4.38% | 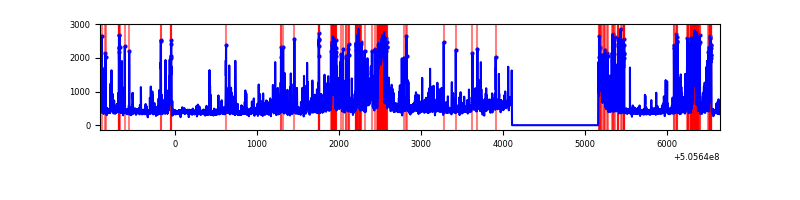 |
Top three noisy pixels from each quadrant. If the there are fewer than three noisy pixels in the level2.evt file, extra rows are filled as -1
| Pixel properties | Quadrant properties | ||||||
|---|---|---|---|---|---|---|---|
| Quadrant | DetID | PixID | Counts | Sigma | Mean | Median | Sigma |
| A | 12 | 115 | 3283446 | 20717.23 | 638 | 621 | 158.5 |
| A | 8 | 249 | 245799 | 1547.27 | 638 | 621 | 158.5 |
| A | 15 | 32 | 231514 | 1457.12 | 638 | 621 | 158.5 |
| B | 10 | 247 | 28520 | 194.69 | 669 | 644 | 143.2 |
| B | 5 | 185 | 23386 | 158.83 | 669 | 644 | 143.2 |
| B | 12 | 111 | 17103 | 114.95 | 669 | 644 | 143.2 |
| C | 13 | 3 | 218283 | 1225.52 | 648 | 643 | 177.6 |
| C | 6 | 223 | 68318 | 381.07 | 648 | 643 | 177.6 |
| C | 12 | 250 | 55987 | 311.64 | 648 | 643 | 177.6 |
| D | 11 | 129 | 861156 | 4725.05 | 636 | 606 | 182.1 |
| D | 15 | 234 | 529721 | 2905.23 | 636 | 606 | 182.1 |
| D | 2 | 31 | 138826 | 758.93 | 636 | 606 | 182.1 |
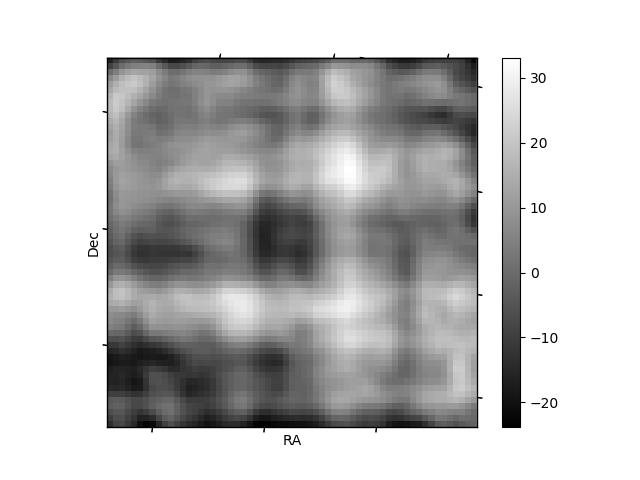
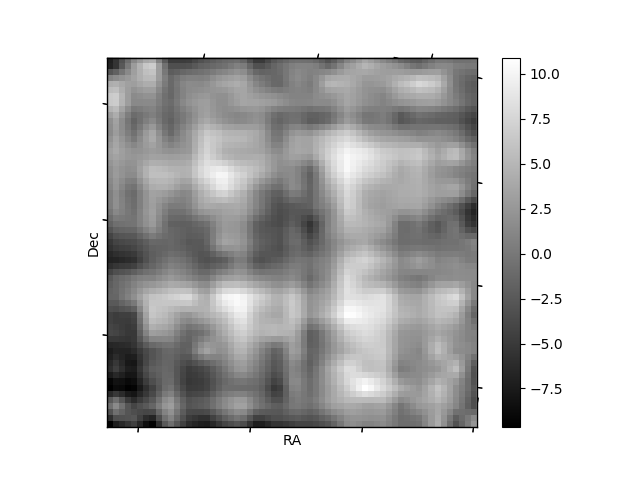
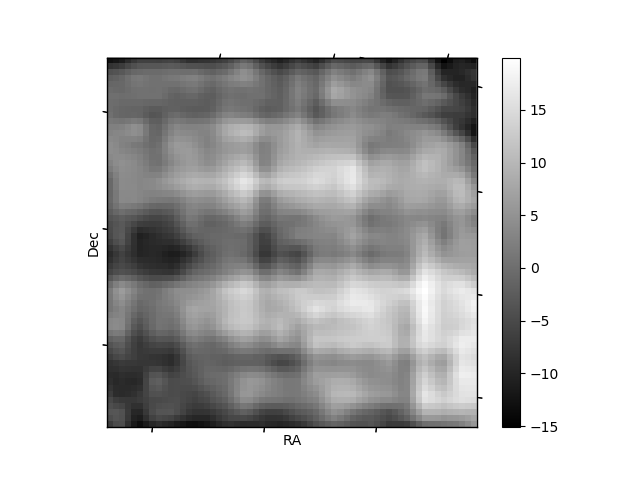
Histogram calculated using DETX and DETY for each event in the final _common_clean file
| Quadrant A | 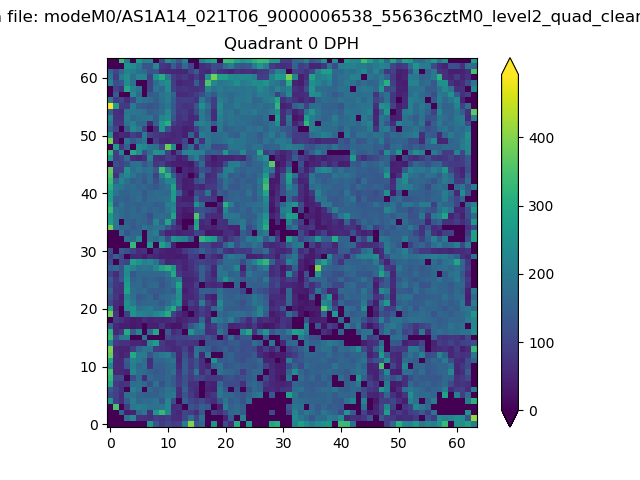 |
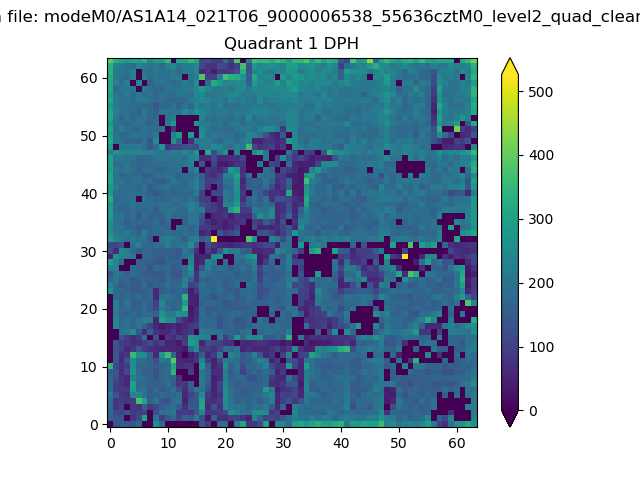 |
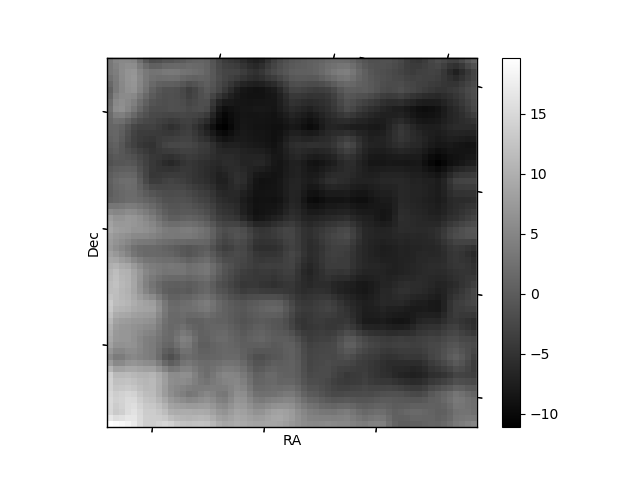
Quadrant B |
|---|---|---|---|
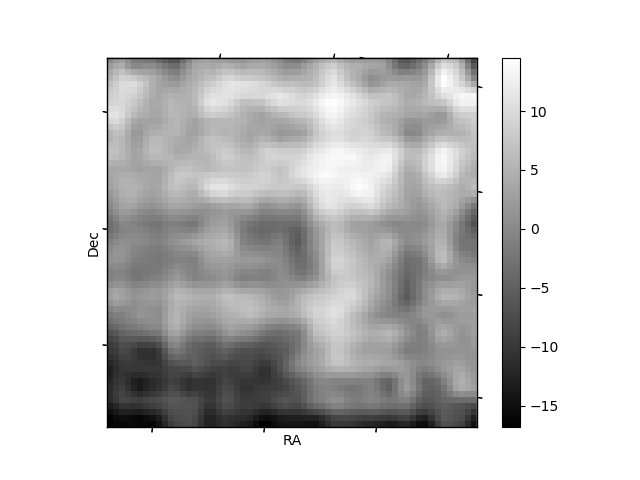
| Quadrant D | 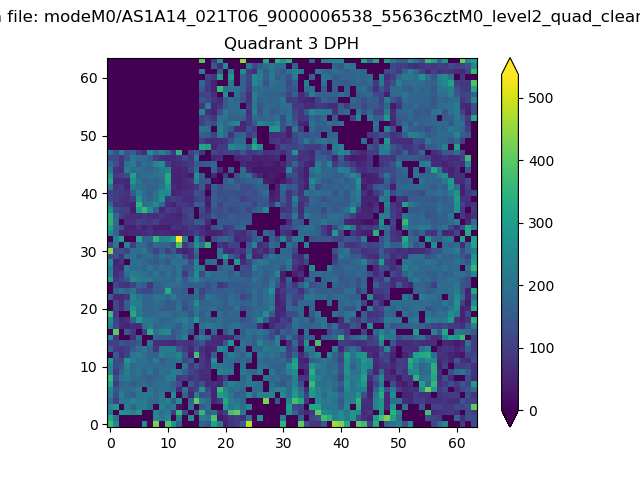 |
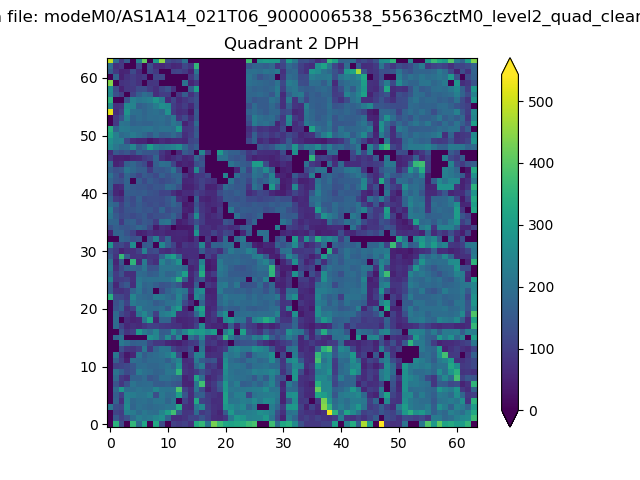 |
Quadrant C |
| Plot type | Count rate plots | Images |
|---|---|---|
| Comparison with Poisson distribution Blue bars denote a histogram of data divided into 1 sec bins. Red curve is a Poisson curve with rate = median count rate of data. |
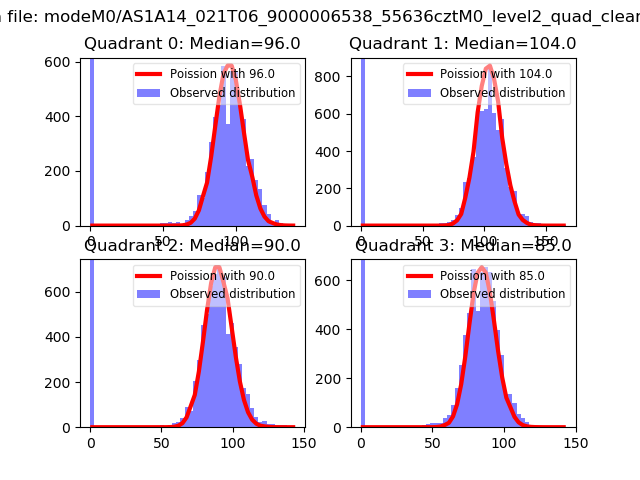 |
 |
| Quadrant-wise count rates Data is divided into 100 sec bins |
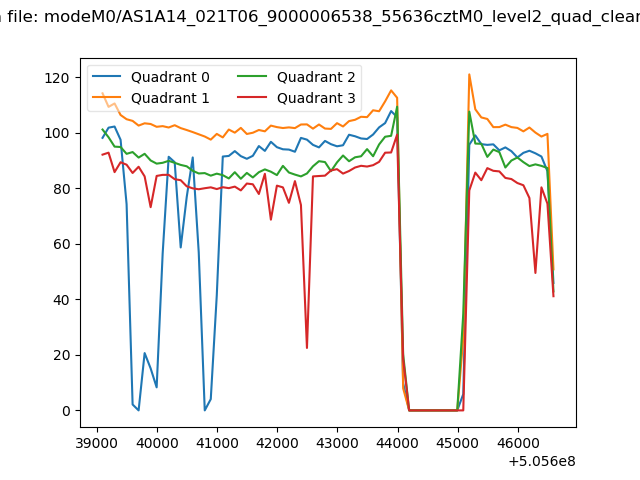 |
|
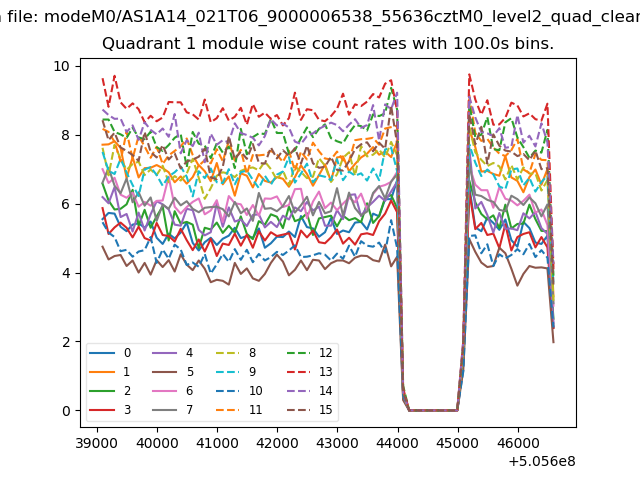
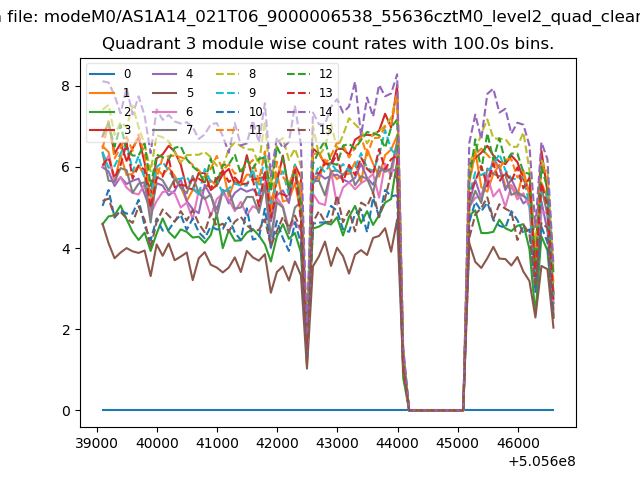
| Module-wise count rates for Quadrant A Data is divided into 100 sec bins |
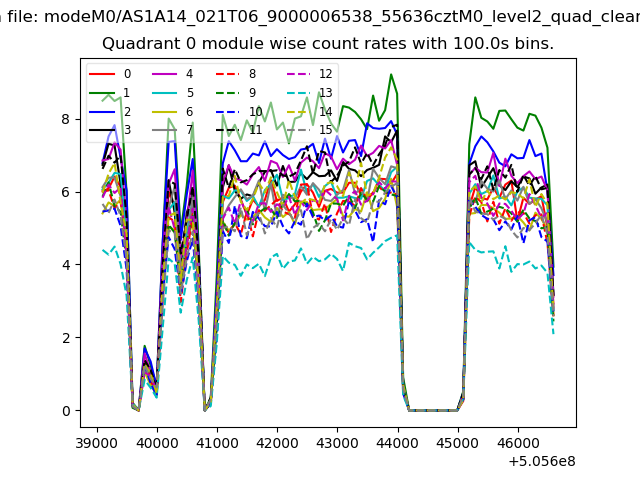 |
 |
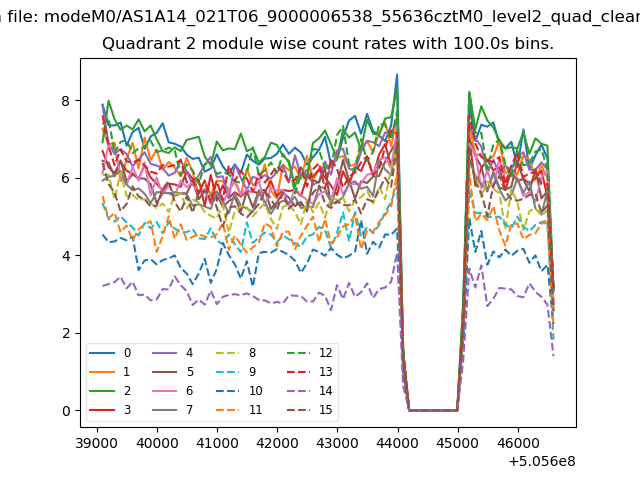
| Module-wise count rates for Quadrant B Data is divided into 100 sec bins |
 |
 |
| Module-wise count rates for Quadrant C Data is divided into 100 sec bins |
 |
 |
| Module-wise count rates for Quadrant D Data is divided into 100 sec bins |
 |
 |
| Parameter | Plot |
|---|---|
| CZT HV Monitor | 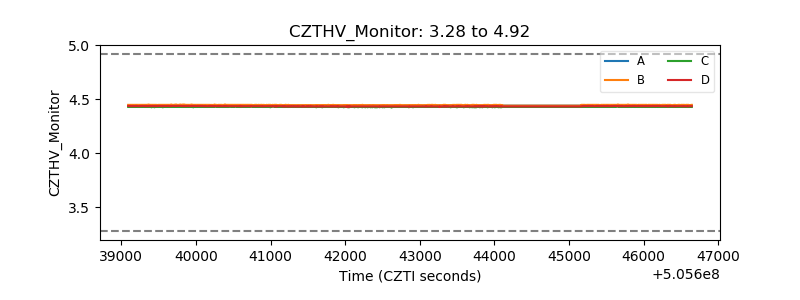 |
| D_VDD | 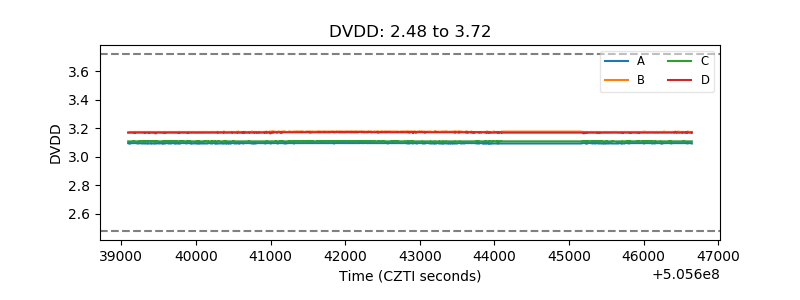 |
| Temperature 1 | 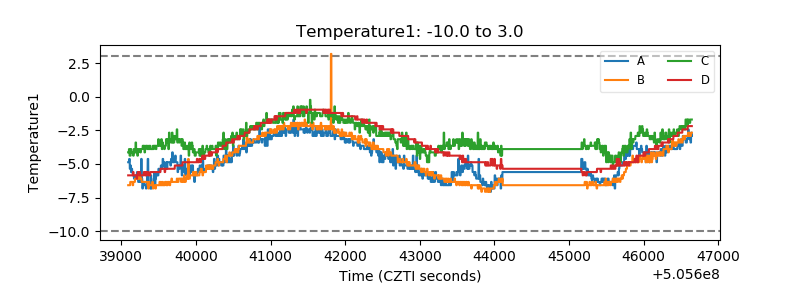 |
| Veto HV Monitor | 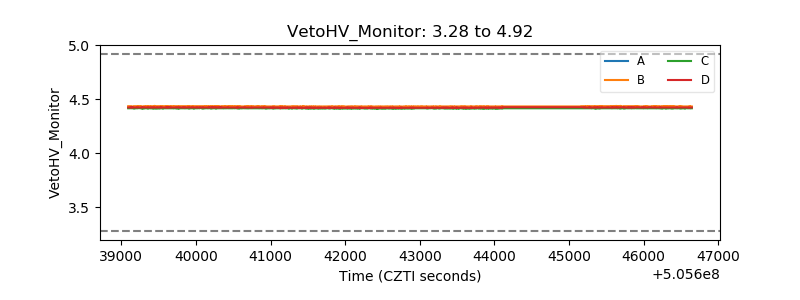 |
| Veto LLD |  |
| Alpha Counter | 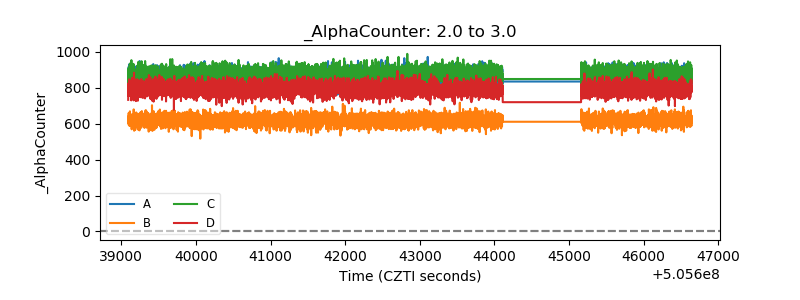 |
| _CPM_Rate | 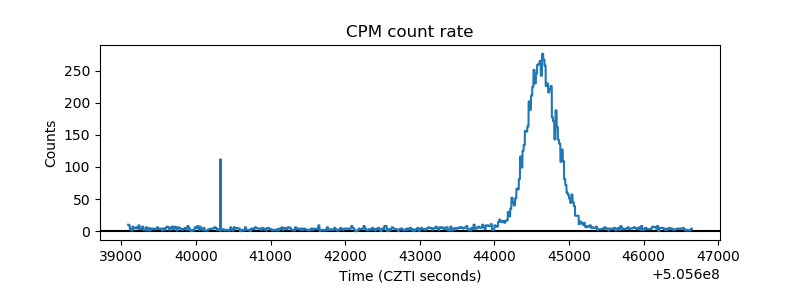 |
| CZT Counter | 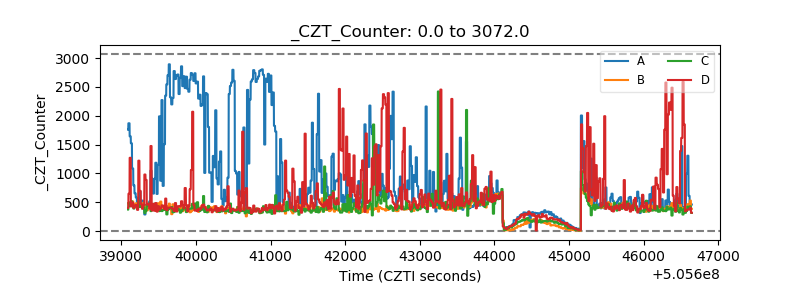 |
| +2.5 Volts monitor | 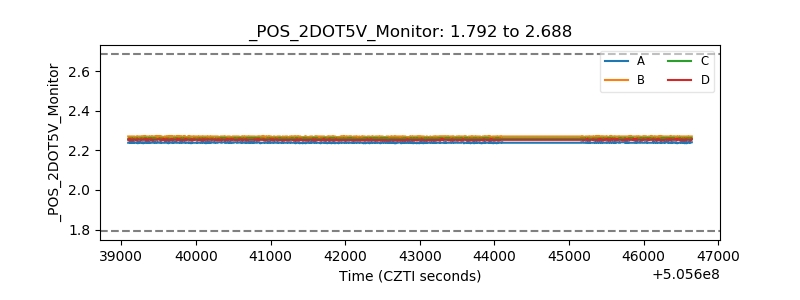 |
| +5 Volts monitor | 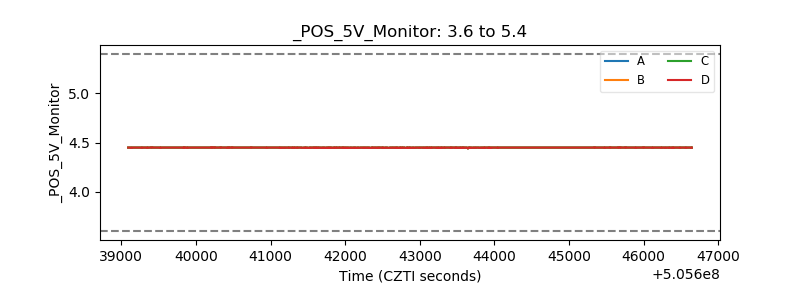 |
| _ROLL_ROT | 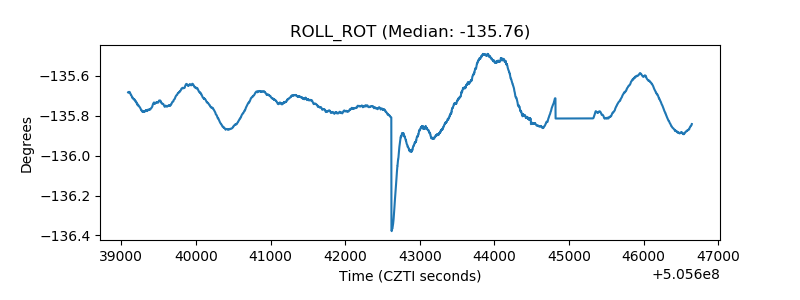 |
| _Roll_DEC | 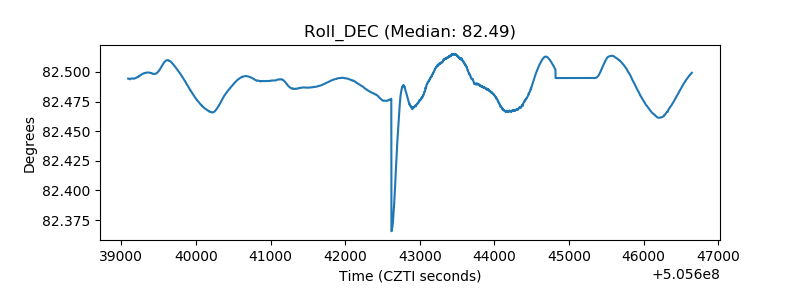 |
| _Roll_RA | 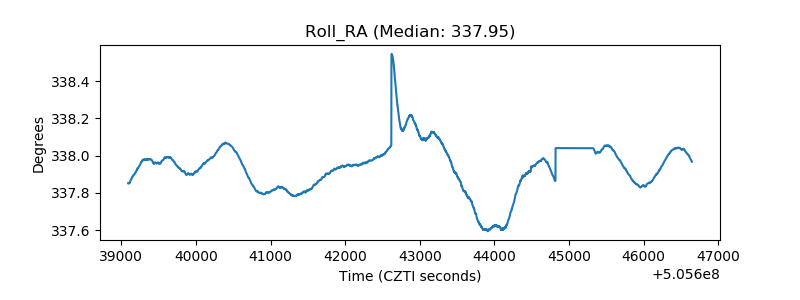 |
| Veto Counter | 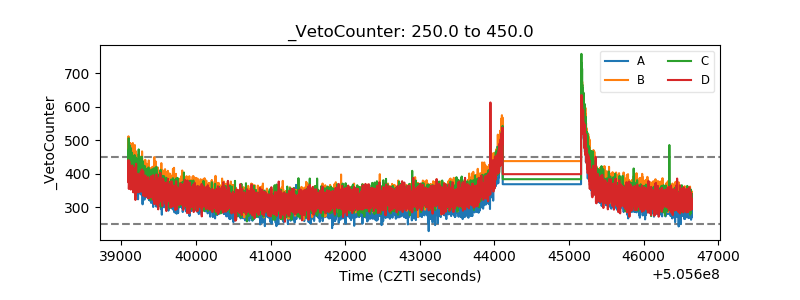 |