| Param | Original file | Final file |
|---|---|---|
| Filename | modeM0/AS1A14_021T06_9000006538_55637cztM0_level2.fits | modeM0/AS1A14_021T06_9000006538_55637cztM0_level2_quad_clean.evt |
| Size (bytes) | 437,423,040 | 94,550,400 |
| Size | 417.2 MB | 90.2 MB |
| Events in quadrant A | 3,577,958 | 619,727 |
| Events in quadrant B | 2,838,782 | 674,540 |
| Events in quadrant C | 3,000,178 | 593,776 |
| Events in quadrant D | 6,253,163 | 507,073 |
| Mode M9 | |||
|---|---|---|---|
| Quadrant | BADHDUFLAG | Total packets | Discarded packets |
| A | 0 | 8 | 0 |
| B | 0 | 8 | 0 |
| C | 0 | 8 | 0 |
| D | 0 | 8 | 0 |
| Mode M0 | |||
|---|---|---|---|
| Quadrant | BADHDUFLAG | Total packets | Discarded packets |
| A | 0 | 15406 | 1 |
| B | 0 | 13774 | 2 |
| C | 0 | 14297 | 1 |
| D | 0 | 23281 | 1 |
| Mode SS | |||
|---|---|---|---|
| Quadrant | BADHDUFLAG | Total packets | Discarded packets |
| A | 0 | 136 | 0 |
| B | 0 | 136 | 0 |
| C | 0 | 136 | 0 |
| D | 0 | 136 | 0 |
| Quadrant | Total seconds | Saturated seconds | Saturation percentage |
|---|---|---|---|
| A | 6708 | 174 | 2.593918% |
| B | 6707 | 86 | 1.282242% |
| C | 6708 | 51 | 0.760286% |
| D | 6708 | 800 | 11.926058% |
Noise dominated data is calculated using 1-second bins in cleaned event files. If a bin has >2000 counts, and if more than 50% of those come from <1% of pixels, then it is considered to be noise-dominated and hence unusable.
| Quadrant | # 1 sec bins | Bins with >0 counts | Bins with >2000 counts | High rate bins dominated by noise | Noise dominated (total time) | Noise dominated (detector-on time) | Marked lightcurve |
|---|---|---|---|---|---|---|---|
| A | 7553 | 6709 | 96 | 96 | 1.27% | 1.43% | 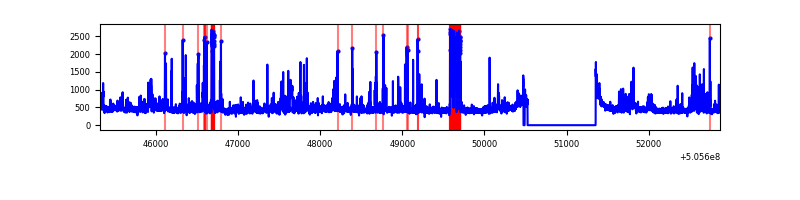 |
| B | 7552 | 6707 | 10 | 10 | 0.13% | 0.15% | 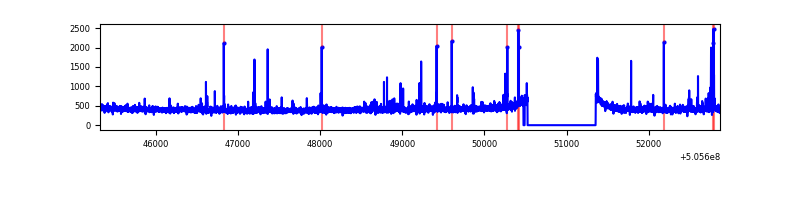 |
| C | 7553 | 6709 | 28 | 28 | 0.37% | 0.42% | 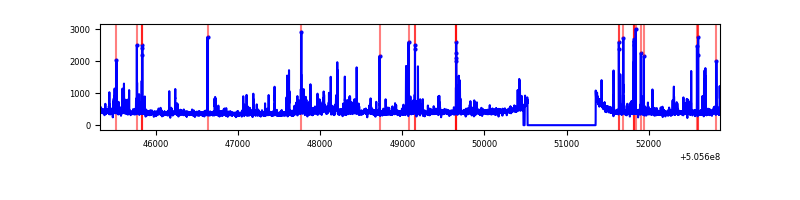 |
| D | 7552 | 6707 | 741 | 741 | 9.81% | 11.05% | 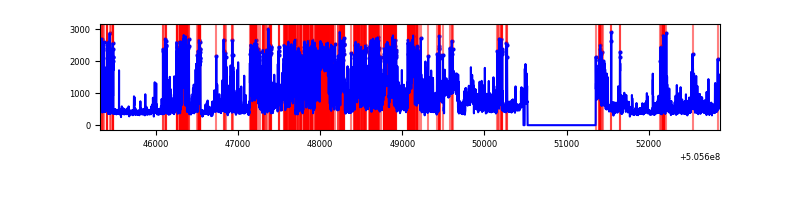 |
Top three noisy pixels from each quadrant. If the there are fewer than three noisy pixels in the level2.evt file, extra rows are filled as -1
| Pixel properties | Quadrant properties | ||||||
|---|---|---|---|---|---|---|---|
| Quadrant | DetID | PixID | Counts | Sigma | Mean | Median | Sigma |
| A | 8 | 249 | 340903 | 2011.81 | 690 | 673 | 169.1 |
| A | 15 | 32 | 290949 | 1716.43 | 690 | 673 | 169.1 |
| A | 12 | 115 | 73694 | 431.78 | 690 | 673 | 169.1 |
| B | 7 | 252 | 30912 | 209.63 | 680 | 655 | 144.3 |
| B | 10 | 247 | 27783 | 187.95 | 680 | 655 | 144.3 |
| B | 1 | 159 | 25386 | 171.34 | 680 | 655 | 144.3 |
| C | 13 | 3 | 131596 | 718.39 | 663 | 656 | 182.3 |
| C | 6 | 223 | 73803 | 401.31 | 663 | 656 | 182.3 |
| C | 15 | 147 | 72071 | 391.81 | 663 | 656 | 182.3 |
| D | 11 | 129 | 2395002 | 13055.77 | 640 | 611 | 183.4 |
| D | 15 | 234 | 514513 | 2802.13 | 640 | 611 | 183.4 |
| D | 10 | 181 | 160458 | 871.59 | 640 | 611 | 183.4 |
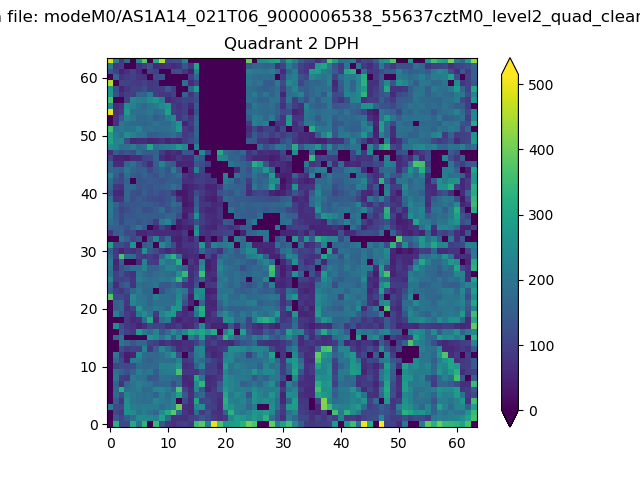
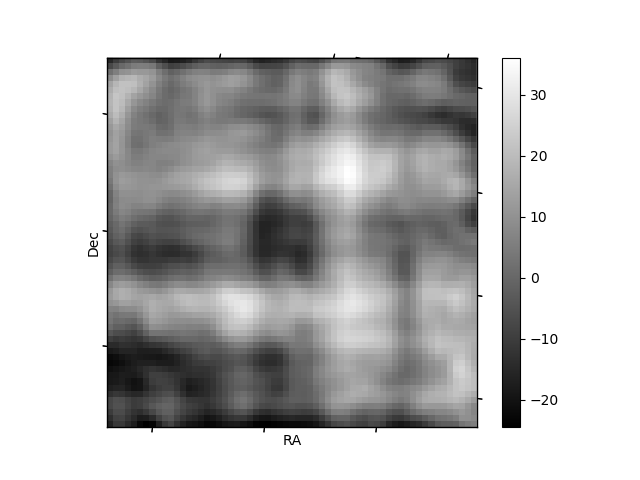
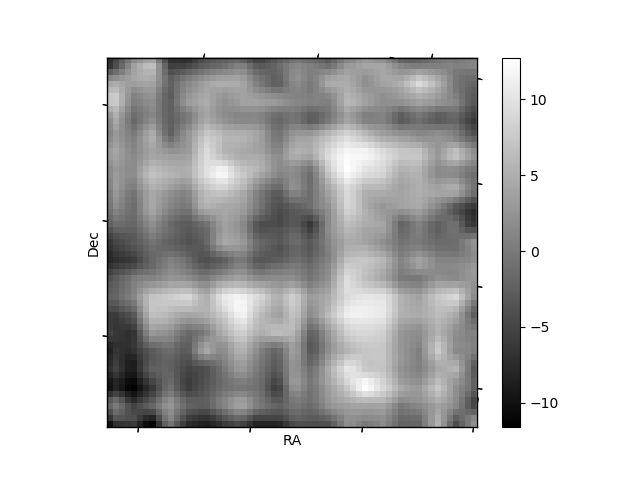
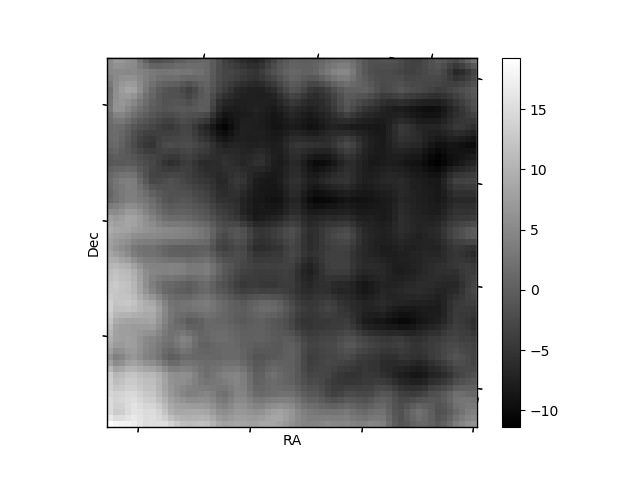
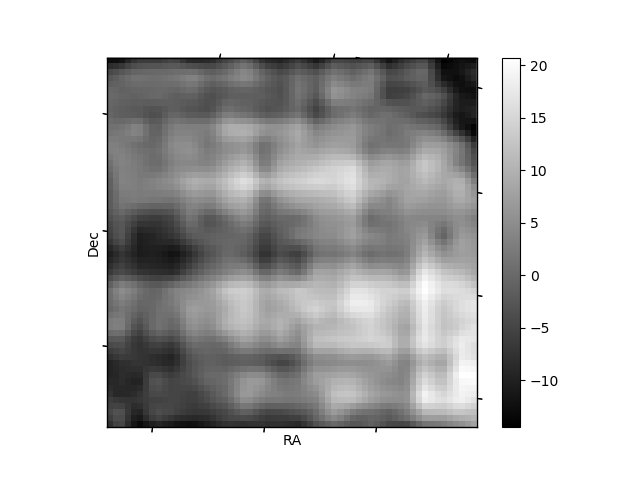
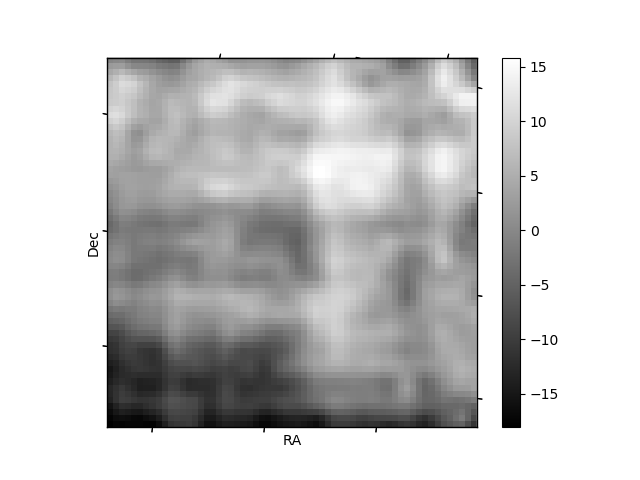
Histogram calculated using DETX and DETY for each event in the final _common_clean file
| Quadrant A | 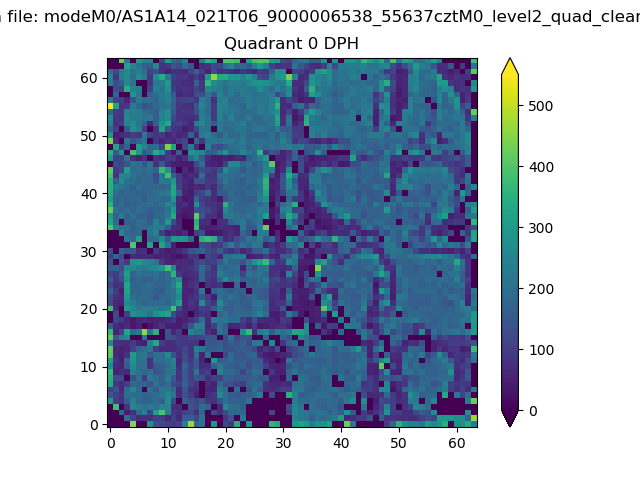 |
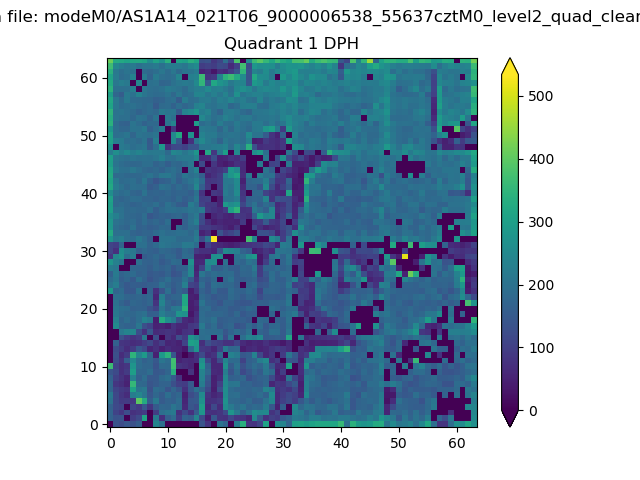 |
Quadrant B |
|---|---|---|---|
| Quadrant D | 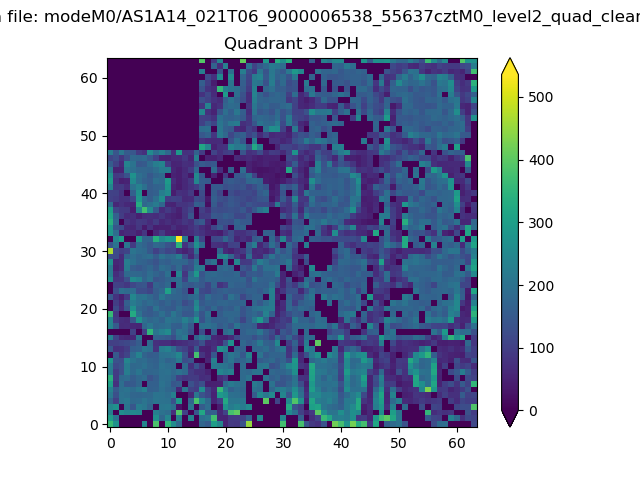 |
 |
Quadrant C |
| Plot type | Count rate plots | Images |
|---|---|---|
| Comparison with Poisson distribution Blue bars denote a histogram of data divided into 1 sec bins. Red curve is a Poisson curve with rate = median count rate of data. |
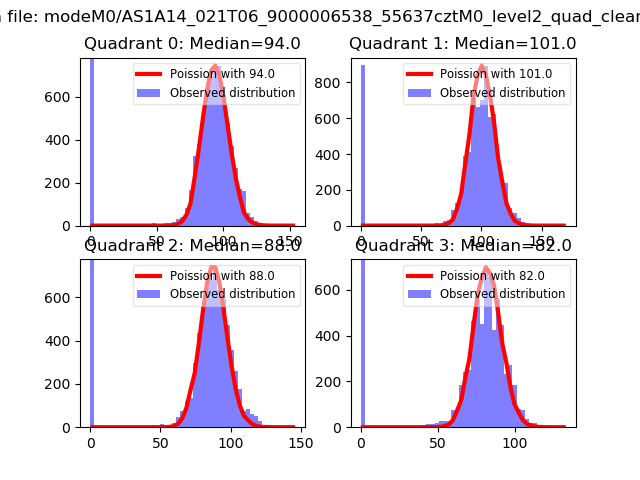 |
 |
| Quadrant-wise count rates Data is divided into 100 sec bins |
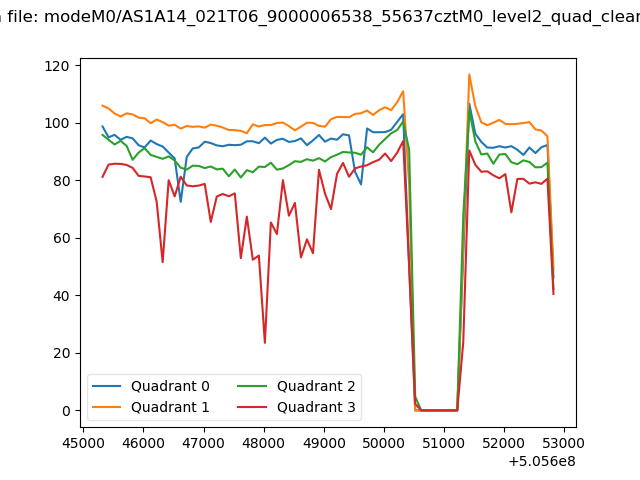 |
|
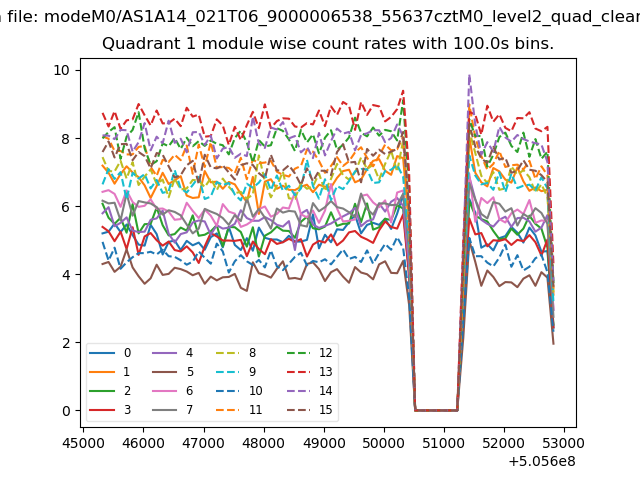
| Module-wise count rates for Quadrant A Data is divided into 100 sec bins |
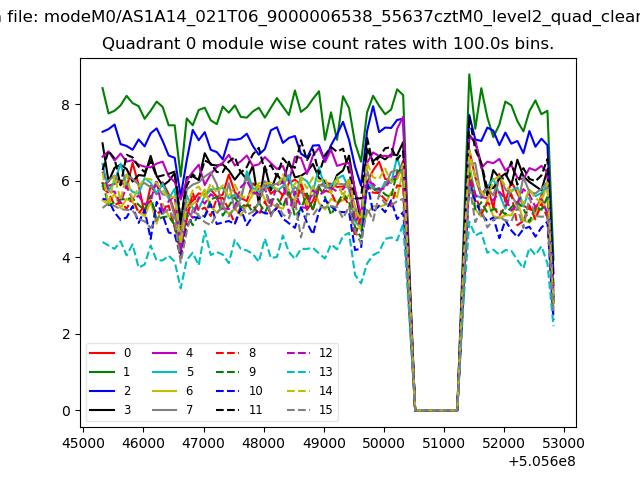 |
 |
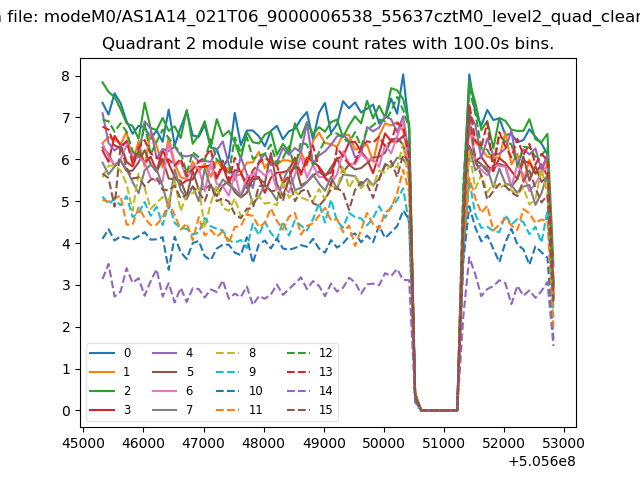
| Module-wise count rates for Quadrant B Data is divided into 100 sec bins |
 |
 |
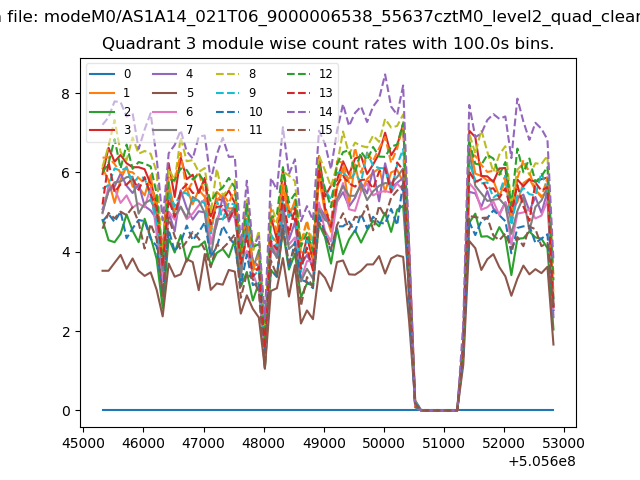
| Module-wise count rates for Quadrant C Data is divided into 100 sec bins |
 |
 |
| Module-wise count rates for Quadrant D Data is divided into 100 sec bins |
 |
 |
| Parameter | Plot |
|---|---|
| CZT HV Monitor | 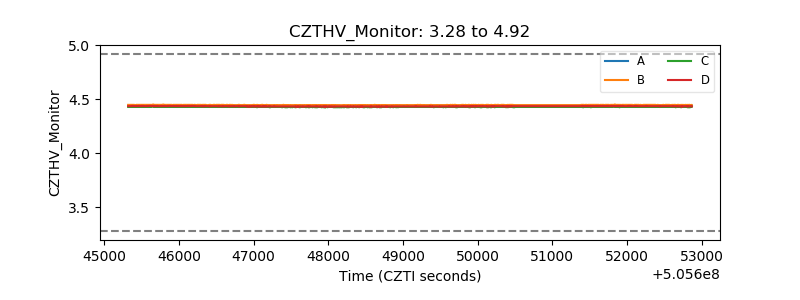 |
| D_VDD | 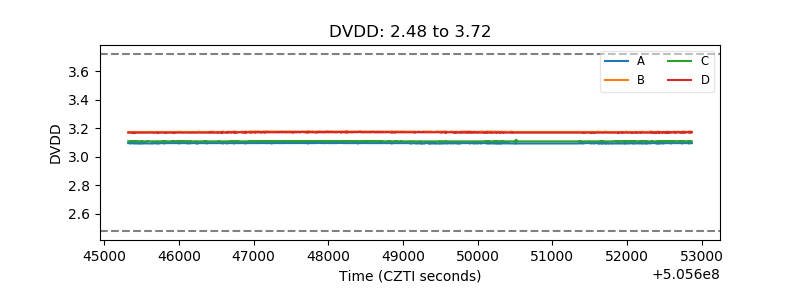 |
| Temperature 1 | 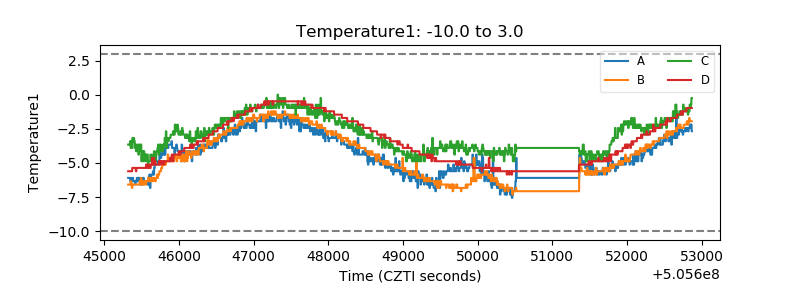 |
| Veto HV Monitor | 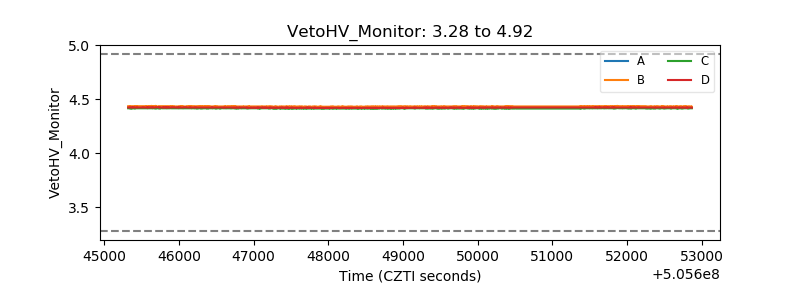 |
| Veto LLD | 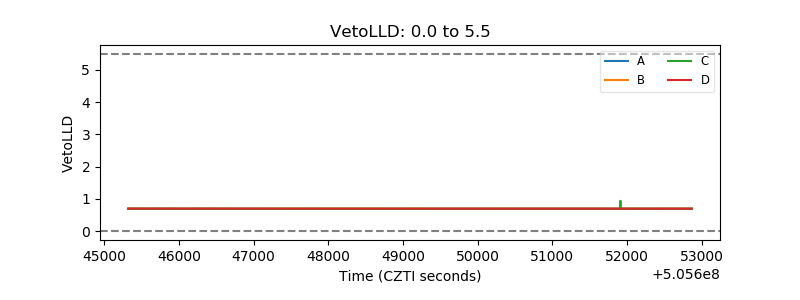 |
| Alpha Counter | 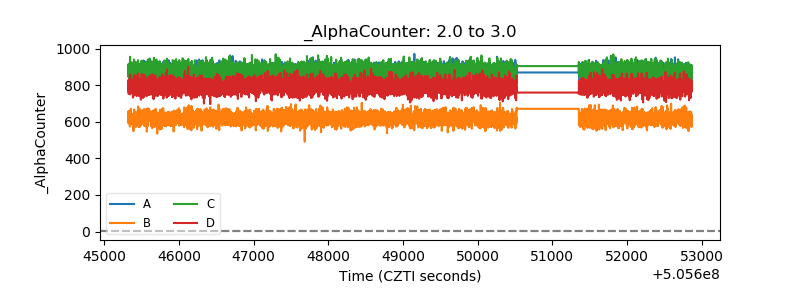 |
| _CPM_Rate | 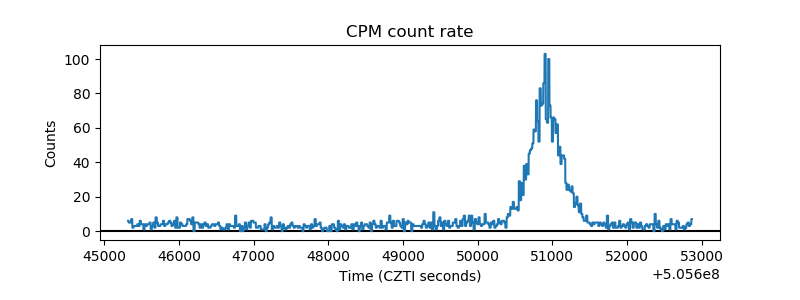 |
| CZT Counter | 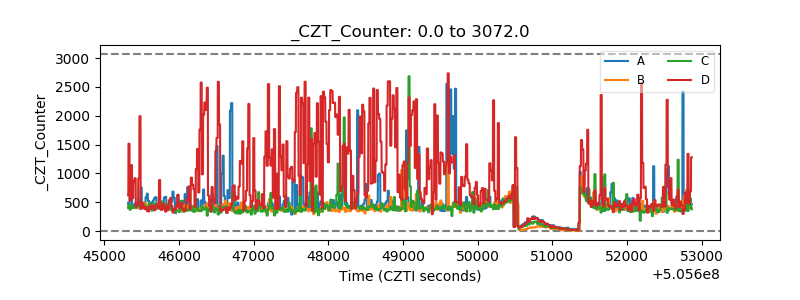 |
| +2.5 Volts monitor | 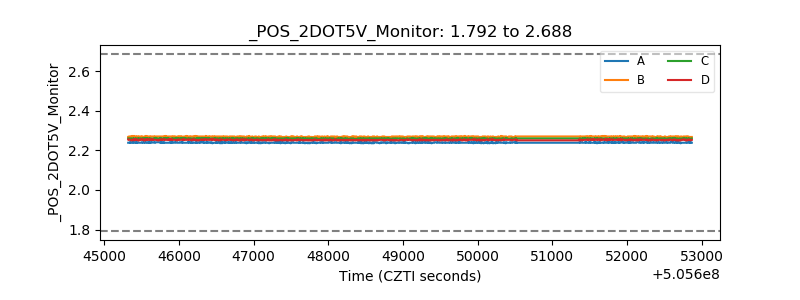 |
| +5 Volts monitor | 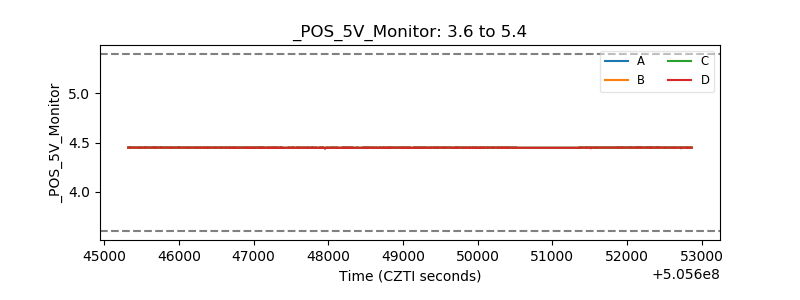 |
| _ROLL_ROT | 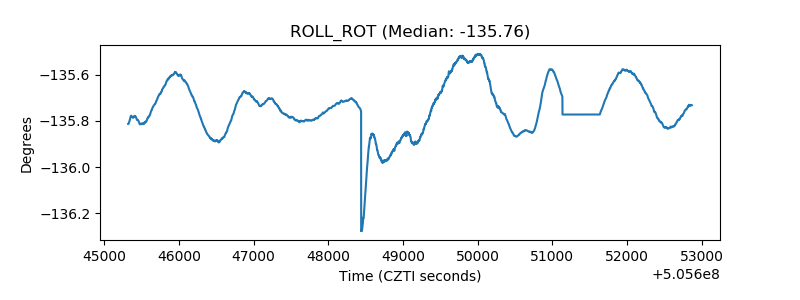 |
| _Roll_DEC | 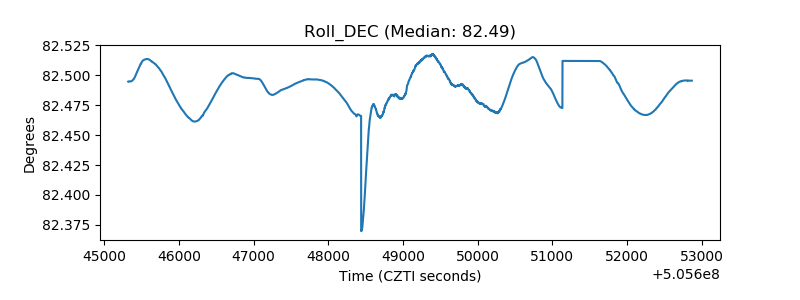 |
| _Roll_RA | 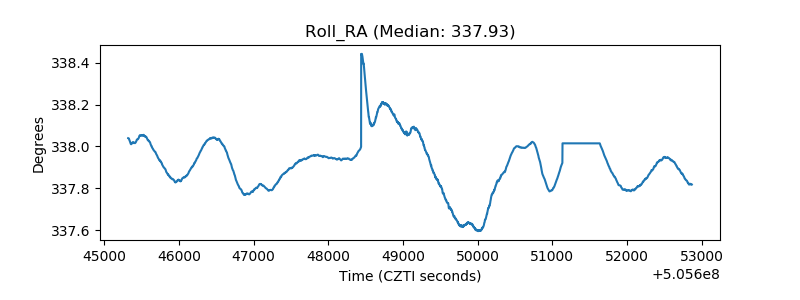 |
| Veto Counter | 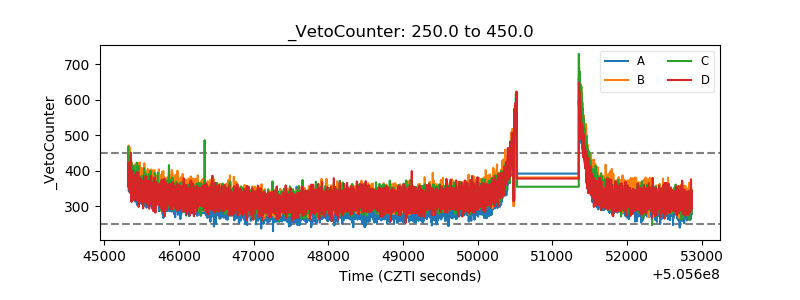 |