| Param | Original file | Final file |
|---|---|---|
| Filename | modeM0/AS1A14_021T06_9000006538_55638cztM0_level2.fits | modeM0/AS1A14_021T06_9000006538_55638cztM0_level2_quad_clean.evt |
| Size (bytes) | 509,114,880 | 98,398,080 |
| Size | 485.5 MB | 93.8 MB |
| Events in quadrant A | 3,998,199 | 644,401 |
| Events in quadrant B | 3,214,954 | 707,982 |
| Events in quadrant C | 3,869,018 | 611,701 |
| Events in quadrant D | 7,205,156 | 514,789 |
| Mode M9 | |||
|---|---|---|---|
| Quadrant | BADHDUFLAG | Total packets | Discarded packets |
| A | 0 | 2 | 0 |
| B | 0 | 2 | 0 |
| C | 0 | 2 | 0 |
| D | 0 | 2 | 0 |
| Mode M0 | |||
|---|---|---|---|
| Quadrant | BADHDUFLAG | Total packets | Discarded packets |
| A | 0 | 17203 | 2 |
| B | 0 | 15212 | 3 |
| C | 0 | 17156 | 2 |
| D | 0 | 26386 | 2 |
| Mode SS | |||
|---|---|---|---|
| Quadrant | BADHDUFLAG | Total packets | Discarded packets |
| A | 0 | 148 | 0 |
| B | 0 | 148 | 0 |
| C | 0 | 148 | 0 |
| D | 0 | 148 | 0 |
| Quadrant | Total seconds | Saturated seconds | Saturation percentage |
|---|---|---|---|
| A | 7179 | 294 | 4.095278% |
| B | 7178 | 198 | 2.758429% |
| C | 7179 | 295 | 4.109207% |
| D | 7179 | 1174 | 16.353253% |
Noise dominated data is calculated using 1-second bins in cleaned event files. If a bin has >2000 counts, and if more than 50% of those come from <1% of pixels, then it is considered to be noise-dominated and hence unusable.
| Quadrant | # 1 sec bins | Bins with >0 counts | Bins with >2000 counts | High rate bins dominated by noise | Noise dominated (total time) | Noise dominated (detector-on time) | Marked lightcurve |
|---|---|---|---|---|---|---|---|
| A | 7494 | 7179 | 44 | 44 | 0.59% | 0.61% | 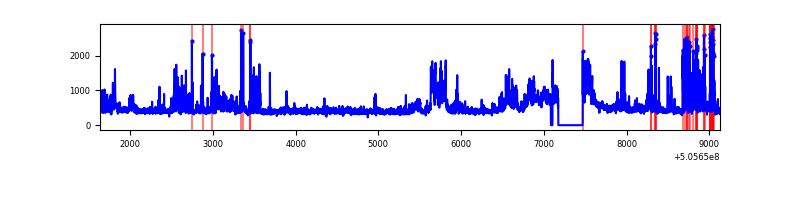 |
| B | 7493 | 7178 | 18 | 18 | 0.24% | 0.25% | 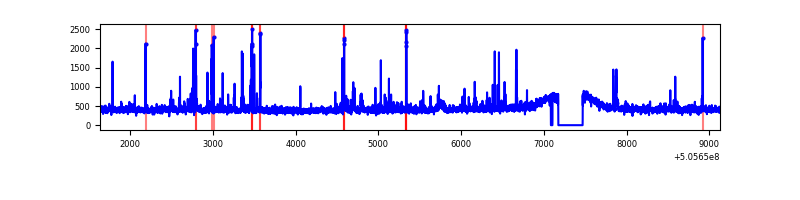 |
| C | 7494 | 7180 | 184 | 184 | 2.46% | 2.56% | 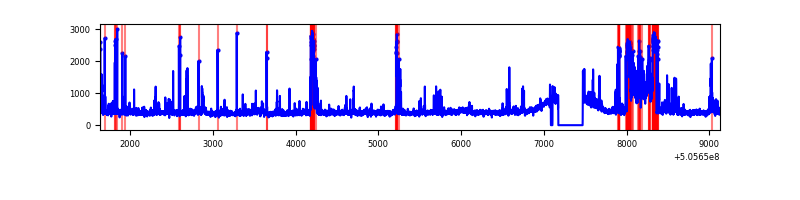 |
| D | 7494 | 7179 | 1037 | 1037 | 13.84% | 14.44% | 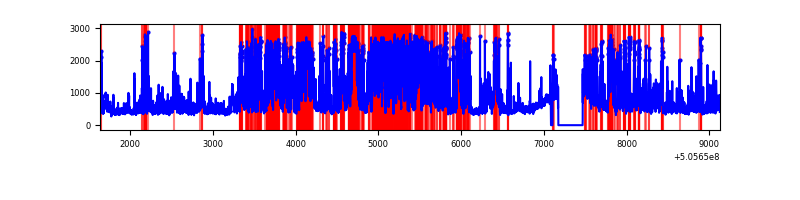 |
Top three noisy pixels from each quadrant. If the there are fewer than three noisy pixels in the level2.evt file, extra rows are filled as -1
| Pixel properties | Quadrant properties | ||||||
|---|---|---|---|---|---|---|---|
| Quadrant | DetID | PixID | Counts | Sigma | Mean | Median | Sigma |
| A | 12 | 115 | 516600 | 2825.79 | 749 | 729 | 182.6 |
| A | 0 | 8 | 245721 | 1341.99 | 749 | 729 | 182.6 |
| A | 8 | 249 | 229977 | 1255.75 | 749 | 729 | 182.6 |
| B | 1 | 159 | 106776 | 667.88 | 739 | 709 | 158.8 |
| B | 7 | 252 | 33431 | 206.04 | 739 | 709 | 158.8 |
| B | 10 | 247 | 24058 | 147.02 | 739 | 709 | 158.8 |
| C | 13 | 3 | 608106 | 3104.31 | 720 | 710 | 195.7 |
| C | 9 | 38 | 152392 | 775.22 | 720 | 710 | 195.7 |
| C | 10 | 19 | 117601 | 597.41 | 720 | 710 | 195.7 |
| D | 11 | 129 | 2925108 | 14880.2 | 690 | 659 | 196.5 |
| D | 2 | 31 | 365306 | 1855.4 | 690 | 659 | 196.5 |
| D | 8 | 160 | 364678 | 1852.2 | 690 | 659 | 196.5 |
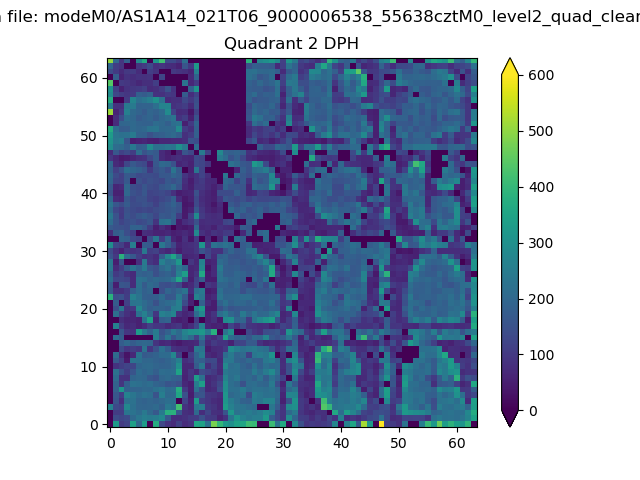
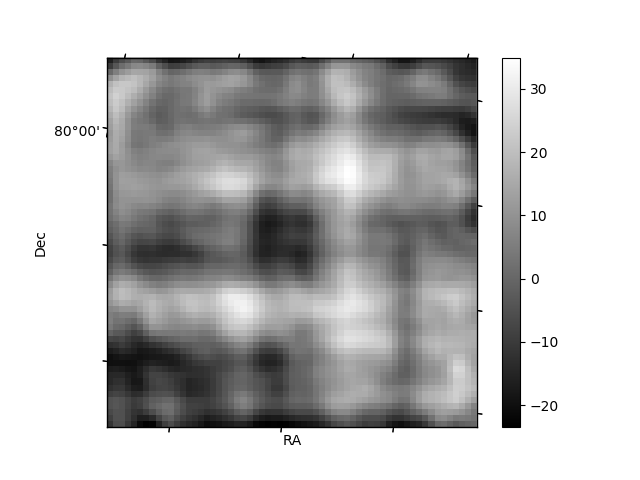
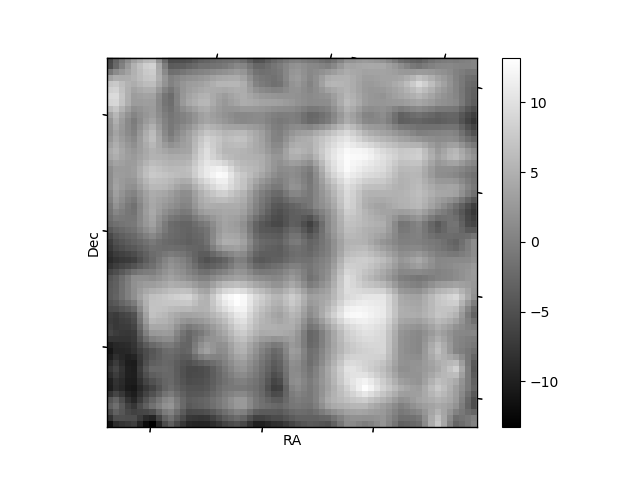
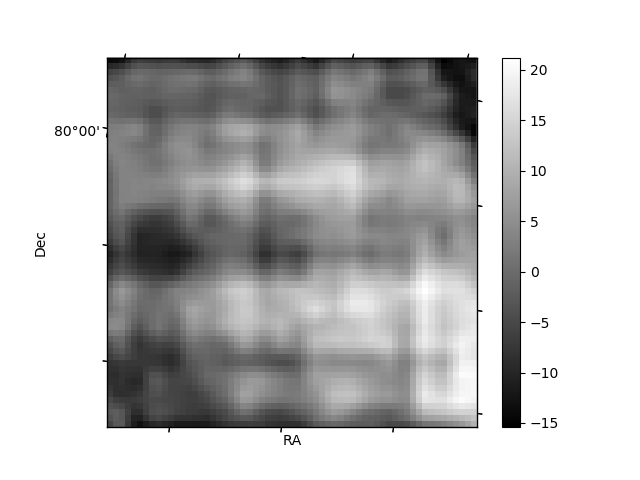
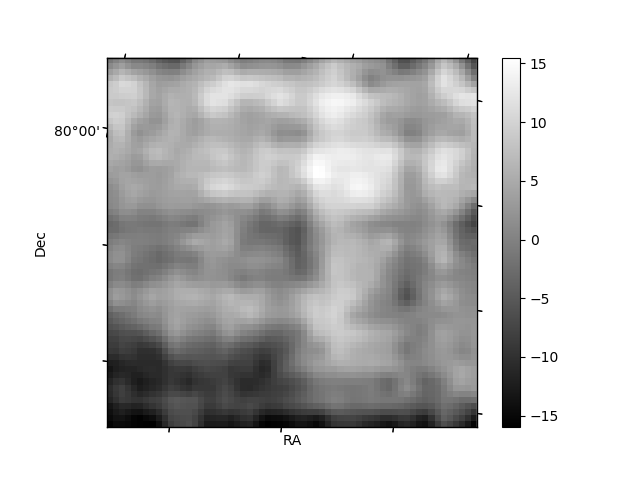
Histogram calculated using DETX and DETY for each event in the final _common_clean file
| Quadrant A | 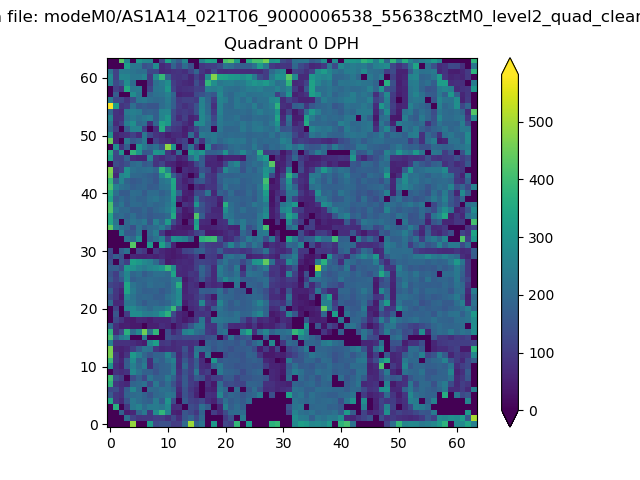 |
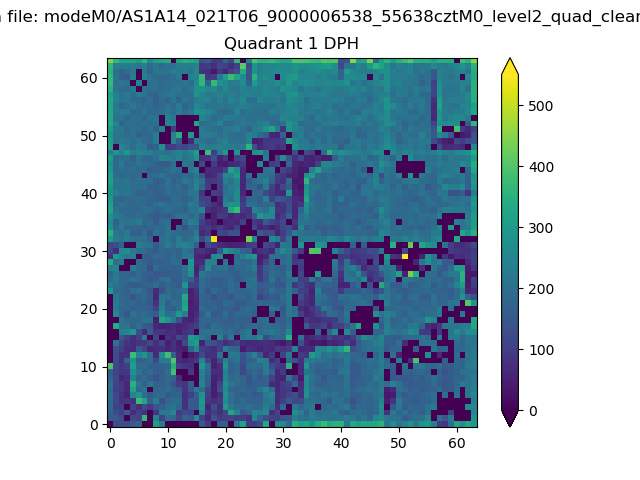 |
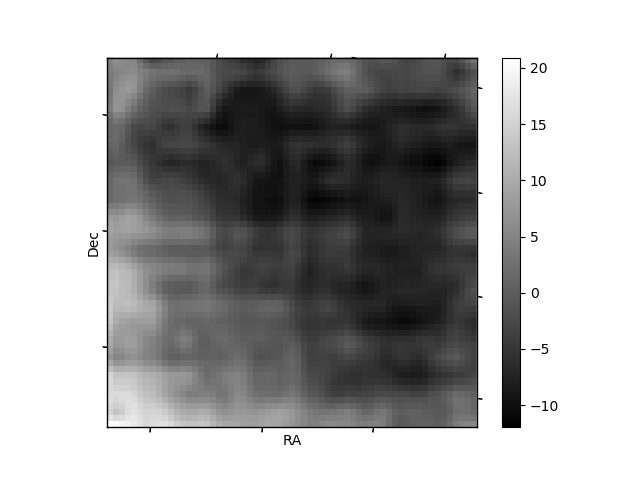
Quadrant B |
|---|---|---|---|
| Quadrant D | 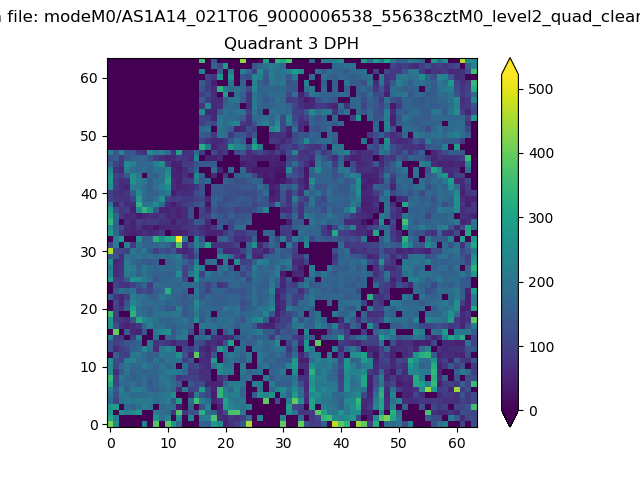 |
 |
Quadrant C |
| Plot type | Count rate plots | Images |
|---|---|---|
| Comparison with Poisson distribution Blue bars denote a histogram of data divided into 1 sec bins. Red curve is a Poisson curve with rate = median count rate of data. |
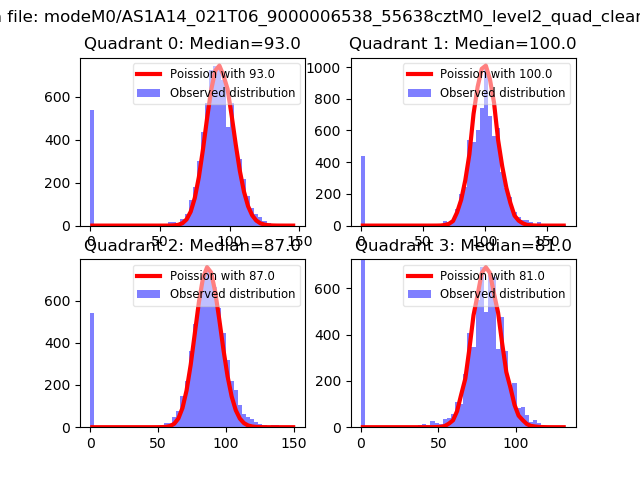 |
 |
| Quadrant-wise count rates Data is divided into 100 sec bins |
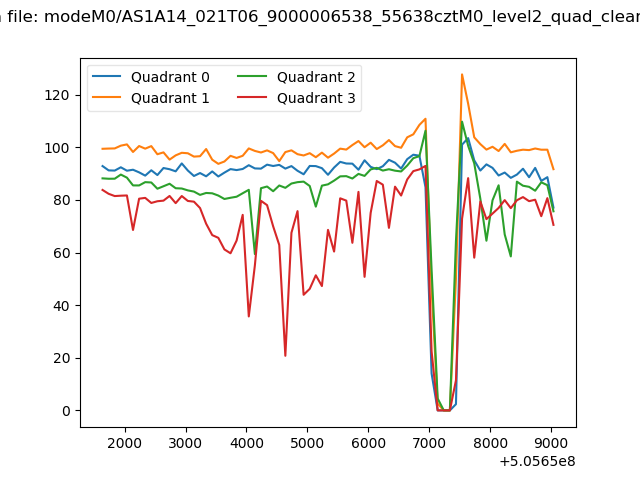 |
|
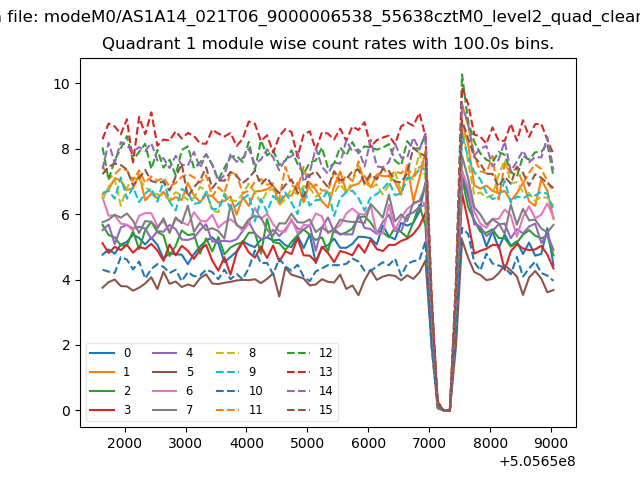
| Module-wise count rates for Quadrant A Data is divided into 100 sec bins |
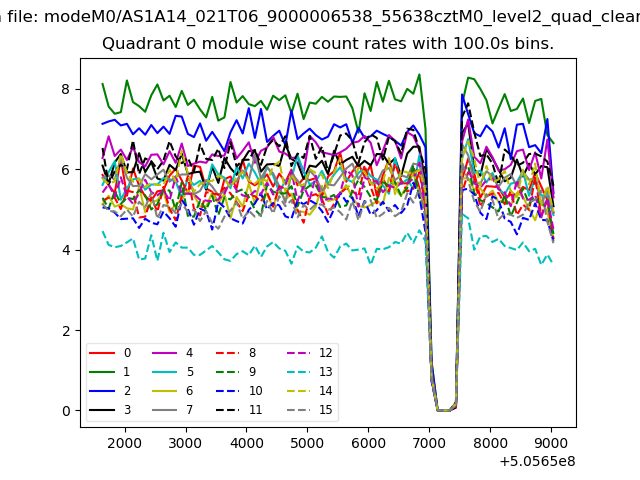 |
 |
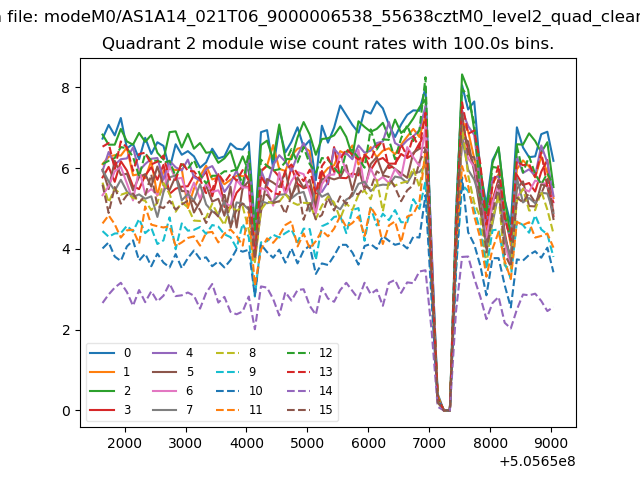
| Module-wise count rates for Quadrant B Data is divided into 100 sec bins |
 |
 |
| Module-wise count rates for Quadrant C Data is divided into 100 sec bins |
 |
 |
| Module-wise count rates for Quadrant D Data is divided into 100 sec bins |
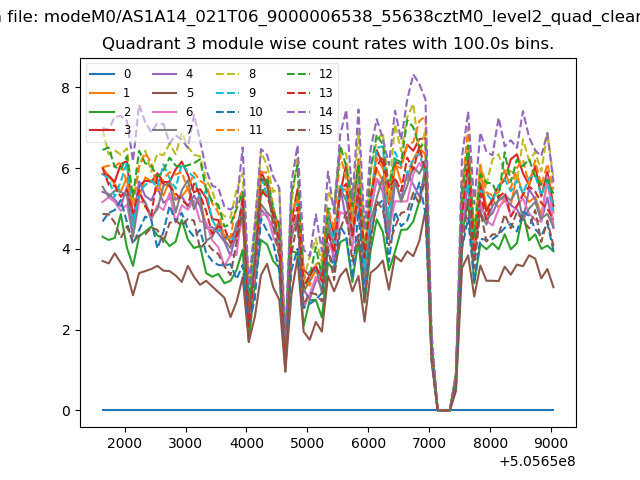 |
 |
| Parameter | Plot |
|---|---|
| CZT HV Monitor | 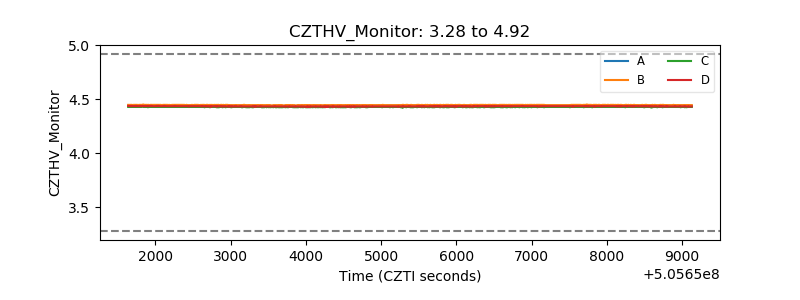 |
| D_VDD | 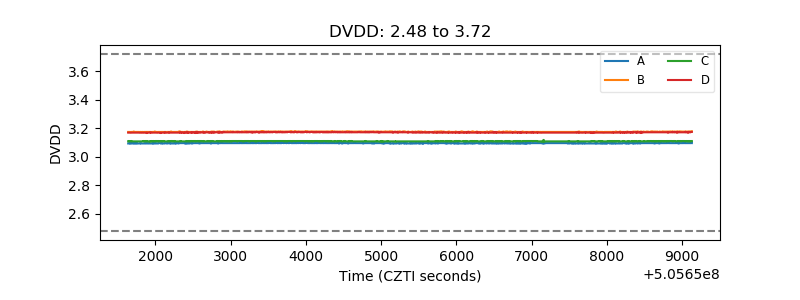 |
| Temperature 1 | 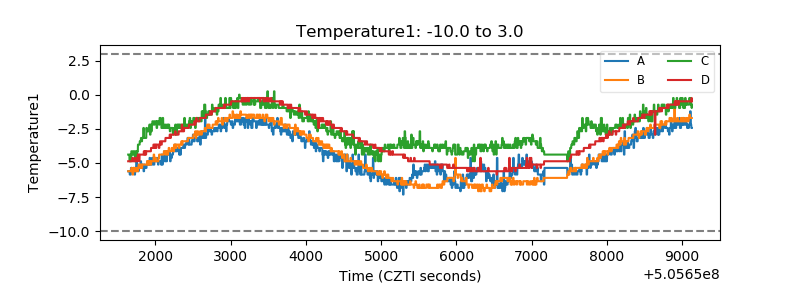 |
| Veto HV Monitor | 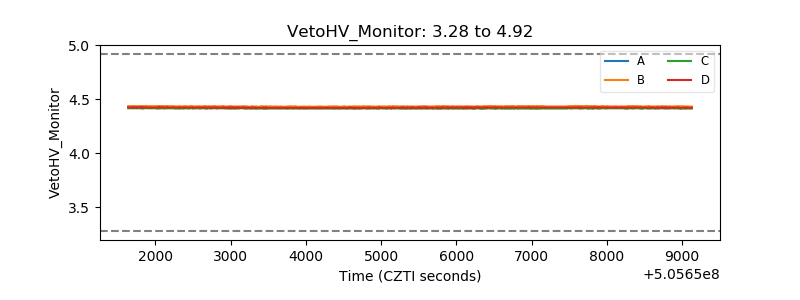 |
| Veto LLD | 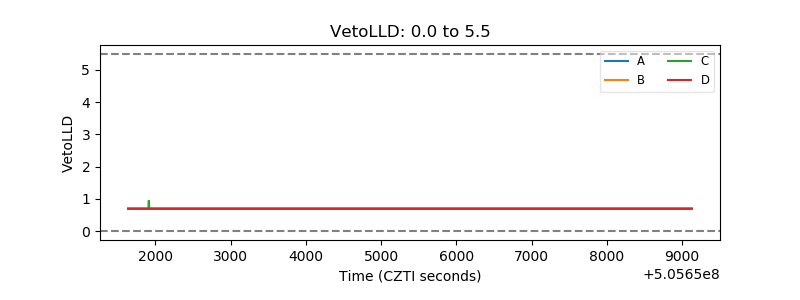 |
| Alpha Counter | 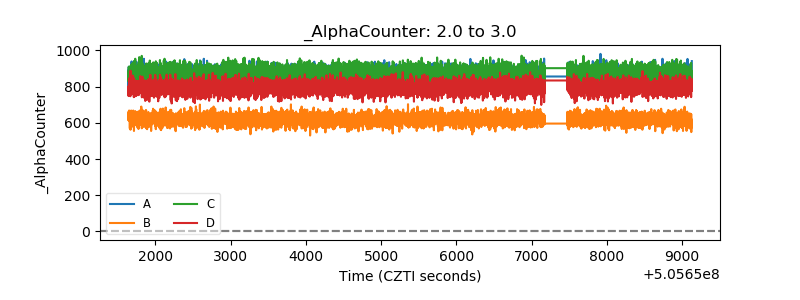 |
| _CPM_Rate | 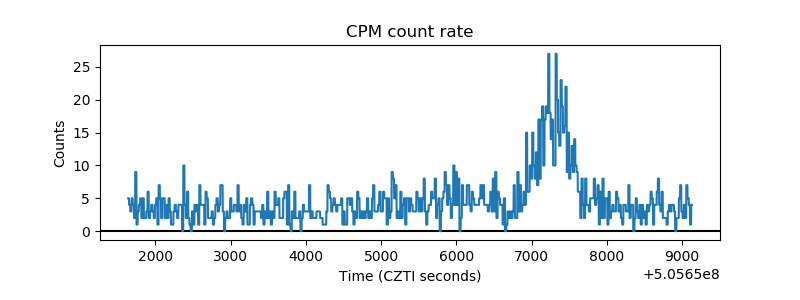 |
| CZT Counter | 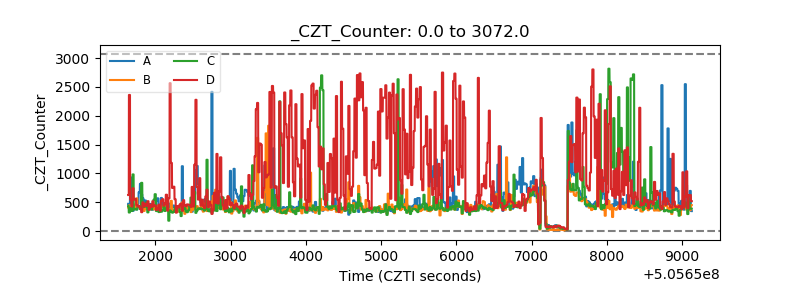 |
| +2.5 Volts monitor | 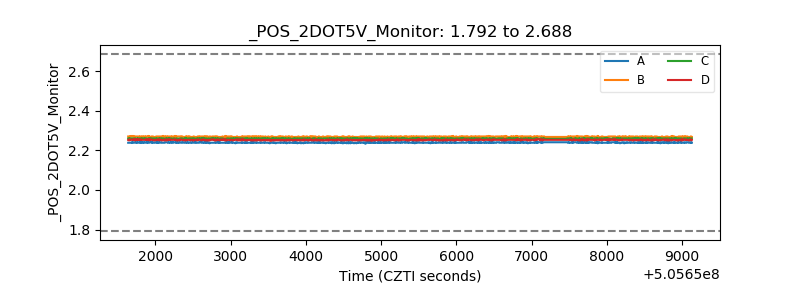 |
| +5 Volts monitor | 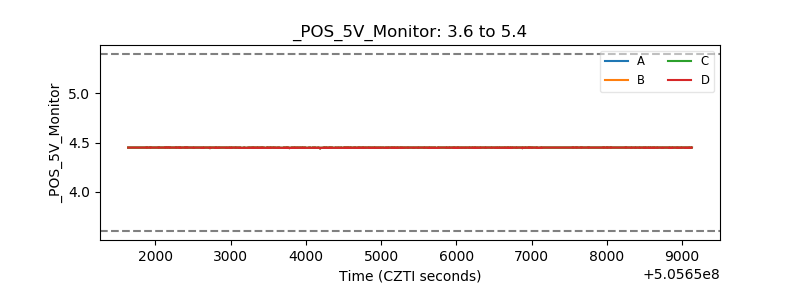 |
| _ROLL_ROT | 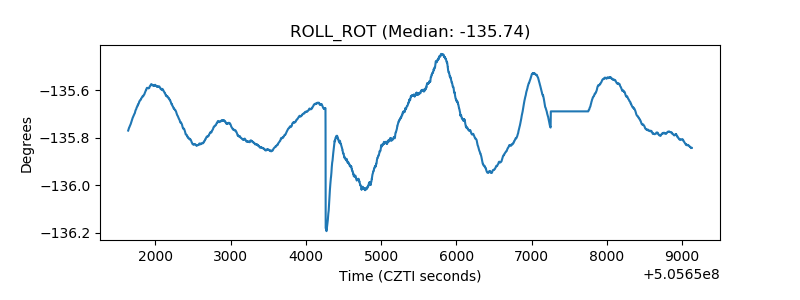 |
| _Roll_DEC | 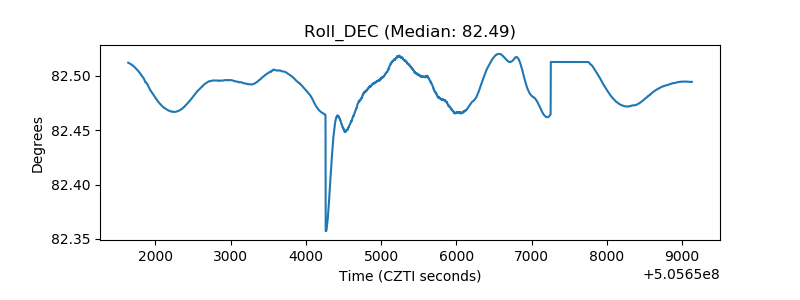 |
| _Roll_RA | 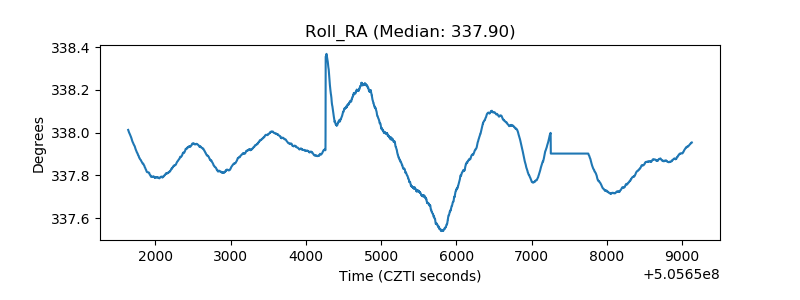 |
| Veto Counter | 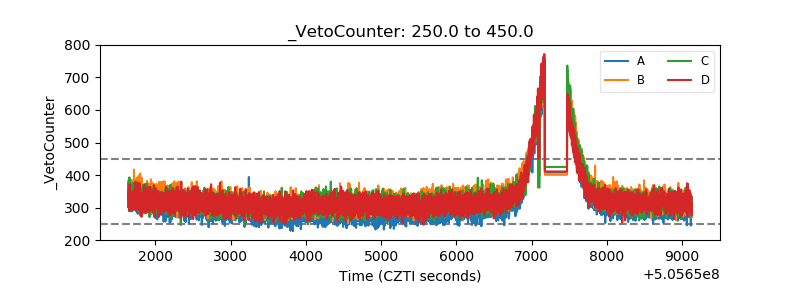 |