| Param | Original file | Final file |
|---|---|---|
| Filename | modeM0/AS1A14_021T06_9000006538_55639cztM0_level2.fits | modeM0/AS1A14_021T06_9000006538_55639cztM0_level2_quad_clean.evt |
| Size (bytes) | 544,115,520 | 109,589,760 |
| Size | 518.9 MB | 104.5 MB |
| Events in quadrant A | 5,517,294 | 701,771 |
| Events in quadrant B | 3,426,385 | 779,714 |
| Events in quadrant C | 4,427,149 | 672,026 |
| Events in quadrant D | 6,162,175 | 619,228 |
| Mode M0 | |||
|---|---|---|---|
| Quadrant | BADHDUFLAG | Total packets | Discarded packets |
| A | 0 | 22056 | 2 |
| B | 0 | 16243 | 0 |
| C | 0 | 19102 | 0 |
| D | 0 | 23850 | 0 |
| Mode SS | |||
|---|---|---|---|
| Quadrant | BADHDUFLAG | Total packets | Discarded packets |
| A | 0 | 158 | 0 |
| B | 0 | 158 | 0 |
| C | 0 | 158 | 0 |
| D | 0 | 158 | 0 |
| Quadrant | Total seconds | Saturated seconds | Saturation percentage |
|---|---|---|---|
| A | 7839 | 323 | 4.120424% |
| B | 7839 | 28 | 0.357188% |
| C | 7839 | 176 | 2.245184% |
| D | 7839 | 464 | 5.919122% |
Noise dominated data is calculated using 1-second bins in cleaned event files. If a bin has >2000 counts, and if more than 50% of those come from <1% of pixels, then it is considered to be noise-dominated and hence unusable.
| Quadrant | # 1 sec bins | Bins with >0 counts | Bins with >2000 counts | High rate bins dominated by noise | Noise dominated (total time) | Noise dominated (detector-on time) | Marked lightcurve |
|---|---|---|---|---|---|---|---|
| A | 7839 | 7839 | 308 | 308 | 3.93% | 3.93% | 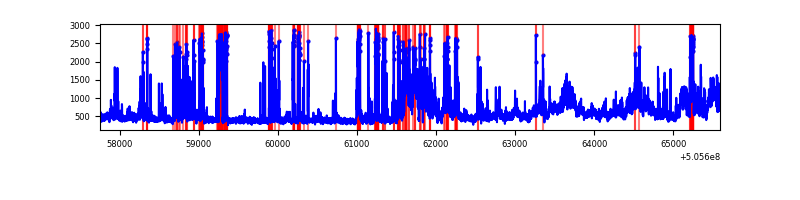 |
| B | 7839 | 7839 | 3 | 3 | 0.04% | 0.04% | 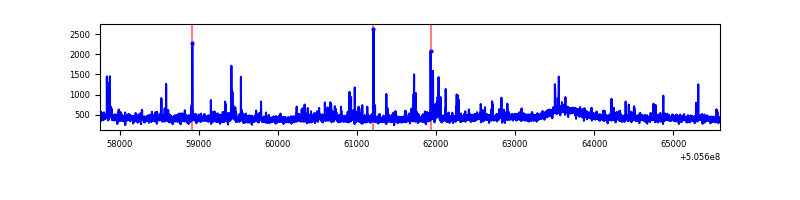 |
| C | 7839 | 7839 | 187 | 187 | 2.39% | 2.39% | 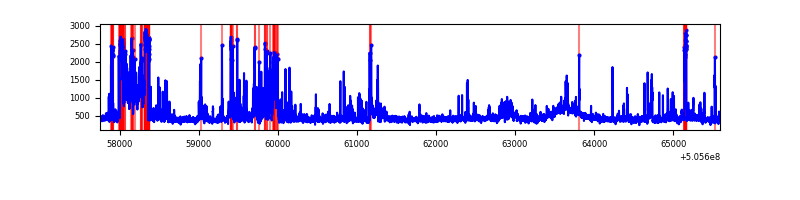 |
| D | 7839 | 7839 | 487 | 487 | 6.21% | 6.21% | 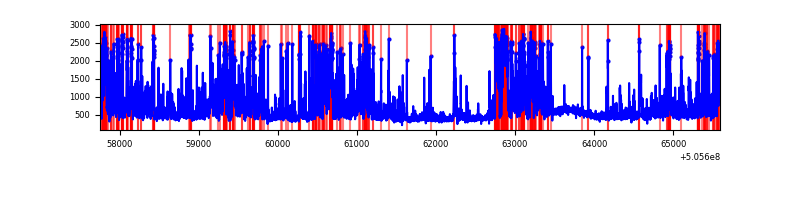 |
Top three noisy pixels from each quadrant. If the there are fewer than three noisy pixels in the level2.evt file, extra rows are filled as -1
| Pixel properties | Quadrant properties | ||||||
|---|---|---|---|---|---|---|---|
| Quadrant | DetID | PixID | Counts | Sigma | Mean | Median | Sigma |
| A | 12 | 115 | 1079662 | 5479.79 | 801 | 781 | 196.9 |
| A | 0 | 8 | 992066 | 5034.88 | 801 | 781 | 196.9 |
| A | 8 | 249 | 141862 | 716.57 | 801 | 781 | 196.9 |
| B | 5 | 185 | 89167 | 517.44 | 800 | 770 | 170.8 |
| B | 7 | 252 | 49663 | 286.2 | 800 | 770 | 170.8 |
| B | 7 | 0 | 29252 | 166.72 | 800 | 770 | 170.8 |
| C | 13 | 3 | 482782 | 2275.82 | 778 | 768 | 211.8 |
| C | 9 | 38 | 441965 | 2083.11 | 778 | 768 | 211.8 |
| C | 15 | 148 | 174677 | 821.11 | 778 | 768 | 211.8 |
| D | 11 | 129 | 1075987 | 4907.67 | 773 | 739 | 219.1 |
| D | 8 | 245 | 882198 | 4023.18 | 773 | 739 | 219.1 |
| D | 8 | 160 | 223471 | 1016.6 | 773 | 739 | 219.1 |
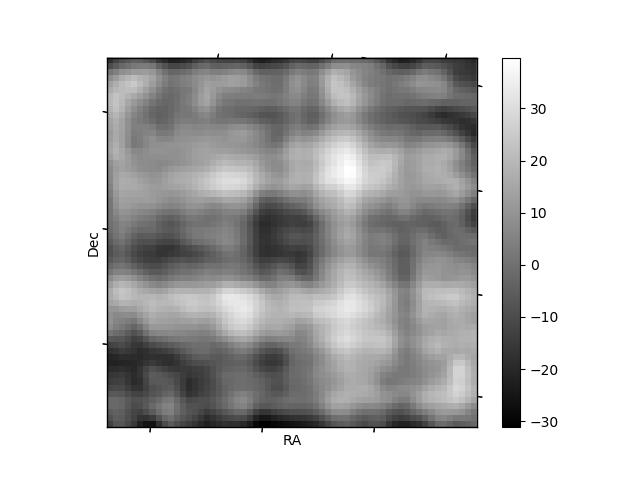
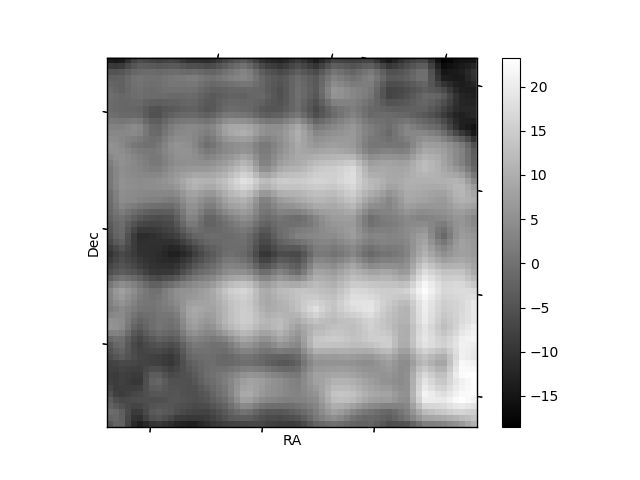
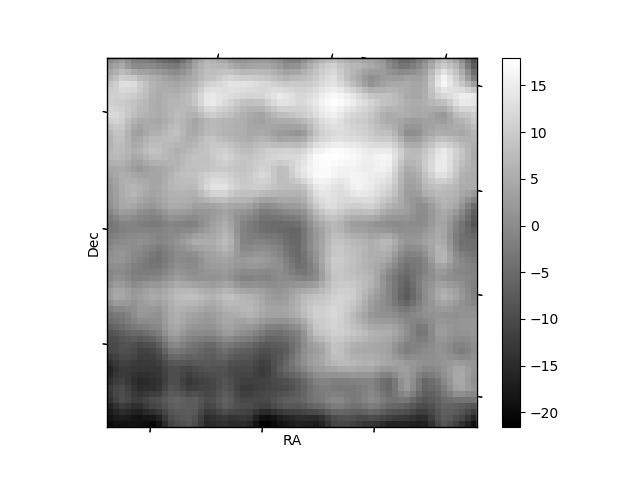
Histogram calculated using DETX and DETY for each event in the final _common_clean file
| Quadrant A | 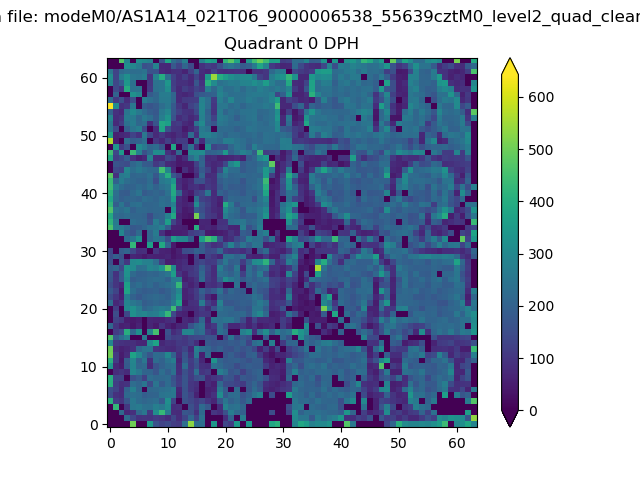 |
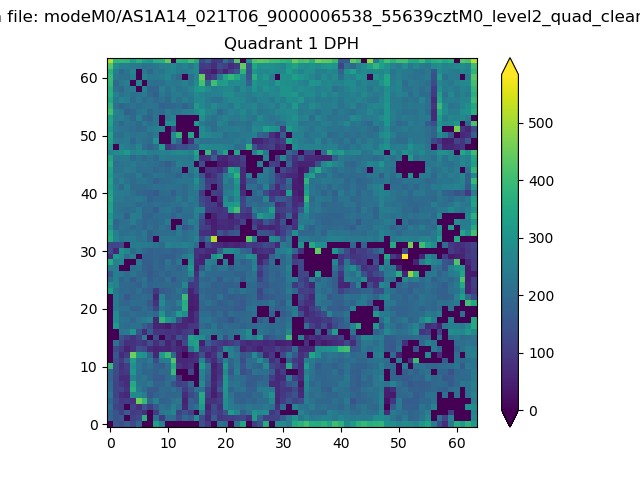 |
Quadrant B |
|---|---|---|---|
| Quadrant D | 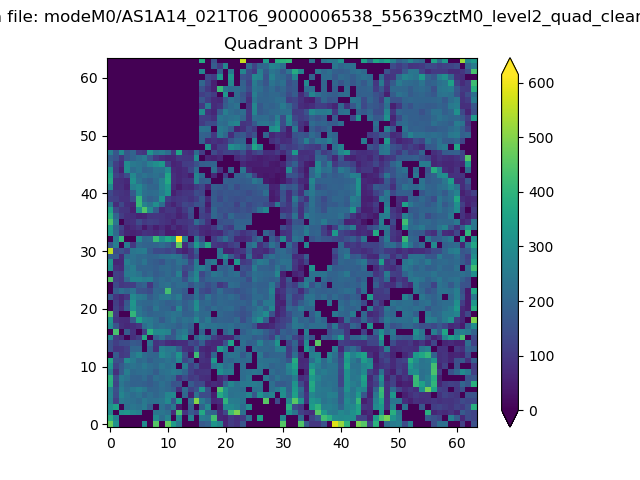 |
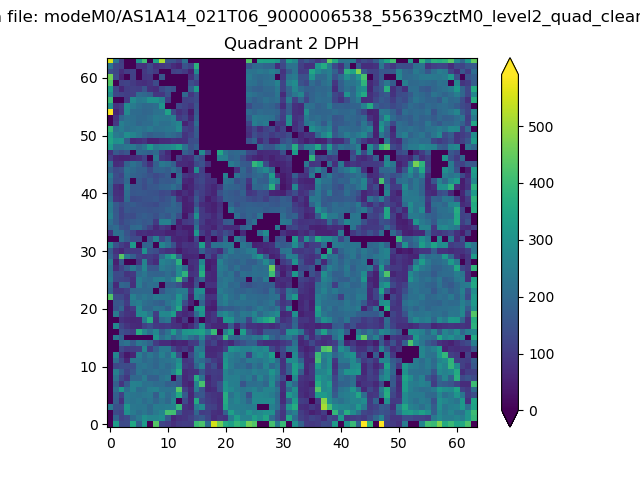 |
Quadrant C |
| Plot type | Count rate plots | Images |
|---|---|---|
| Comparison with Poisson distribution Blue bars denote a histogram of data divided into 1 sec bins. Red curve is a Poisson curve with rate = median count rate of data. |
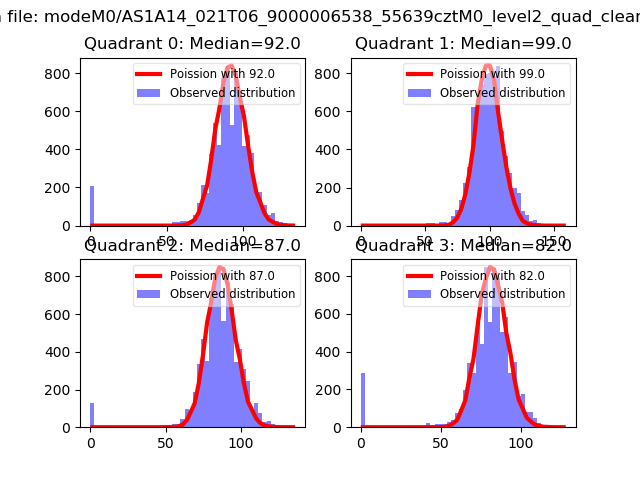 |
 |
| Quadrant-wise count rates Data is divided into 100 sec bins |
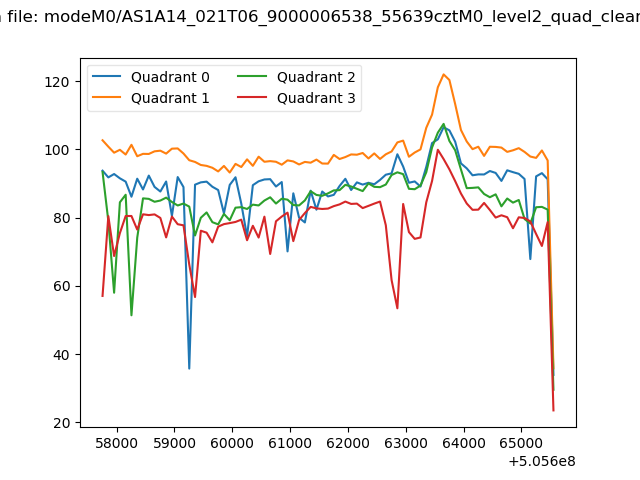 |
|
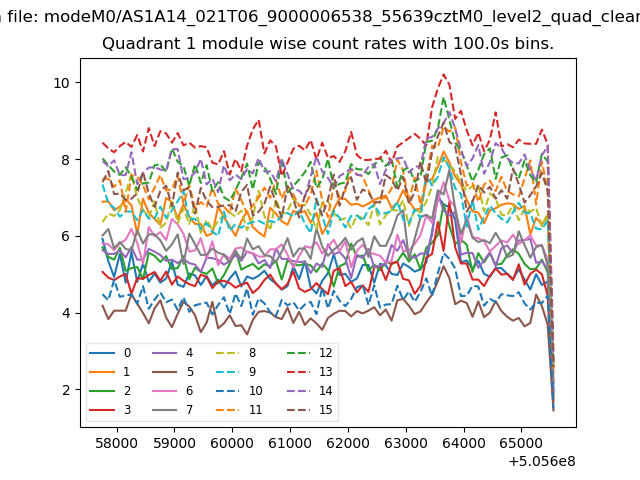
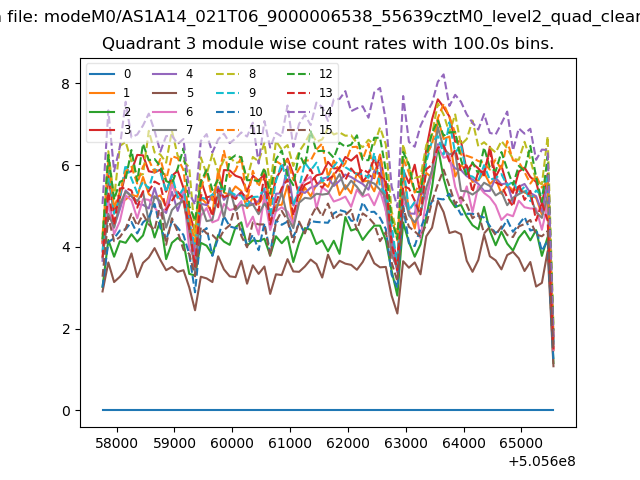
| Module-wise count rates for Quadrant A Data is divided into 100 sec bins |
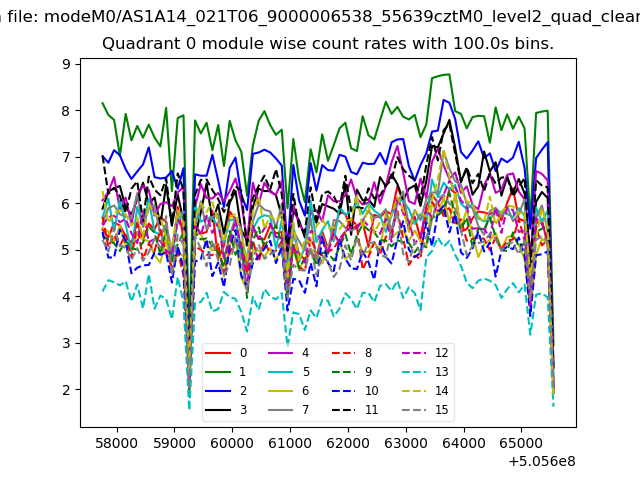 |
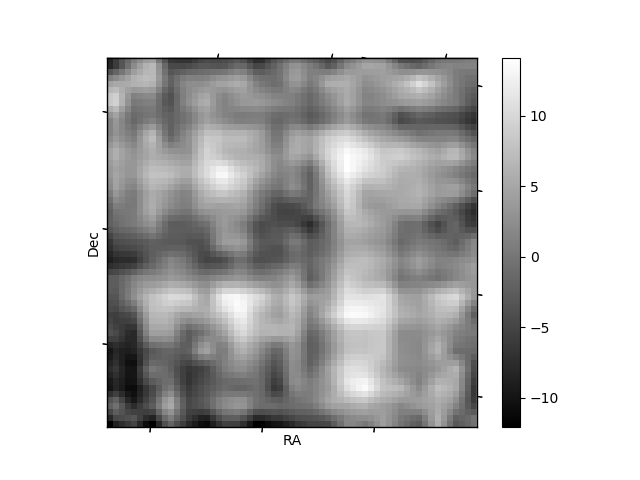 |
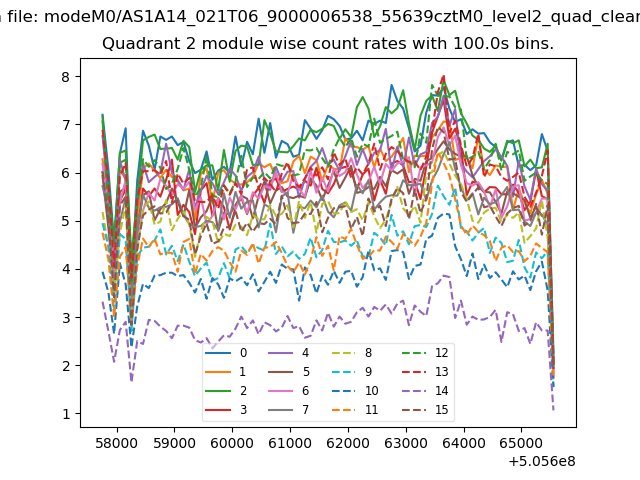
| Module-wise count rates for Quadrant B Data is divided into 100 sec bins |
 |
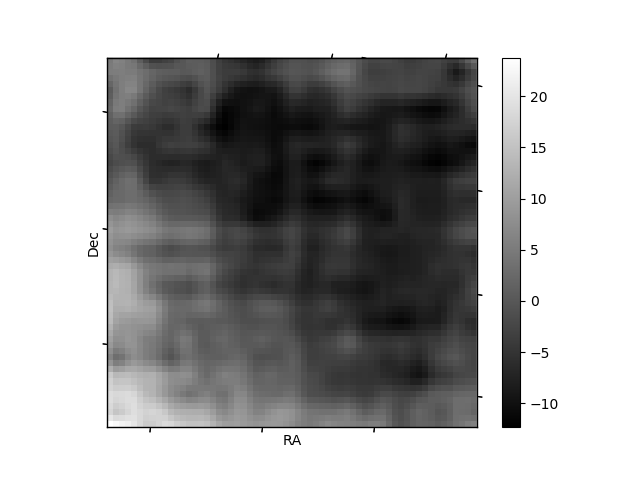 |
| Module-wise count rates for Quadrant C Data is divided into 100 sec bins |
 |
 |
| Module-wise count rates for Quadrant D Data is divided into 100 sec bins |
 |
 |
| Parameter | Plot |
|---|---|
| CZT HV Monitor | 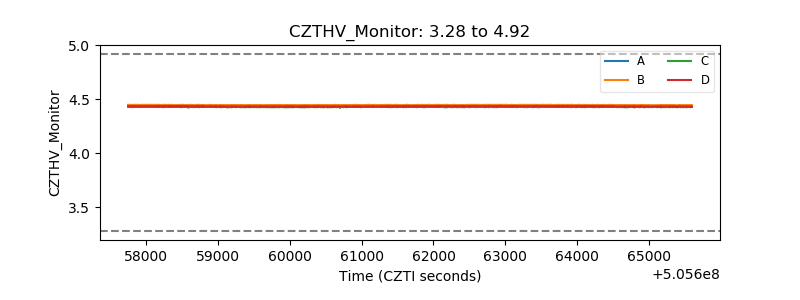 |
| D_VDD | 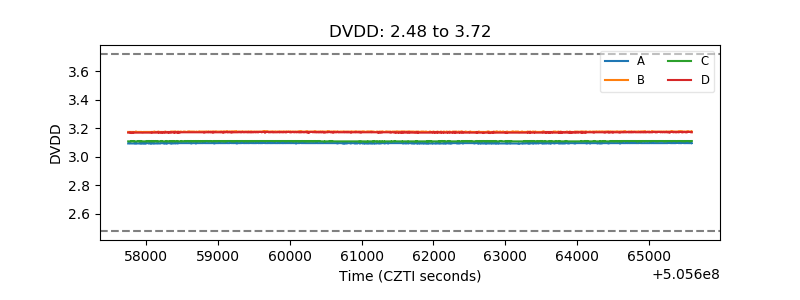 |
| Temperature 1 | 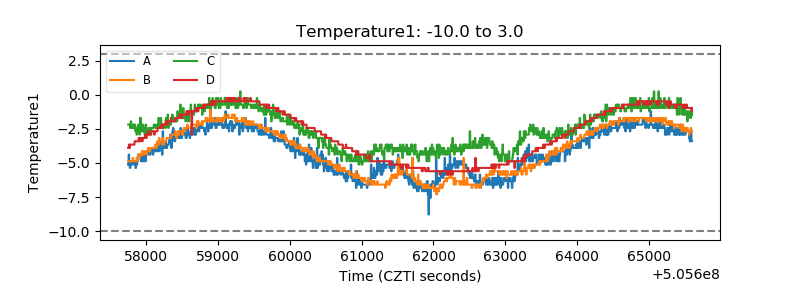 |
| Veto HV Monitor | 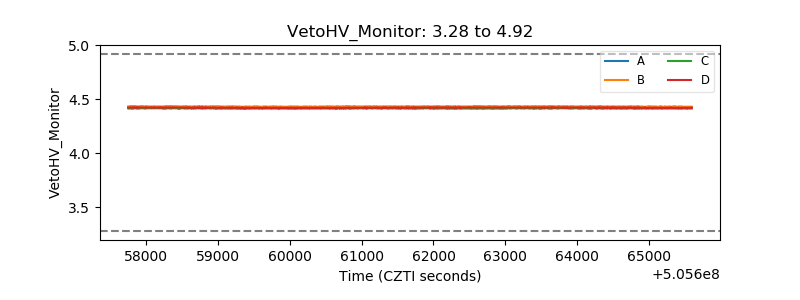 |
| Veto LLD | 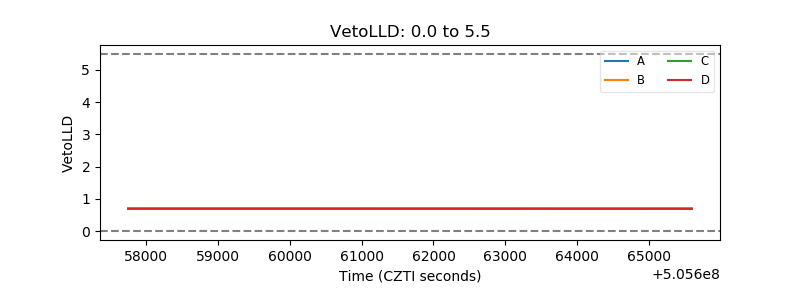 |
| Alpha Counter | 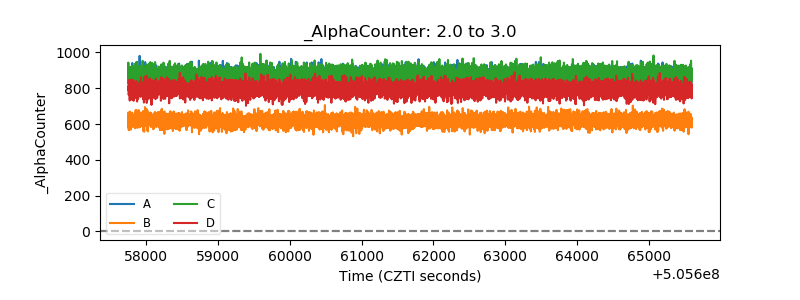 |
| _CPM_Rate | 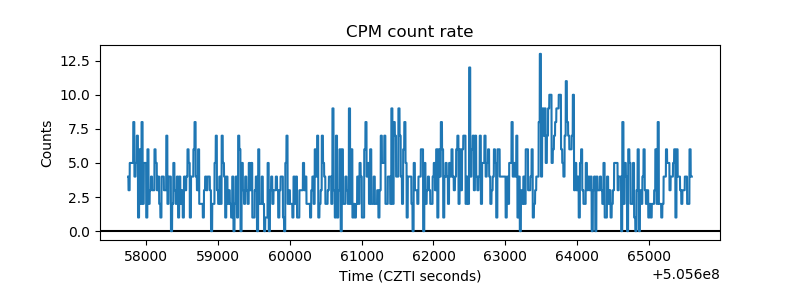 |
| CZT Counter | 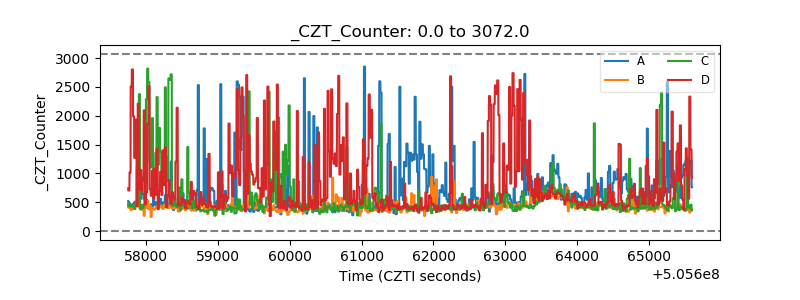 |
| +2.5 Volts monitor | 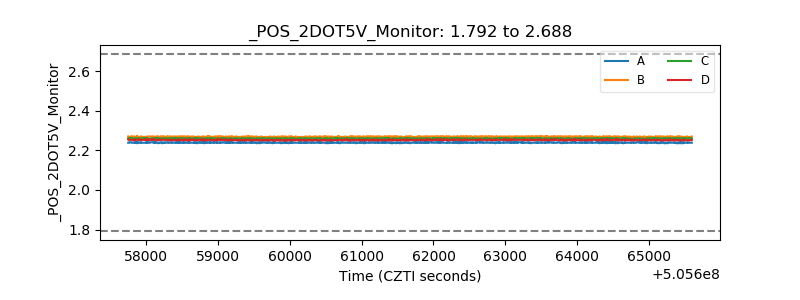 |
| +5 Volts monitor | 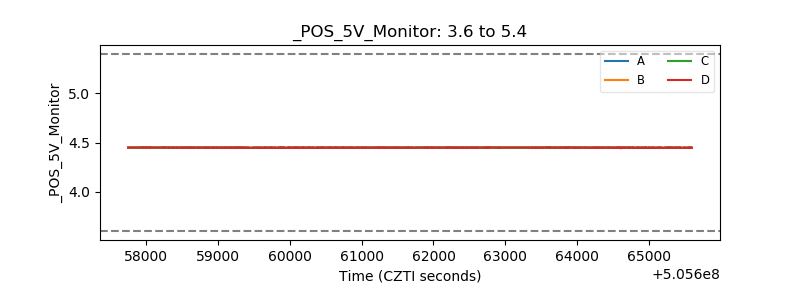 |
| _ROLL_ROT | 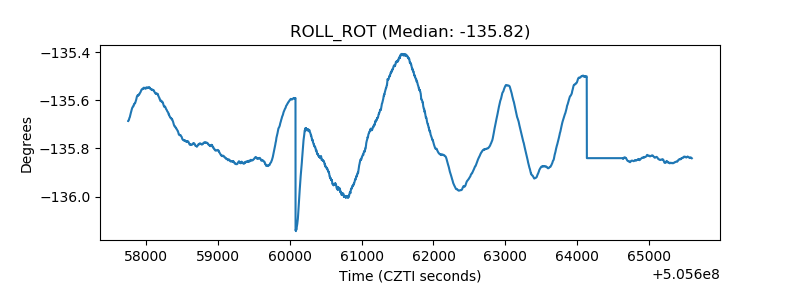 |
| _Roll_DEC | 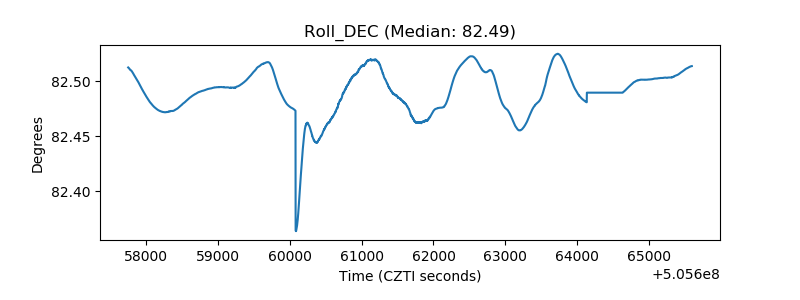 |
| _Roll_RA | 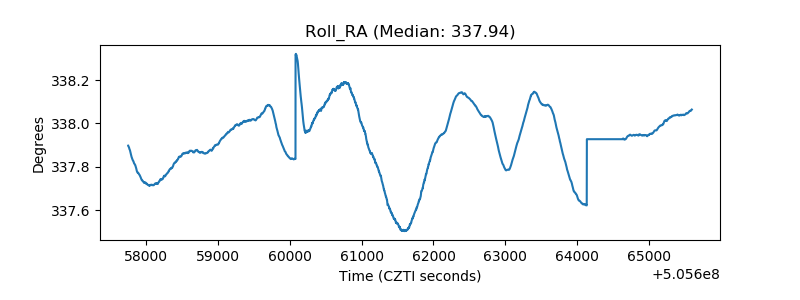 |
| Veto Counter | 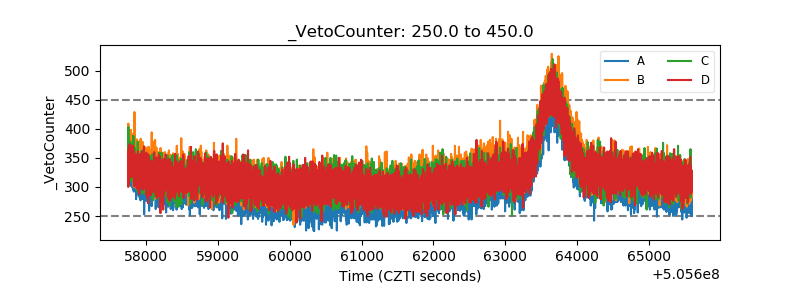 |