| Param | Original file | Final file |
|---|---|---|
| Filename | modeM0/AS1A14_021T06_9000006538_55640cztM0_level2.fits | modeM0/AS1A14_021T06_9000006538_55640cztM0_level2_quad_clean.evt |
| Size (bytes) | 452,280,960 | 99,385,920 |
| Size | 431.3 MB | 94.8 MB |
| Events in quadrant A | 4,270,674 | 649,146 |
| Events in quadrant B | 3,071,071 | 702,881 |
| Events in quadrant C | 3,342,328 | 610,005 |
| Events in quadrant D | 5,507,935 | 554,282 |
| Mode M0 | |||
|---|---|---|---|
| Quadrant | BADHDUFLAG | Total packets | Discarded packets |
| A | 0 | 17743 | 0 |
| B | 0 | 14600 | 0 |
| C | 0 | 15428 | 0 |
| D | 0 | 21298 | 3 |
| Mode SS | |||
|---|---|---|---|
| Quadrant | BADHDUFLAG | Total packets | Discarded packets |
| A | 0 | 142 | 0 |
| B | 0 | 142 | 0 |
| C | 0 | 142 | 0 |
| D | 0 | 142 | 0 |
| Quadrant | Total seconds | Saturated seconds | Saturation percentage |
|---|---|---|---|
| A | 7077 | 75 | 1.059771% |
| B | 7078 | 20 | 0.282566% |
| C | 7078 | 79 | 1.116135% |
| D | 7077 | 441 | 6.231454% |
Noise dominated data is calculated using 1-second bins in cleaned event files. If a bin has >2000 counts, and if more than 50% of those come from <1% of pixels, then it is considered to be noise-dominated and hence unusable.
| Quadrant | # 1 sec bins | Bins with >0 counts | Bins with >2000 counts | High rate bins dominated by noise | Noise dominated (total time) | Noise dominated (detector-on time) | Marked lightcurve |
|---|---|---|---|---|---|---|---|
| A | 7076 | 7076 | 63 | 63 | 0.89% | 0.89% | 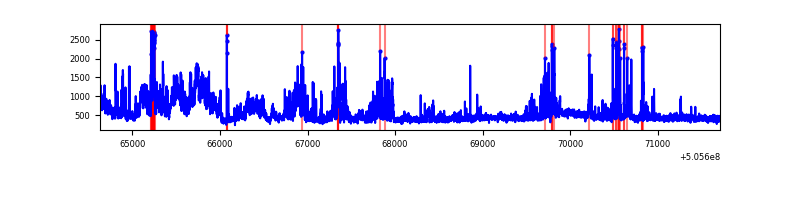 |
| B | 7077 | 7077 | 6 | 6 | 0.08% | 0.08% | 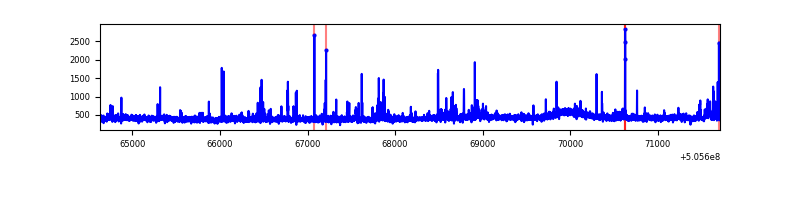 |
| C | 7077 | 7077 | 83 | 83 | 1.17% | 1.17% | 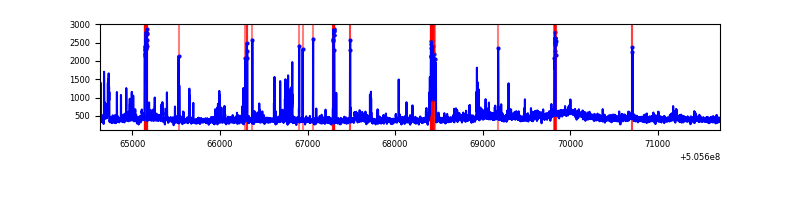 |
| D | 7076 | 7076 | 502 | 502 | 7.09% | 7.09% | 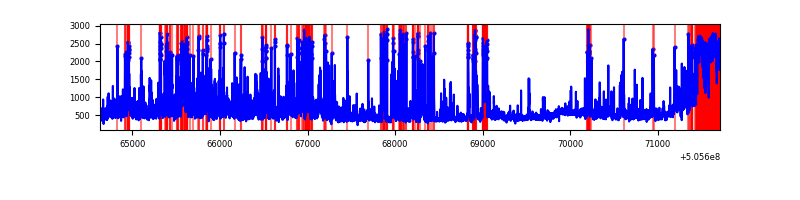 |
Top three noisy pixels from each quadrant. If the there are fewer than three noisy pixels in the level2.evt file, extra rows are filled as -1
| Pixel properties | Quadrant properties | ||||||
|---|---|---|---|---|---|---|---|
| Quadrant | DetID | PixID | Counts | Sigma | Mean | Median | Sigma |
| A | 12 | 115 | 702484 | 3920.07 | 723 | 705 | 179.0 |
| A | 8 | 249 | 345651 | 1926.83 | 723 | 705 | 179.0 |
| A | 0 | 8 | 174763 | 972.27 | 723 | 705 | 179.0 |
| B | 0 | 171 | 77554 | 492.49 | 720 | 691 | 156.1 |
| B | 10 | 247 | 43940 | 277.11 | 720 | 691 | 156.1 |
| B | 7 | 252 | 26488 | 165.29 | 720 | 691 | 156.1 |
| C | 9 | 38 | 286731 | 1479.6 | 703 | 694 | 193.3 |
| C | 12 | 250 | 68063 | 348.48 | 703 | 694 | 193.3 |
| C | 13 | 3 | 42841 | 218.02 | 703 | 694 | 193.3 |
| D | 8 | 245 | 1019990 | 5209.19 | 693 | 664 | 195.7 |
| D | 11 | 129 | 984667 | 5028.67 | 693 | 664 | 195.7 |
| D | 3 | 12 | 252907 | 1289.07 | 693 | 664 | 195.7 |
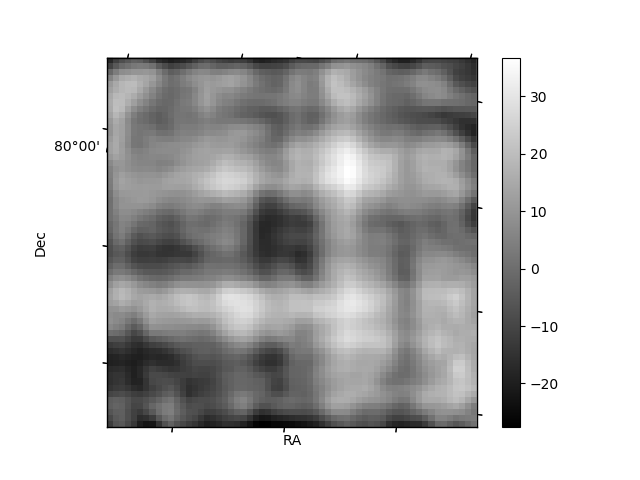
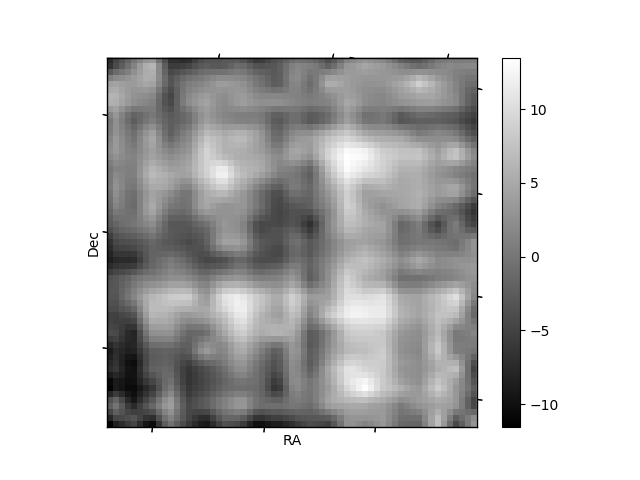
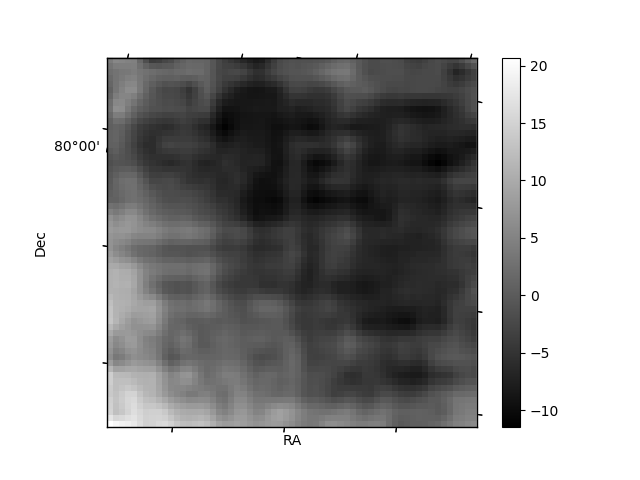
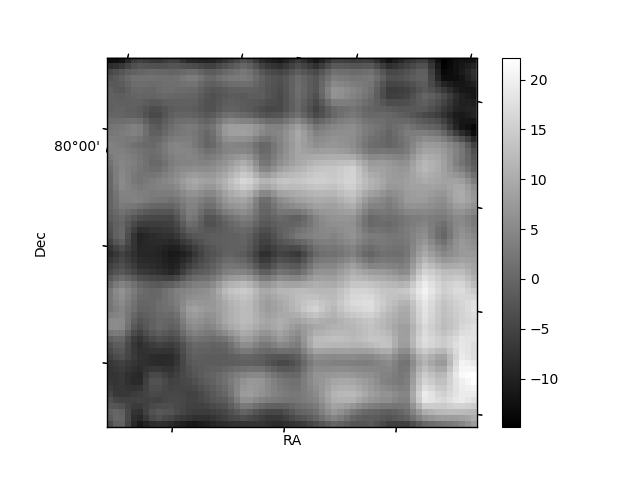
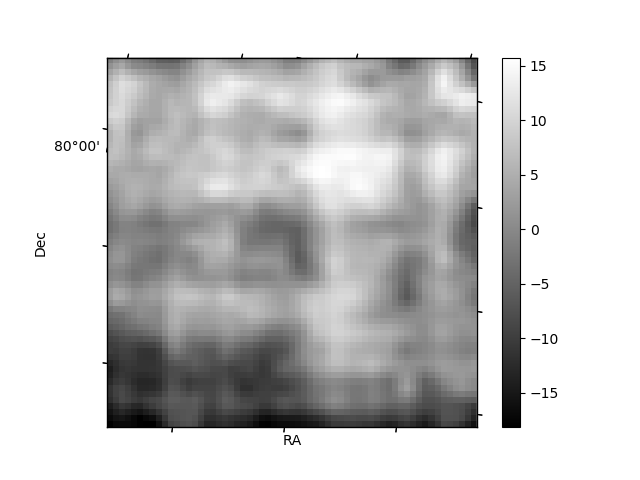
Histogram calculated using DETX and DETY for each event in the final _common_clean file
| Quadrant A | 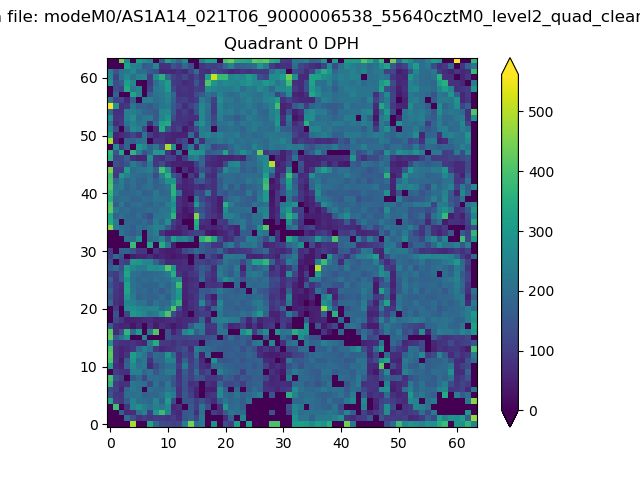 |
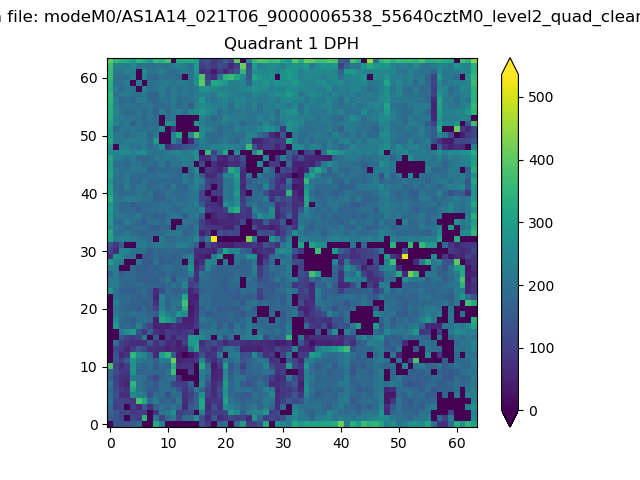 |
Quadrant B |
|---|---|---|---|
| Quadrant D | 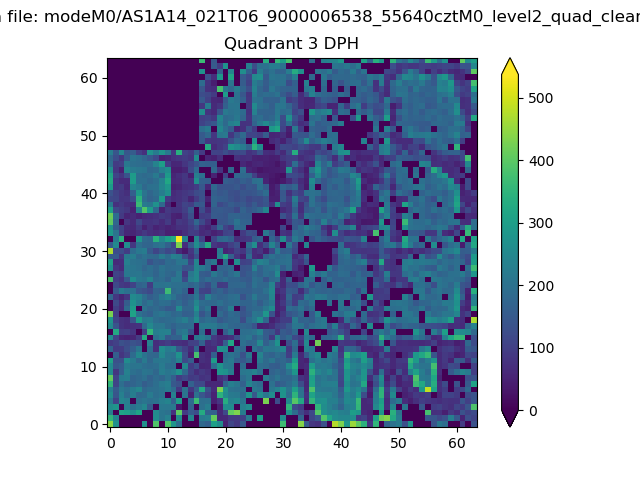 |
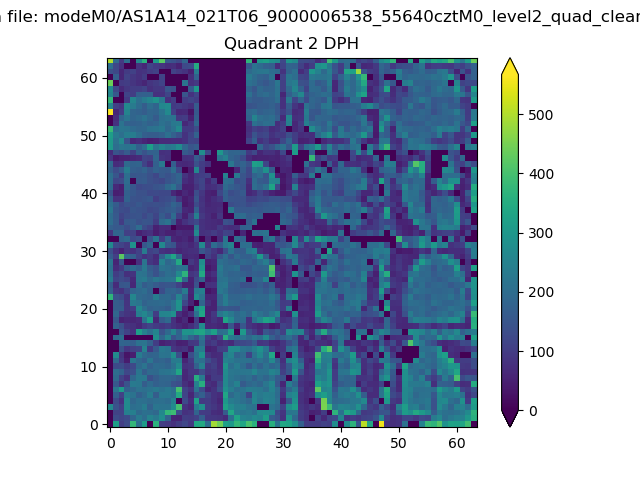 |
Quadrant C |
| Plot type | Count rate plots | Images |
|---|---|---|
| Comparison with Poisson distribution Blue bars denote a histogram of data divided into 1 sec bins. Red curve is a Poisson curve with rate = median count rate of data. |
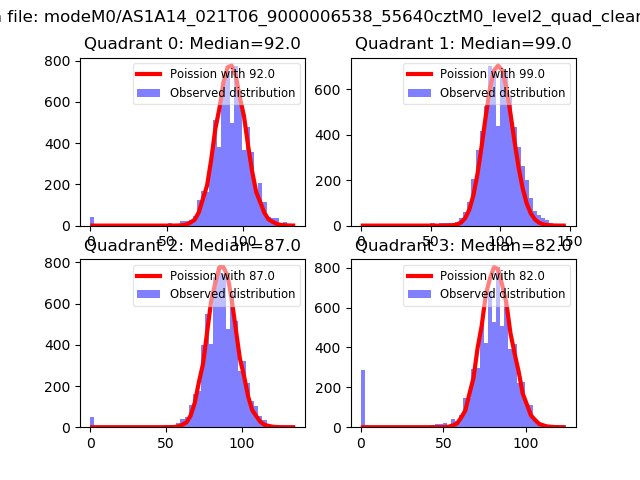 |
 |
| Quadrant-wise count rates Data is divided into 100 sec bins |
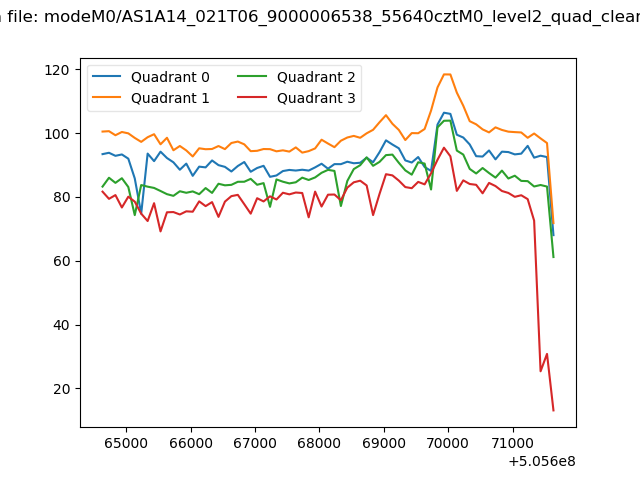 |
|
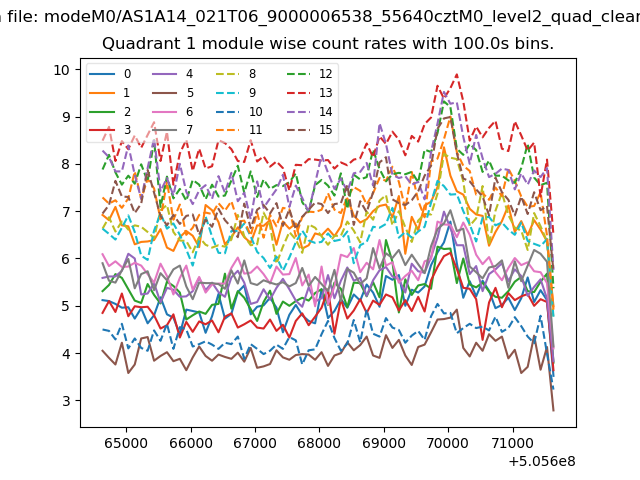
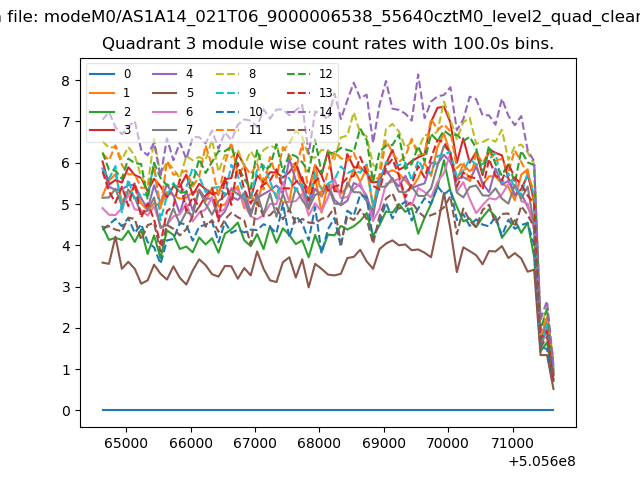
| Module-wise count rates for Quadrant A Data is divided into 100 sec bins |
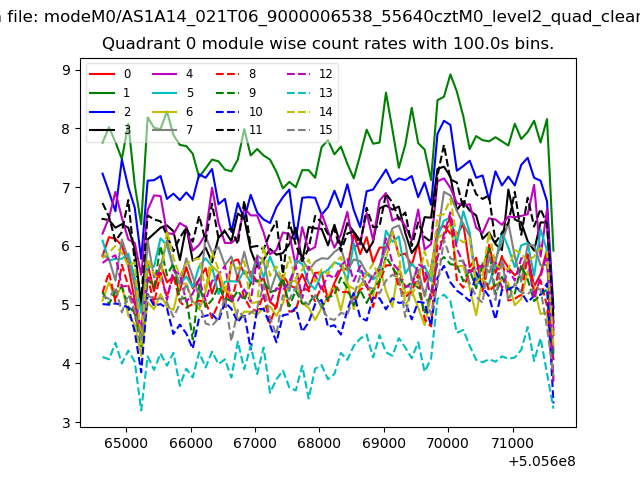 |
 |
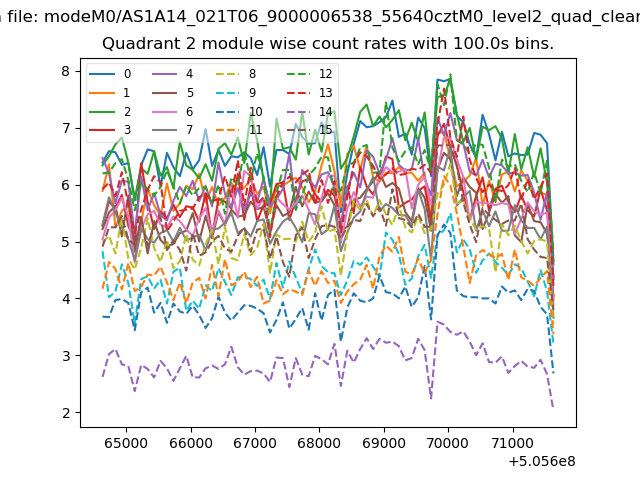
| Module-wise count rates for Quadrant B Data is divided into 100 sec bins |
 |
 |
| Module-wise count rates for Quadrant C Data is divided into 100 sec bins |
 |
 |
| Module-wise count rates for Quadrant D Data is divided into 100 sec bins |
 |
 |
| Parameter | Plot |
|---|---|
| CZT HV Monitor | 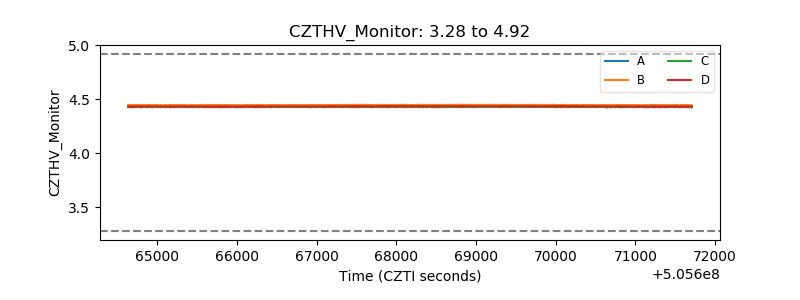 |
| D_VDD | 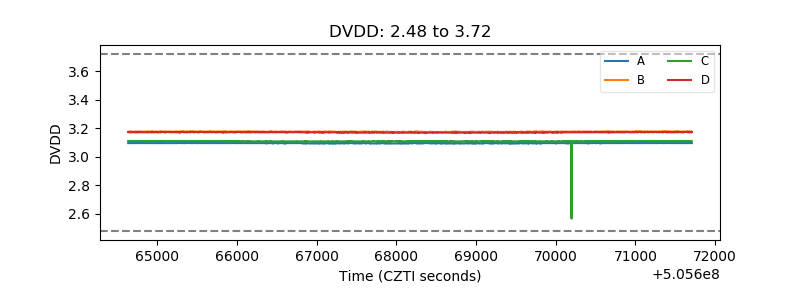 |
| Temperature 1 | 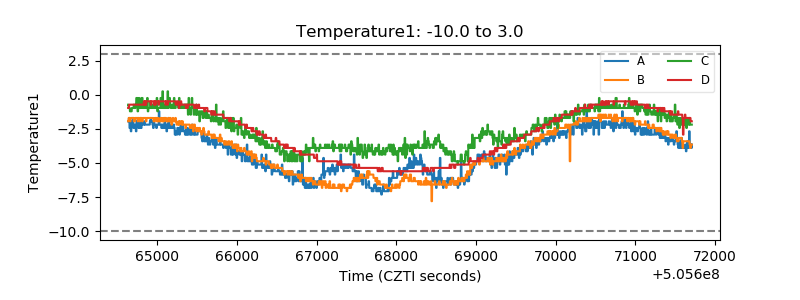 |
| Veto HV Monitor | 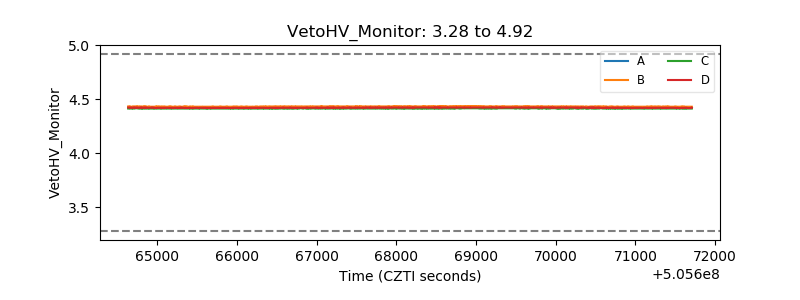 |
| Veto LLD | 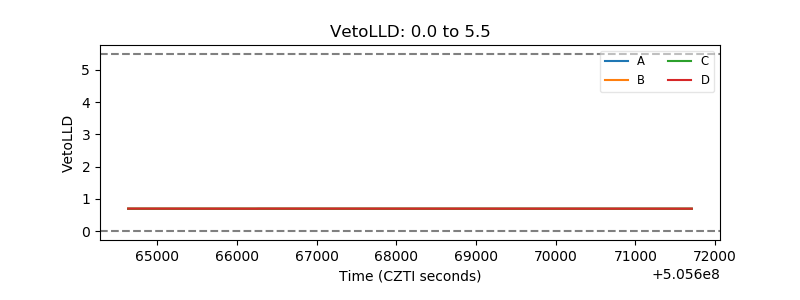 |
| Alpha Counter | 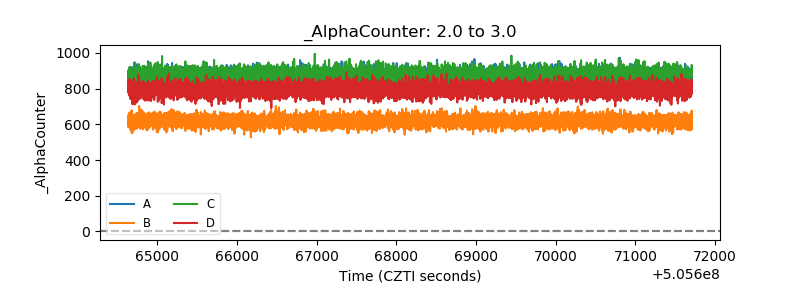 |
| _CPM_Rate | 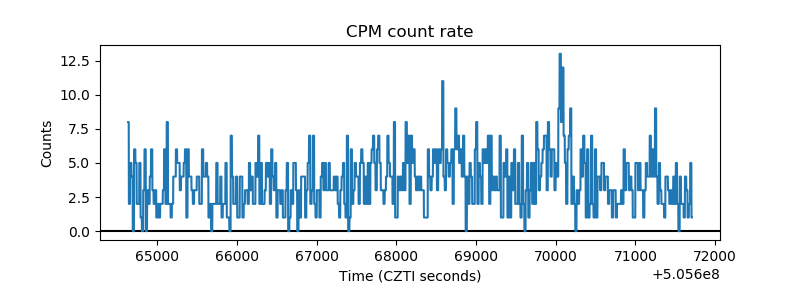 |
| CZT Counter | 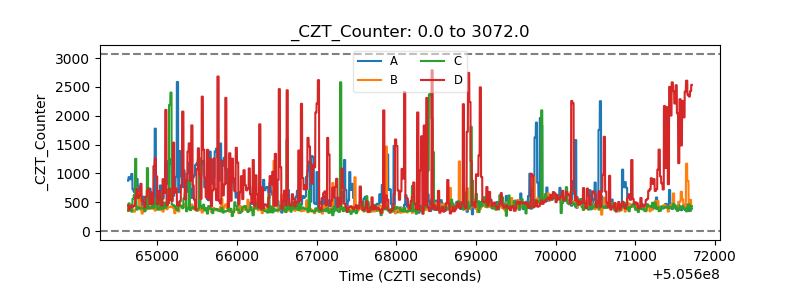 |
| +2.5 Volts monitor | 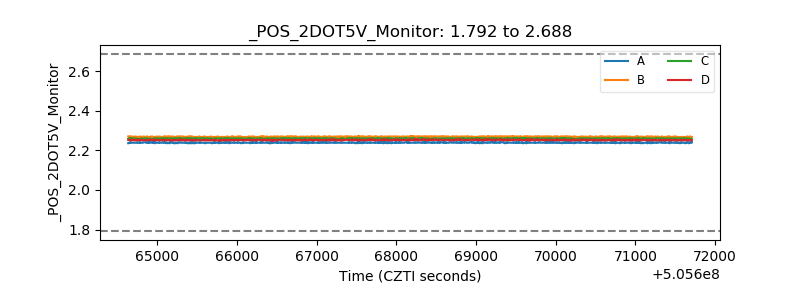 |
| +5 Volts monitor | 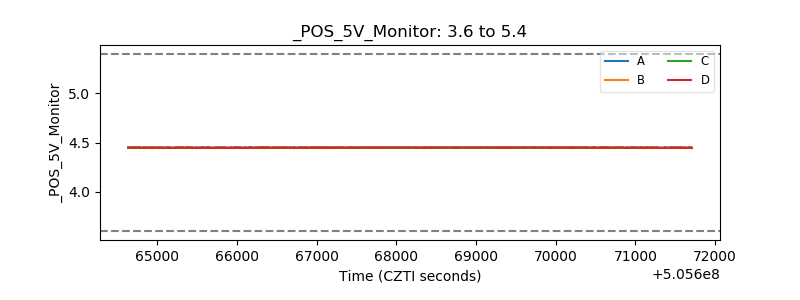 |
| _ROLL_ROT | 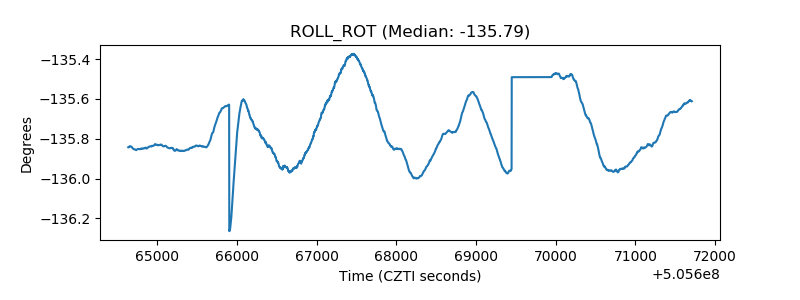 |
| _Roll_DEC | 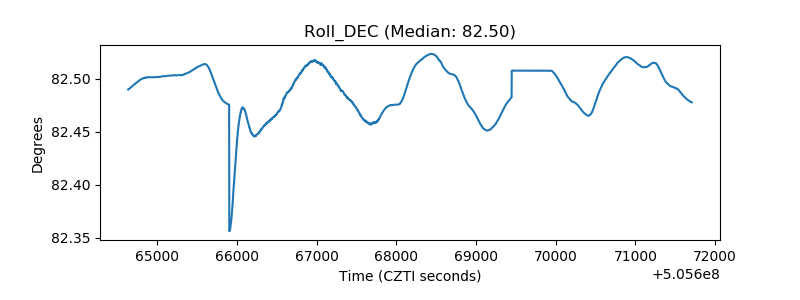 |
| _Roll_RA | 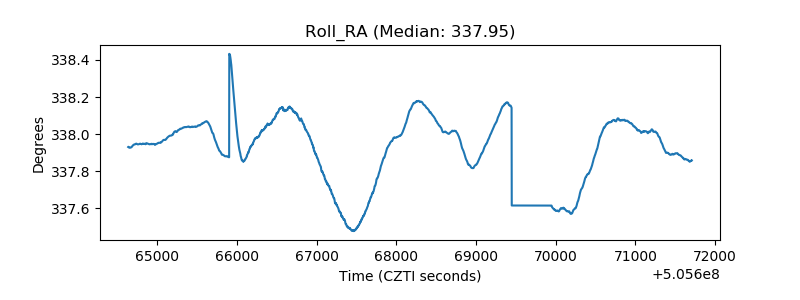 |
| Veto Counter | 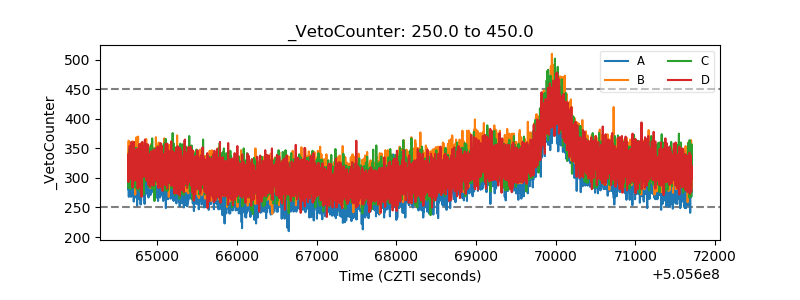 |