| Param | Original file | Final file |
|---|---|---|
| Filename | modeM0/AS1A14_021T06_9000006538_55644cztM0_level2.fits | modeM0/AS1A14_021T06_9000006538_55644cztM0_level2_quad_clean.evt |
| Size (bytes) | 1,751,785,920 | 345,404,160 |
| Size | 1.6 GB | 329.4 MB |
| Events in quadrant A | 19,690,399 | 2,092,363 |
| Events in quadrant B | 11,445,045 | 2,467,784 |
| Events in quadrant C | 11,519,909 | 2,193,868 |
| Events in quadrant D | 20,252,987 | 1,980,396 |
| Mode M9 | |||
|---|---|---|---|
| Quadrant | BADHDUFLAG | Total packets | Discarded packets |
| A | 0 | 17 | 0 |
| B | 0 | 17 | 0 |
| C | 0 | 17 | 0 |
| D | 0 | 17 | 0 |
| Mode M0 | |||
|---|---|---|---|
| Quadrant | BADHDUFLAG | Total packets | Discarded packets |
| A | 0 | 76547 | 3 |
| B | 0 | 53264 | 3 |
| C | 0 | 53991 | 3 |
| D | 0 | 77888 | 3 |
| Mode SS | |||
|---|---|---|---|
| Quadrant | BADHDUFLAG | Total packets | Discarded packets |
| A | 0 | 508 | 0 |
| B | 0 | 508 | 0 |
| C | 0 | 508 | 0 |
| D | 0 | 508 | 0 |
| Quadrant | Total seconds | Saturated seconds | Saturation percentage |
|---|---|---|---|
| A | 25042 | 2624 | 10.478396% |
| B | 25042 | 288 | 1.150068% |
| C | 25042 | 200 | 0.798658% |
| D | 25043 | 1763 | 7.039891% |
Noise dominated data is calculated using 1-second bins in cleaned event files. If a bin has >2000 counts, and if more than 50% of those come from <1% of pixels, then it is considered to be noise-dominated and hence unusable.
| Quadrant | # 1 sec bins | Bins with >0 counts | Bins with >2000 counts | High rate bins dominated by noise | Noise dominated (total time) | Noise dominated (detector-on time) | Marked lightcurve |
|---|---|---|---|---|---|---|---|
| A | 26782 | 25044 | 2415 | 2415 | 9.02% | 9.64% | 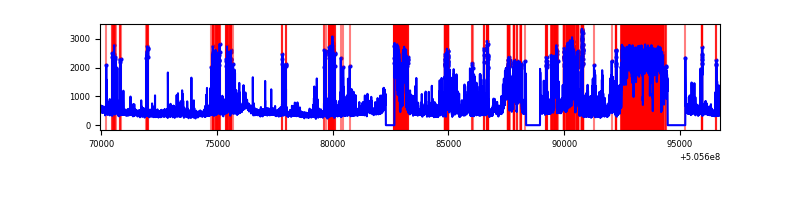 |
| B | 26783 | 25045 | 100 | 100 | 0.37% | 0.40% | 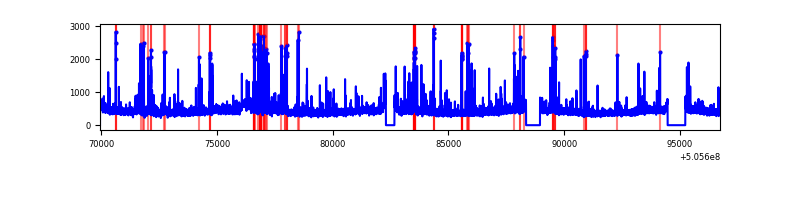 |
| C | 26783 | 25045 | 125 | 125 | 0.47% | 0.50% | 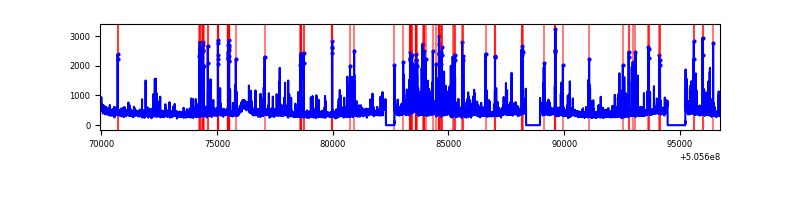 |
| D | 26783 | 25045 | 1886 | 1886 | 7.04% | 7.53% | 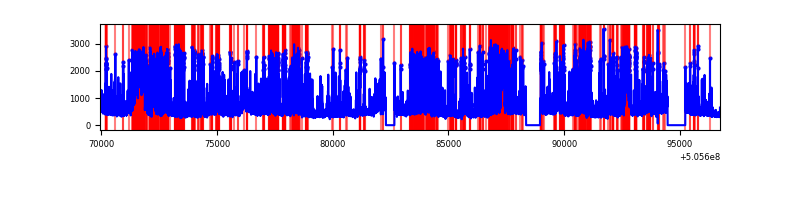 |
Top three noisy pixels from each quadrant. If the there are fewer than three noisy pixels in the level2.evt file, extra rows are filled as -1
| Pixel properties | Quadrant properties | ||||||
|---|---|---|---|---|---|---|---|
| Quadrant | DetID | PixID | Counts | Sigma | Mean | Median | Sigma |
| A | 12 | 115 | 6585671 | 10677.74 | 2502 | 2442 | 616.5 |
| A | 8 | 249 | 1446090 | 2341.54 | 2502 | 2442 | 616.5 |
| A | 0 | 8 | 630185 | 1018.18 | 2502 | 2442 | 616.5 |
| B | 0 | 171 | 645361 | 1177.73 | 2557 | 2451 | 545.9 |
| B | 7 | 252 | 198095 | 358.39 | 2557 | 2451 | 545.9 |
| B | 9 | 254 | 122747 | 220.37 | 2557 | 2451 | 545.9 |
| C | 9 | 38 | 568470 | 824.91 | 2524 | 2496 | 686.1 |
| C | 13 | 3 | 413935 | 599.67 | 2524 | 2496 | 686.1 |
| C | 12 | 250 | 204794 | 294.85 | 2524 | 2496 | 686.1 |
| D | 11 | 129 | 4660622 | 6666.33 | 2469 | 2354 | 698.8 |
| D | 8 | 245 | 2959498 | 4231.89 | 2469 | 2354 | 698.8 |
| D | 3 | 12 | 555439 | 791.51 | 2469 | 2354 | 698.8 |
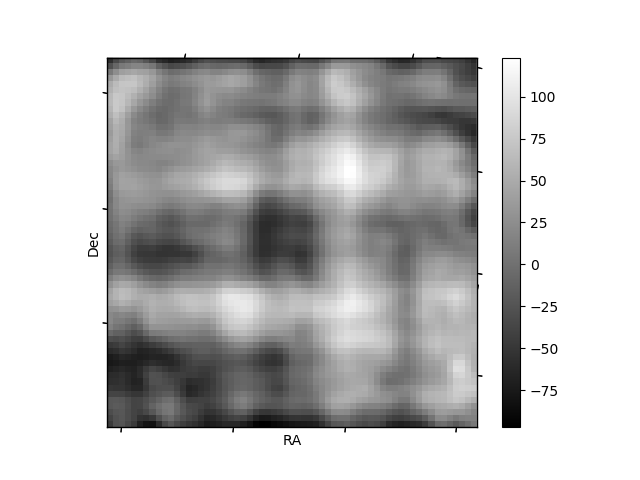
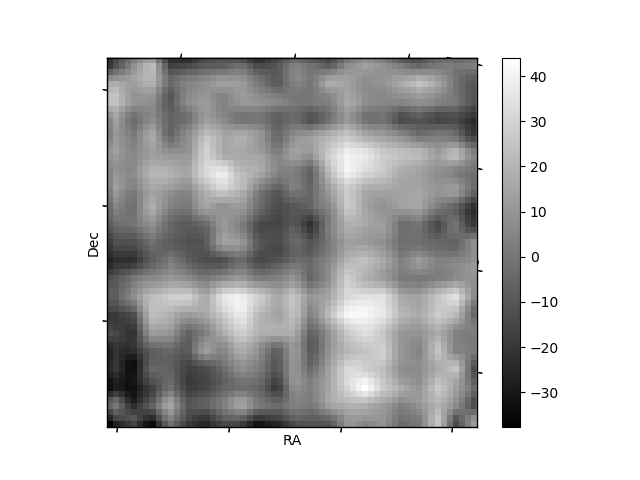
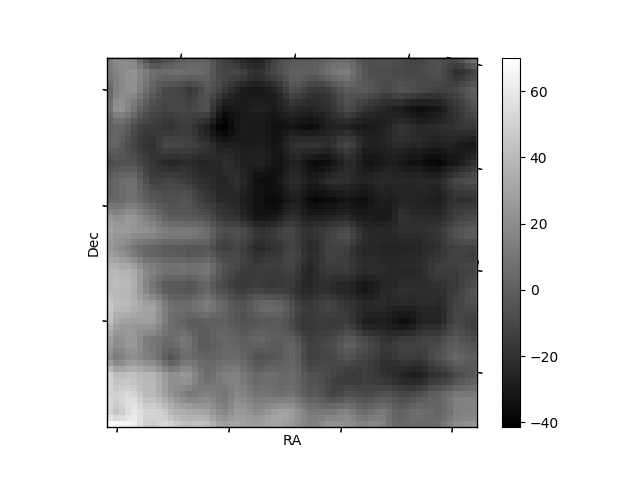
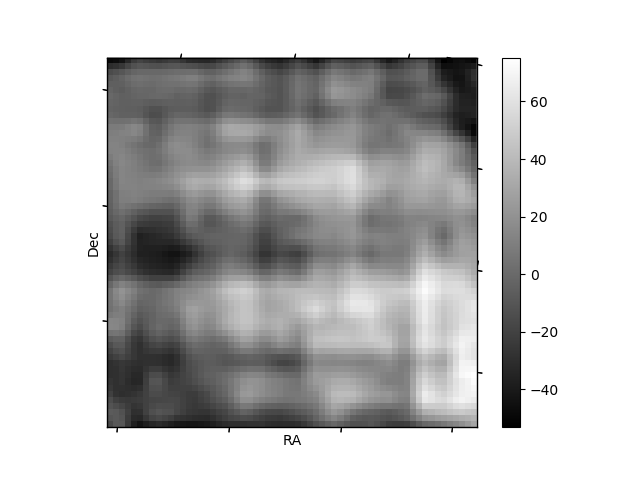
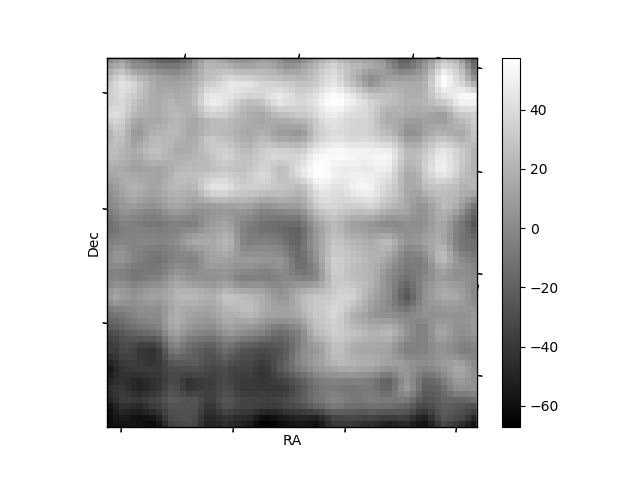
Histogram calculated using DETX and DETY for each event in the final _common_clean file
| Quadrant A | 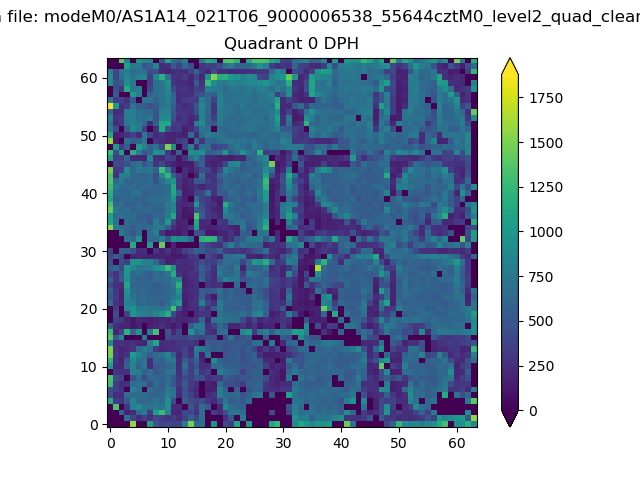 |
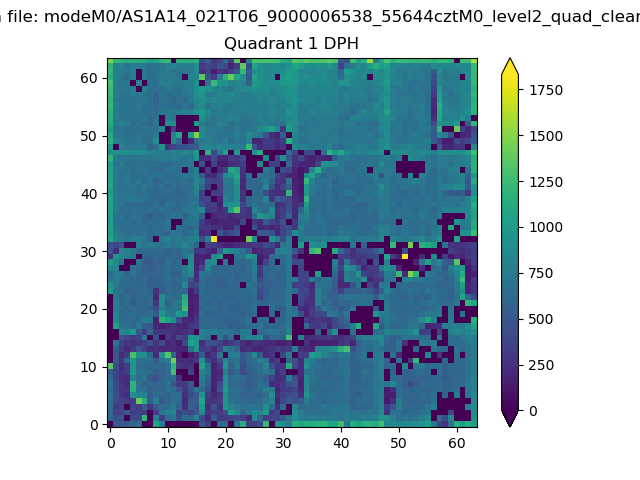 |
Quadrant B |
|---|---|---|---|
| Quadrant D | 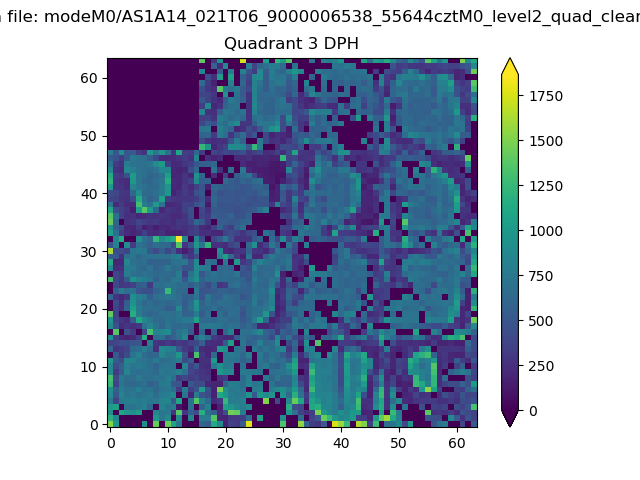 |
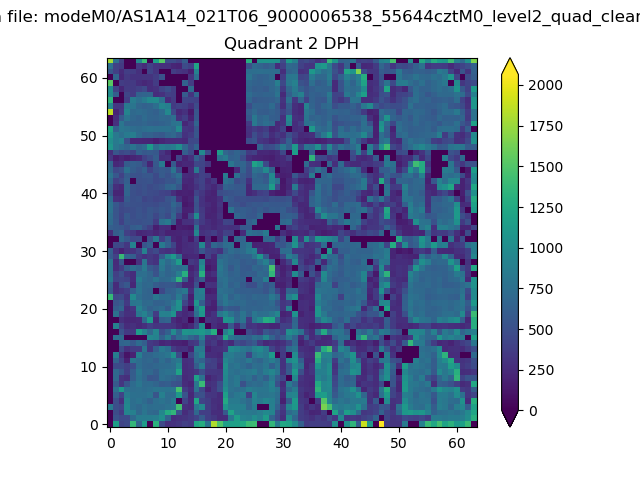 |
Quadrant C |
| Plot type | Count rate plots | Images |
|---|---|---|
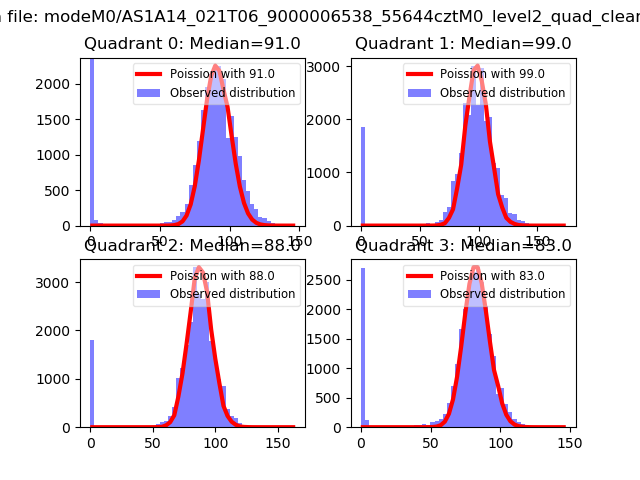
| Comparison with Poisson distribution Blue bars denote a histogram of data divided into 1 sec bins. Red curve is a Poisson curve with rate = median count rate of data. |
 |
 |
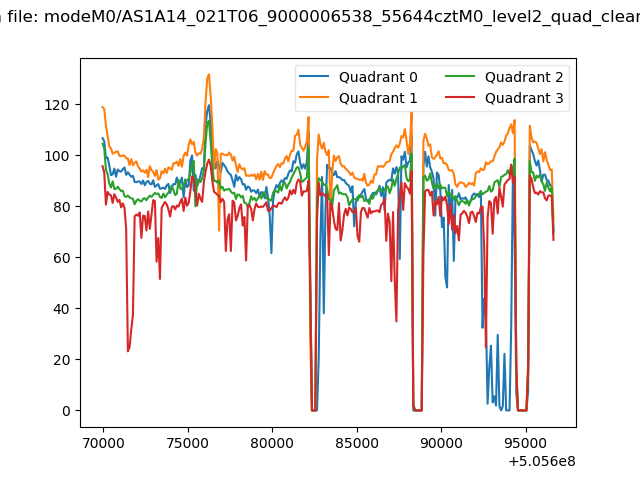
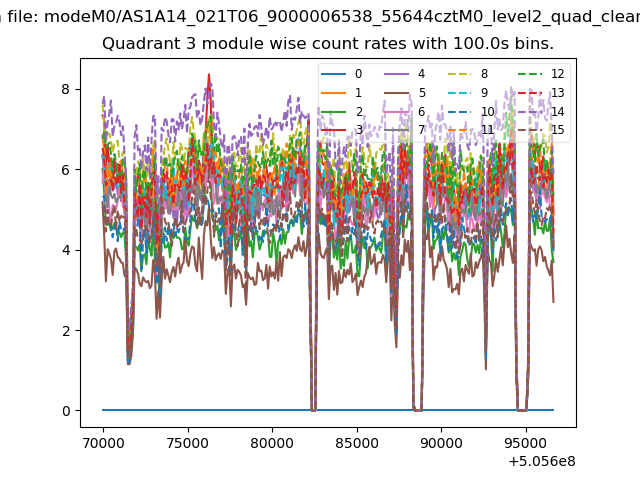
| Quadrant-wise count rates Data is divided into 100 sec bins |
 |
|
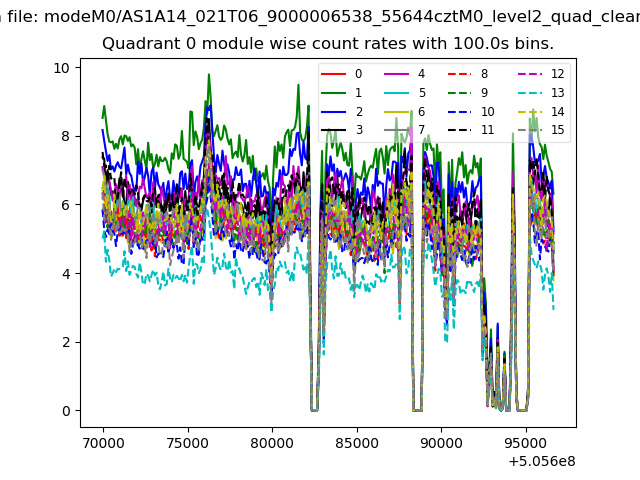
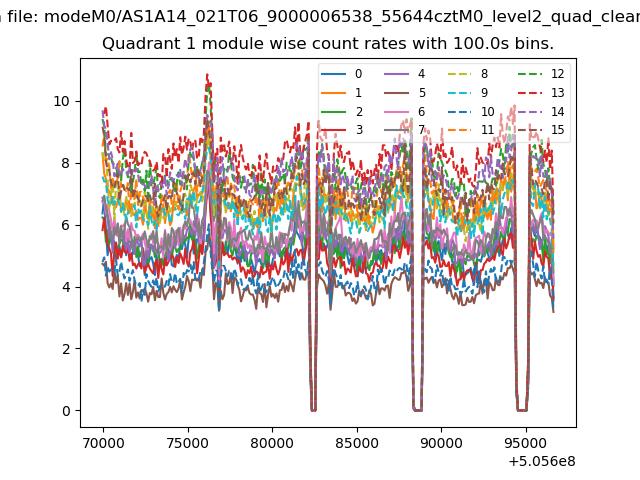
| Module-wise count rates for Quadrant A Data is divided into 100 sec bins |
 |
 |
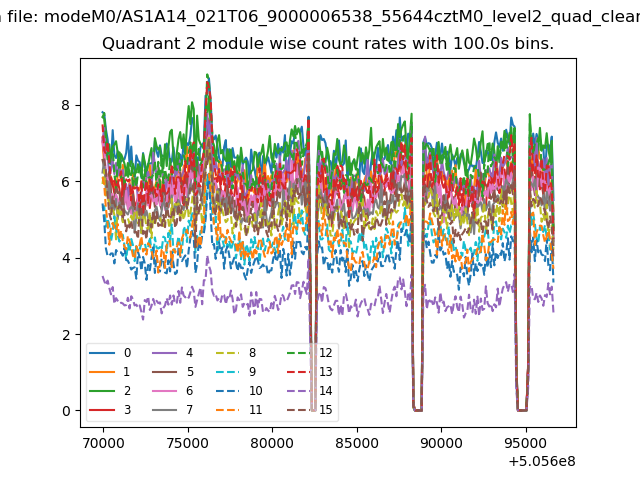
| Module-wise count rates for Quadrant B Data is divided into 100 sec bins |
 |
 |
| Module-wise count rates for Quadrant C Data is divided into 100 sec bins |
 |
 |
| Module-wise count rates for Quadrant D Data is divided into 100 sec bins |
 |
 |
| Parameter | Plot |
|---|---|
| CZT HV Monitor | 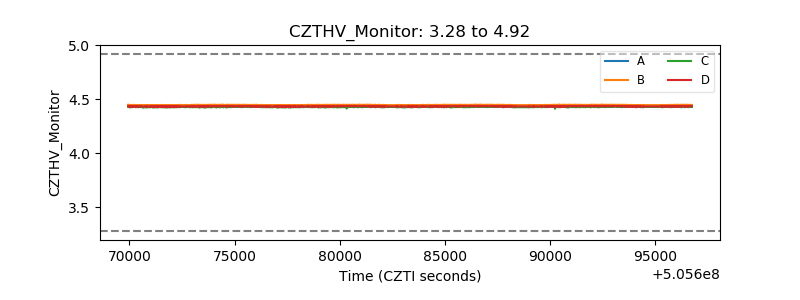 |
| D_VDD | 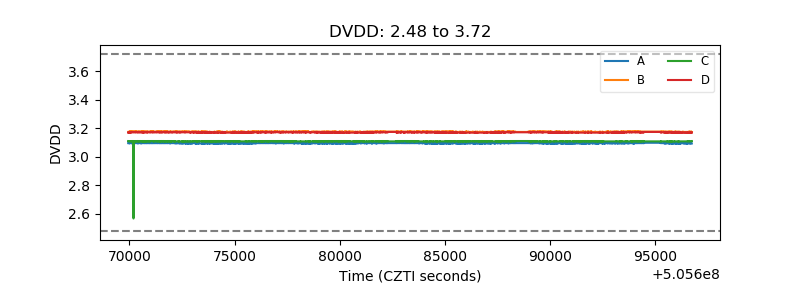 |
| Temperature 1 | 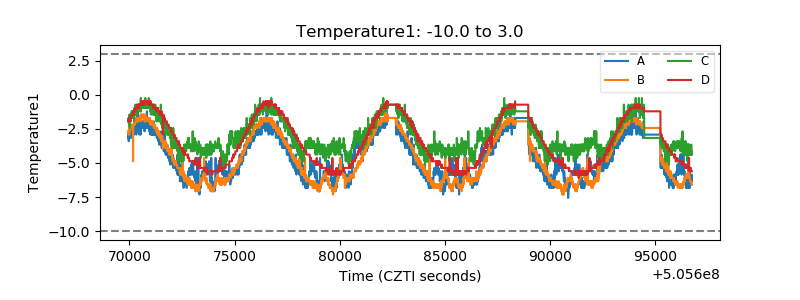 |
| Veto HV Monitor | 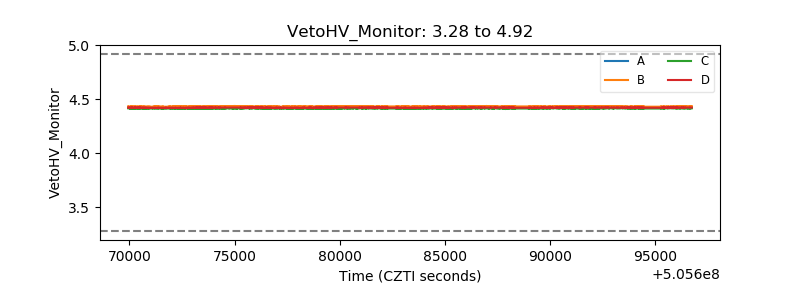 |
| Veto LLD | 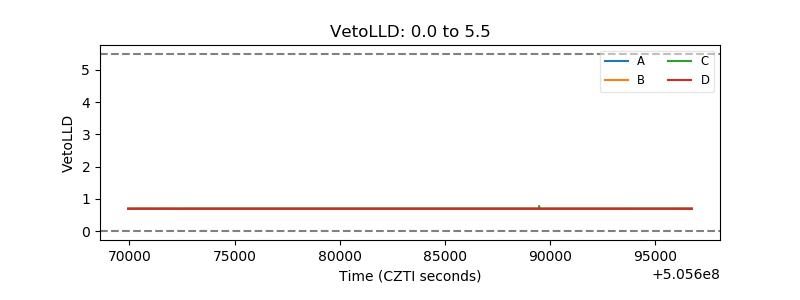 |
| Alpha Counter | 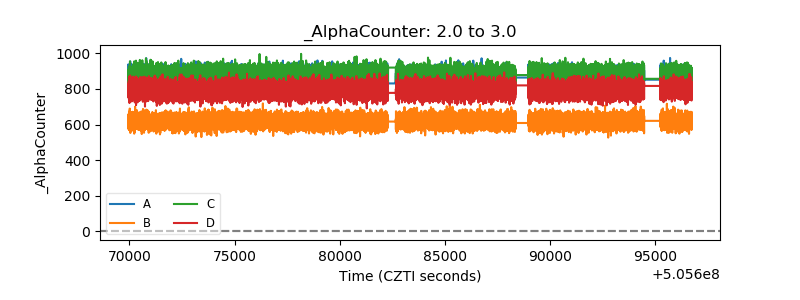 |
| _CPM_Rate | 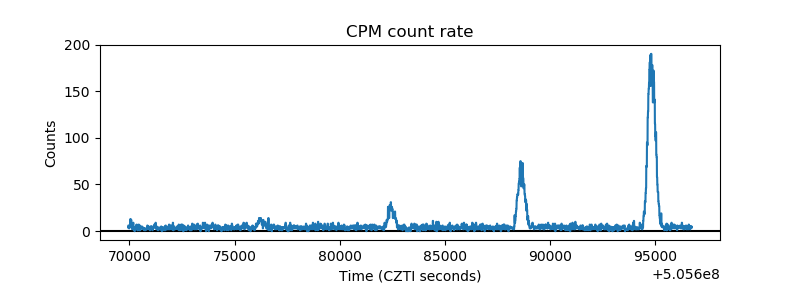 |
| CZT Counter | 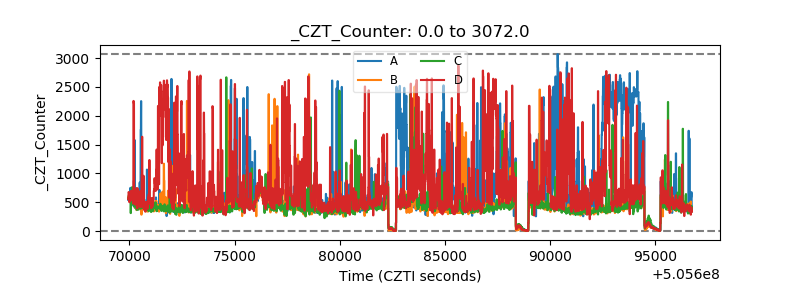 |
| +2.5 Volts monitor | 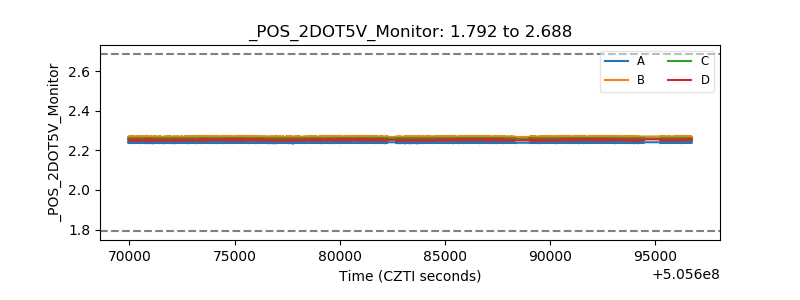 |
| +5 Volts monitor | 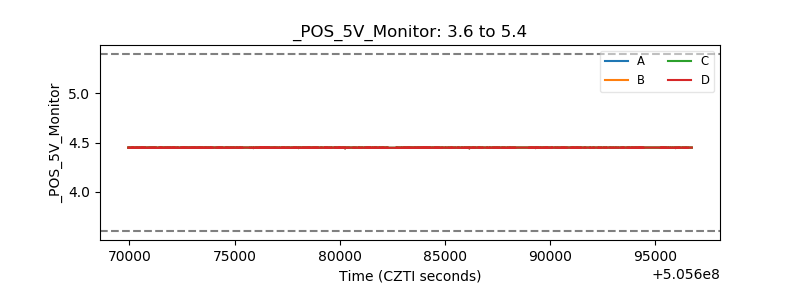 |
| _ROLL_ROT | 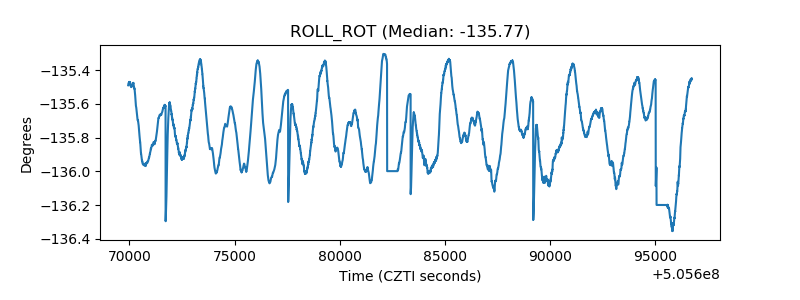 |
| _Roll_DEC | 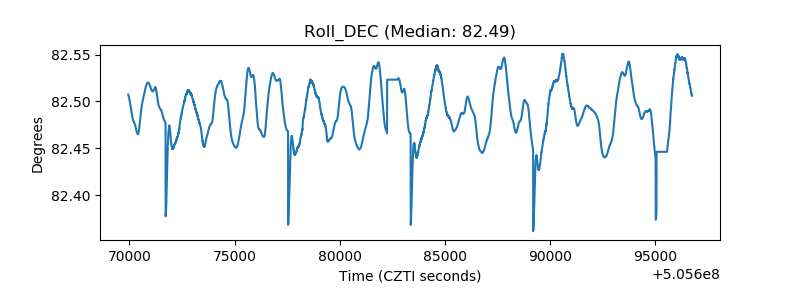 |
| _Roll_RA | 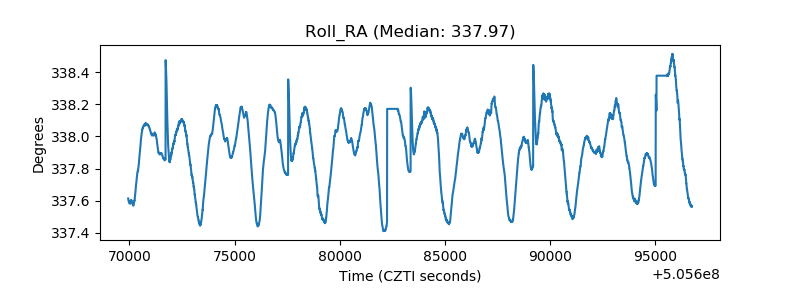 |
| Veto Counter | 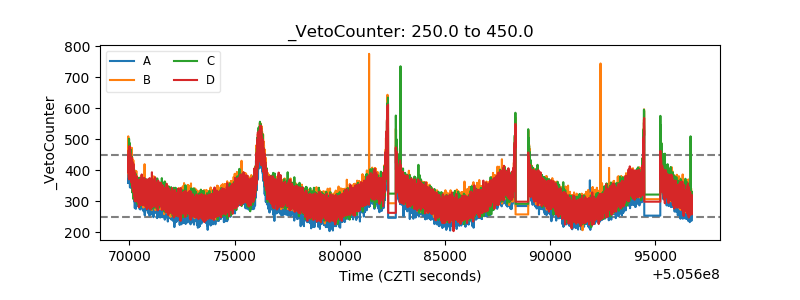 |