| Param | Original file | Final file |
|---|---|---|
| Filename | modeM0/AS1A14_021T06_9000006538_55648cztM0_level2.fits | modeM0/AS1A14_021T06_9000006538_55648cztM0_level2_quad_clean.evt |
| Size (bytes) | 459,345,600 | 93,758,400 |
| Size | 438.1 MB | 89.4 MB |
| Events in quadrant A | 6,105,916 | 567,756 |
| Events in quadrant B | 2,853,550 | 676,807 |
| Events in quadrant C | 3,142,086 | 594,083 |
| Events in quadrant D | 4,389,769 | 541,038 |
| Mode M9 | |||
|---|---|---|---|
| Quadrant | BADHDUFLAG | Total packets | Discarded packets |
| A | 0 | 18 | 0 |
| B | 0 | 19 | 0 |
| C | 0 | 19 | 0 |
| D | 0 | 19 | 0 |
| Mode M0 | |||
|---|---|---|---|
| Quadrant | BADHDUFLAG | Total packets | Discarded packets |
| A | 0 | 22694 | 2 |
| B | 0 | 13662 | 2 |
| C | 0 | 14501 | 2 |
| D | 0 | 17708 | 2 |
| Mode SS | |||
|---|---|---|---|
| Quadrant | BADHDUFLAG | Total packets | Discarded packets |
| A | 0 | 134 | 0 |
| B | 0 | 134 | 0 |
| C | 0 | 134 | 0 |
| D | 0 | 134 | 0 |
| Quadrant | Total seconds | Saturated seconds | Saturation percentage |
|---|---|---|---|
| A | 6585 | 755 | 11.465452% |
| B | 6585 | 59 | 0.895976% |
| C | 6585 | 75 | 1.138952% |
| D | 6585 | 315 | 4.783599% |
Noise dominated data is calculated using 1-second bins in cleaned event files. If a bin has >2000 counts, and if more than 50% of those come from <1% of pixels, then it is considered to be noise-dominated and hence unusable.
| Quadrant | # 1 sec bins | Bins with >0 counts | Bins with >2000 counts | High rate bins dominated by noise | Noise dominated (total time) | Noise dominated (detector-on time) | Marked lightcurve |
|---|---|---|---|---|---|---|---|
| A | 7700 | 6586 | 812 | 812 | 10.55% | 12.33% | 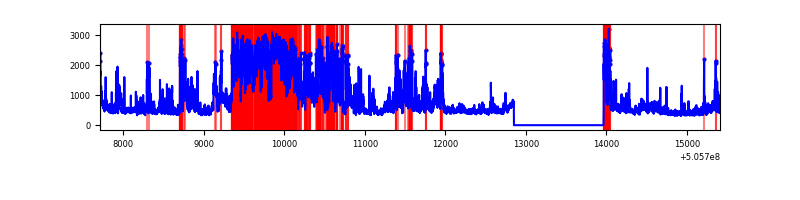 |
| B | 7700 | 6586 | 9 | 9 | 0.12% | 0.14% | 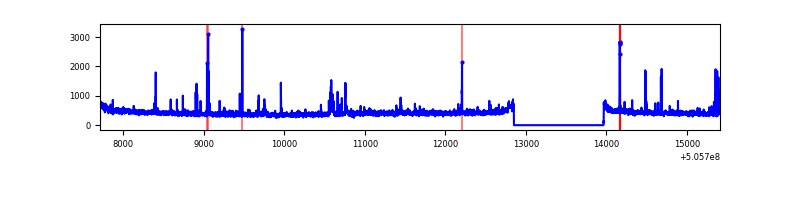 |
| C | 7700 | 6586 | 44 | 44 | 0.57% | 0.67% | 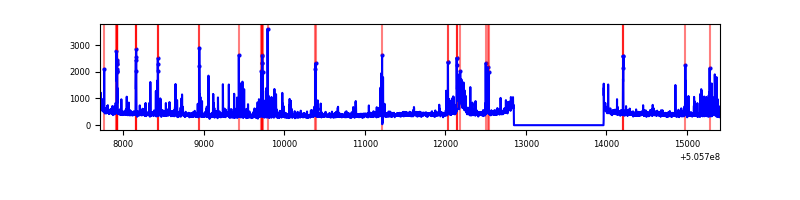 |
| D | 7700 | 6586 | 255 | 255 | 3.31% | 3.87% | 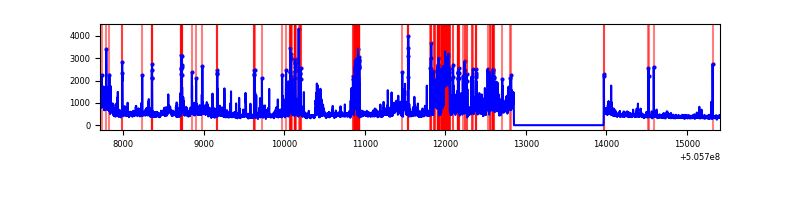 |
Top three noisy pixels from each quadrant. If the there are fewer than three noisy pixels in the level2.evt file, extra rows are filled as -1
| Pixel properties | Quadrant properties | ||||||
|---|---|---|---|---|---|---|---|
| Quadrant | DetID | PixID | Counts | Sigma | Mean | Median | Sigma |
| A | 12 | 115 | 3041559 | 18676.12 | 655 | 640 | 162.8 |
| A | 3 | 14 | 295782 | 1812.64 | 655 | 640 | 162.8 |
| A | 8 | 249 | 91137 | 555.8 | 655 | 640 | 162.8 |
| B | 0 | 171 | 43195 | 293.82 | 673 | 648 | 144.8 |
| B | 7 | 252 | 43155 | 293.55 | 673 | 648 | 144.8 |
| B | 5 | 248 | 32806 | 222.08 | 673 | 648 | 144.8 |
| C | 15 | 160 | 144471 | 799.44 | 657 | 649 | 179.9 |
| C | 6 | 223 | 124890 | 690.6 | 657 | 649 | 179.9 |
| C | 13 | 3 | 107221 | 592.39 | 657 | 649 | 179.9 |
| D | 11 | 129 | 763247 | 4201.4 | 639 | 610 | 181.5 |
| D | 2 | 62 | 310436 | 1706.84 | 639 | 610 | 181.5 |
| D | 10 | 181 | 284468 | 1563.78 | 639 | 610 | 181.5 |
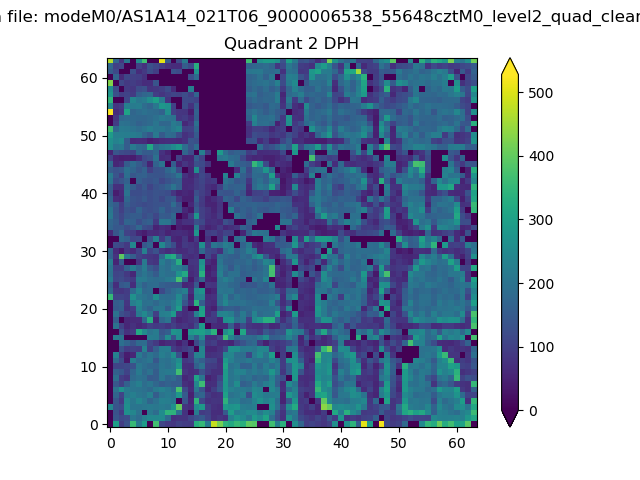
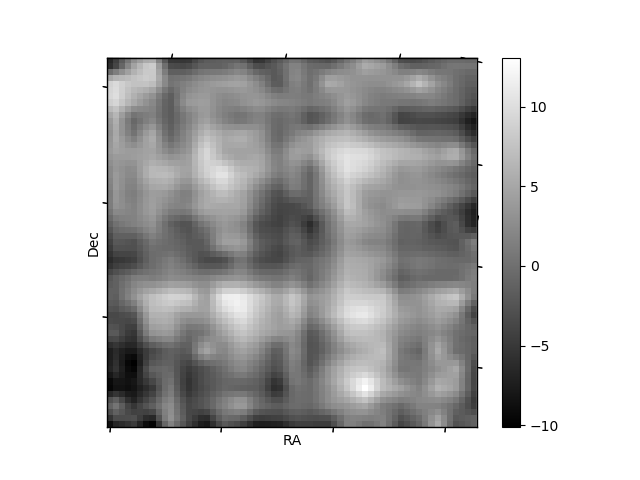
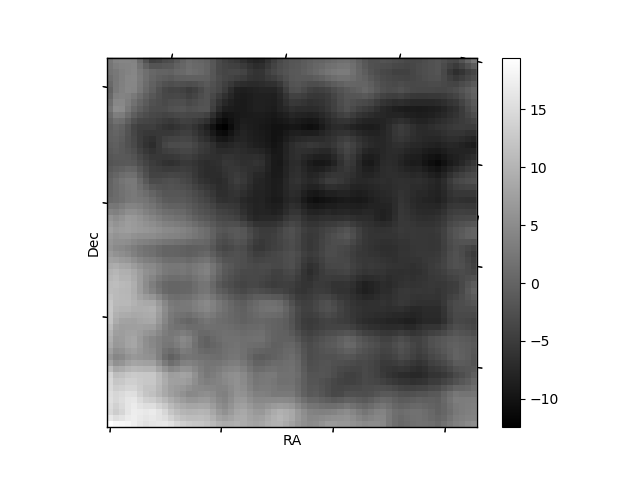
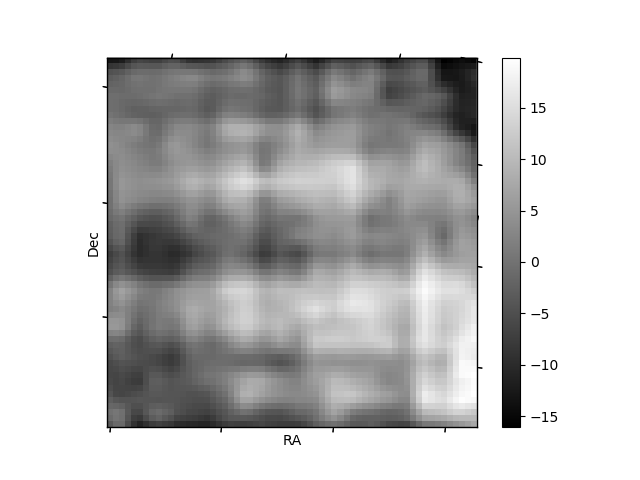
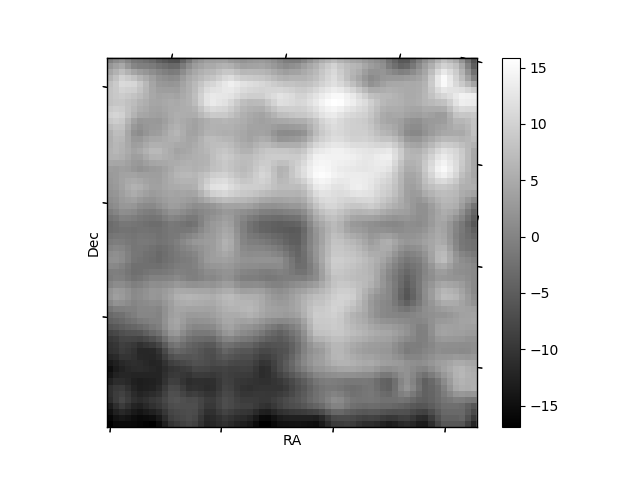
Histogram calculated using DETX and DETY for each event in the final _common_clean file
| Quadrant A | 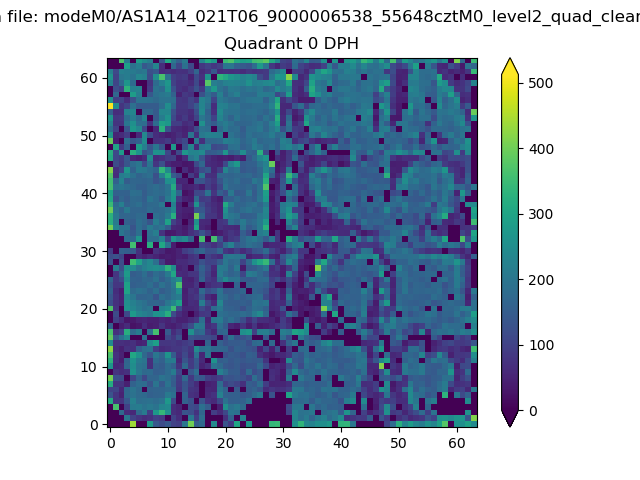 |
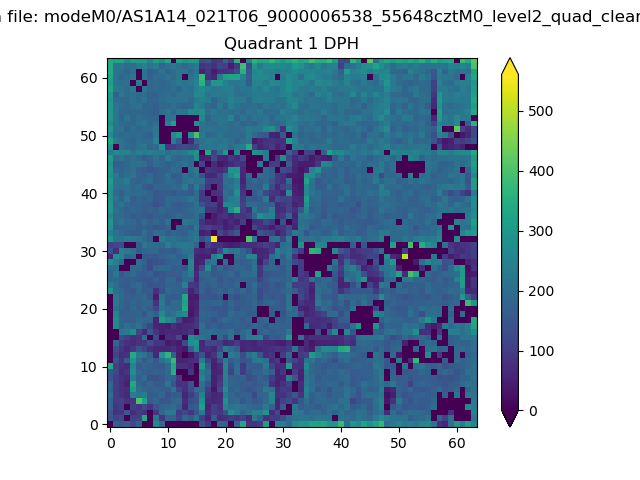 |
Quadrant B |
|---|---|---|---|
| Quadrant D | 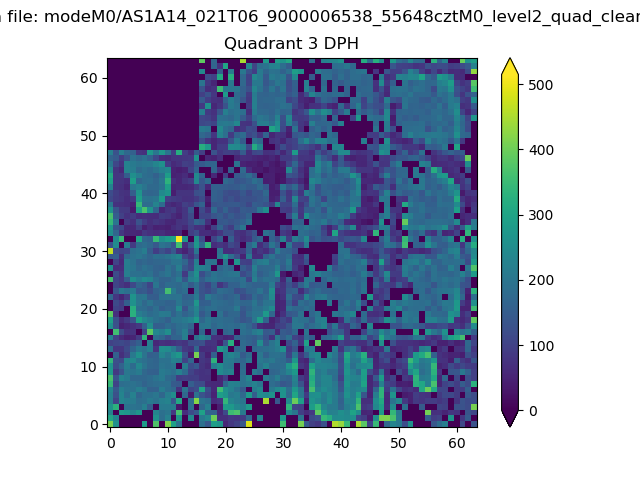 |
 |
Quadrant C |
| Plot type | Count rate plots | Images |
|---|---|---|
| Comparison with Poisson distribution Blue bars denote a histogram of data divided into 1 sec bins. Red curve is a Poisson curve with rate = median count rate of data. |
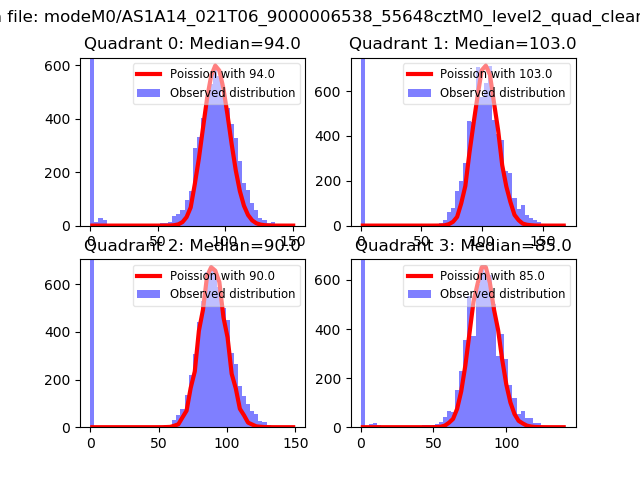 |
 |
| Quadrant-wise count rates Data is divided into 100 sec bins |
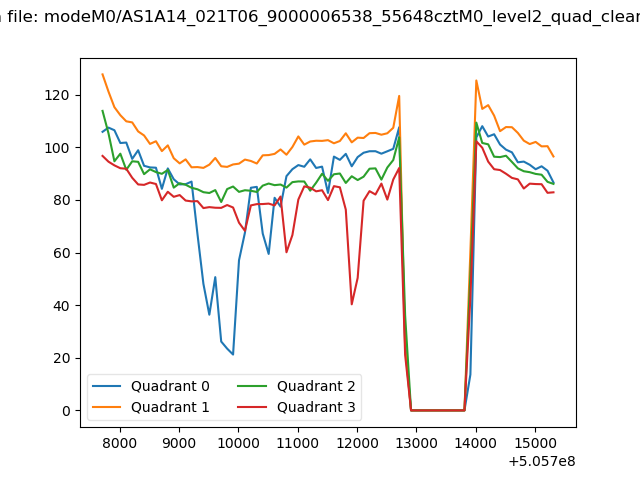 |
|
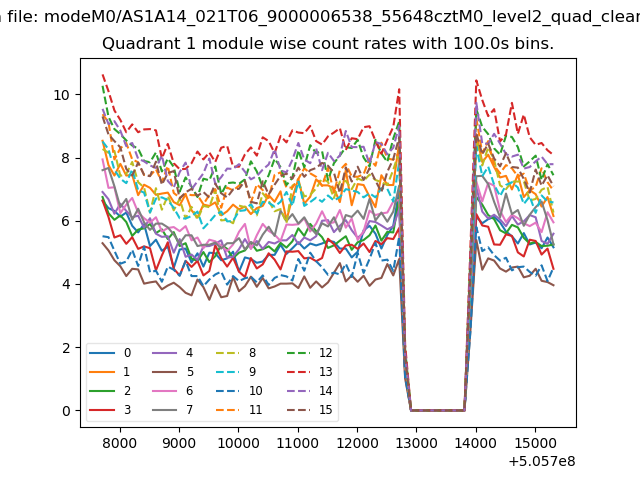
| Module-wise count rates for Quadrant A Data is divided into 100 sec bins |
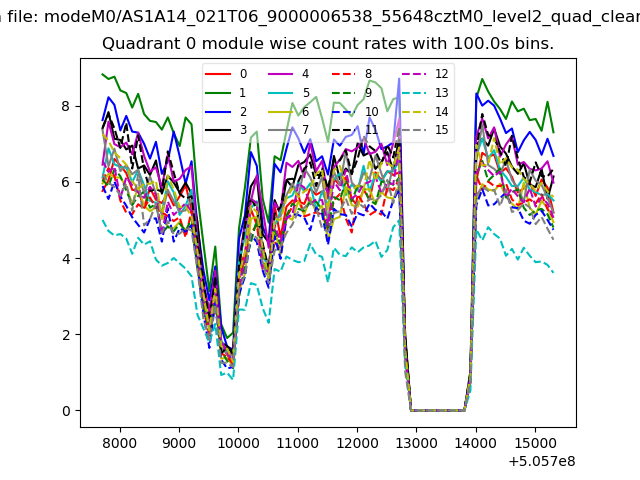 |
 |
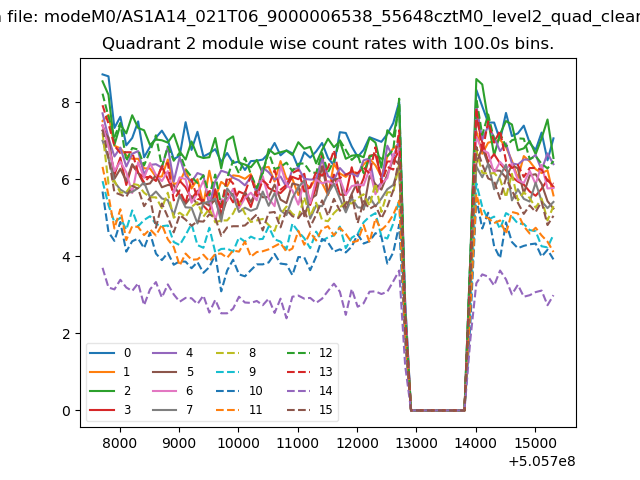
| Module-wise count rates for Quadrant B Data is divided into 100 sec bins |
 |
 |
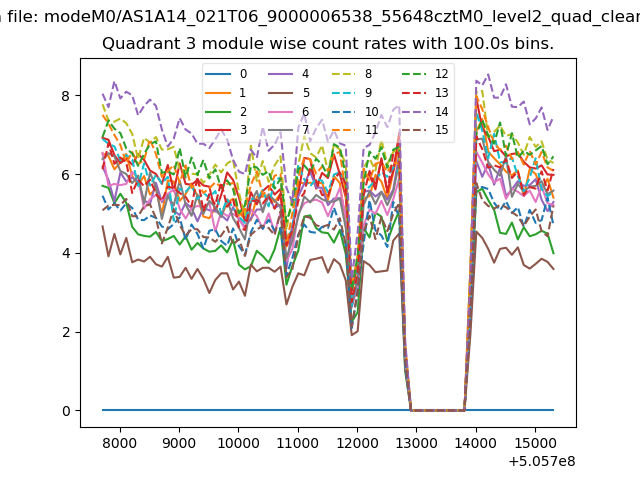
| Module-wise count rates for Quadrant C Data is divided into 100 sec bins |
 |
 |
| Module-wise count rates for Quadrant D Data is divided into 100 sec bins |
 |
 |
| Parameter | Plot |
|---|---|
| CZT HV Monitor | 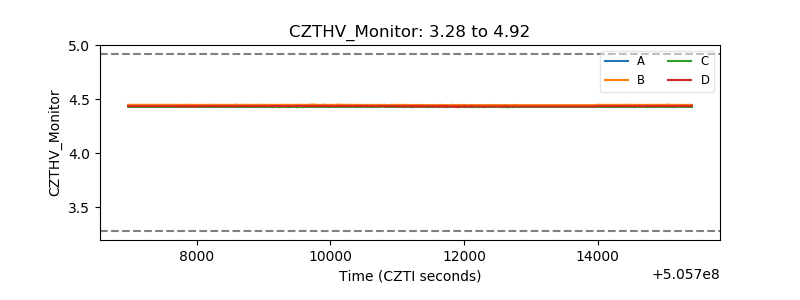 |
| D_VDD | 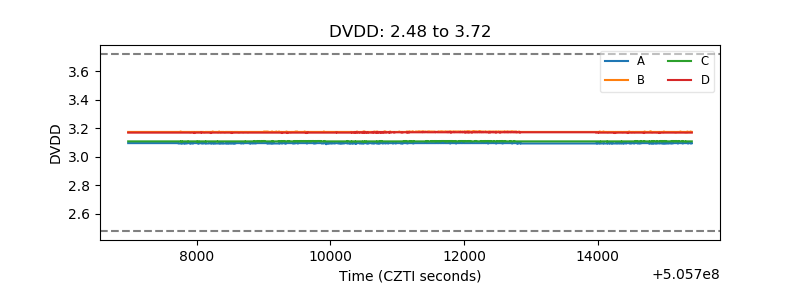 |
| Temperature 1 | 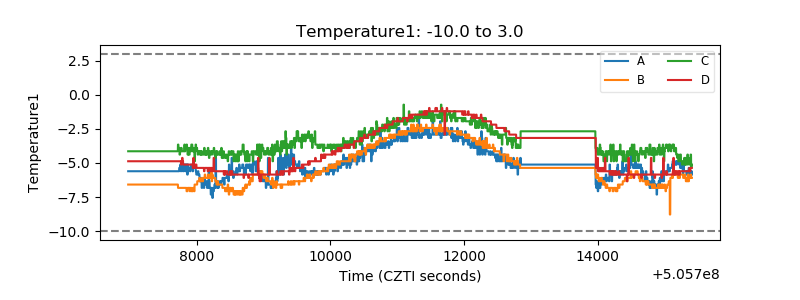 |
| Veto HV Monitor | 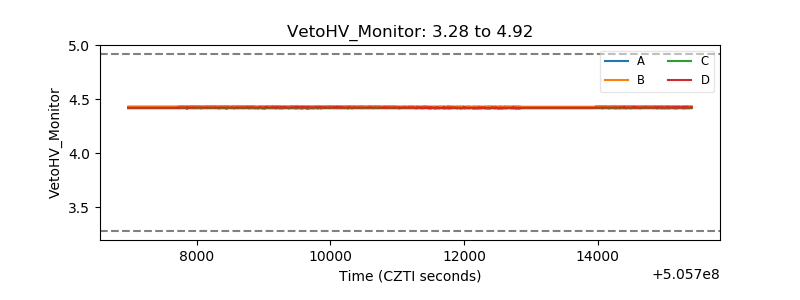 |
| Veto LLD | 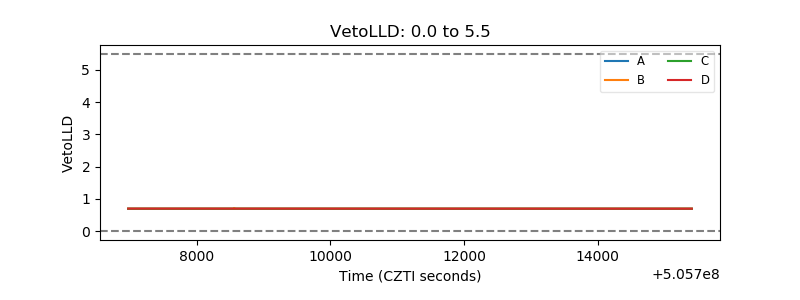 |
| Alpha Counter | 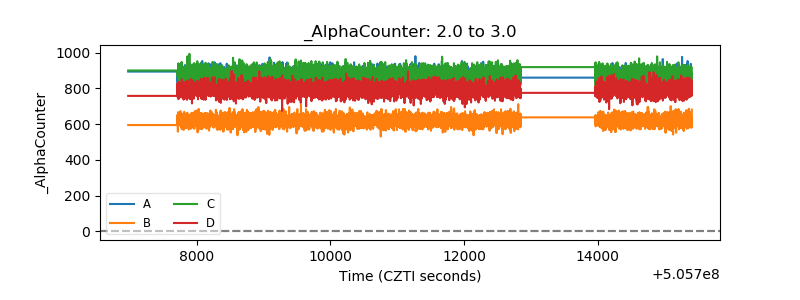 |
| _CPM_Rate | 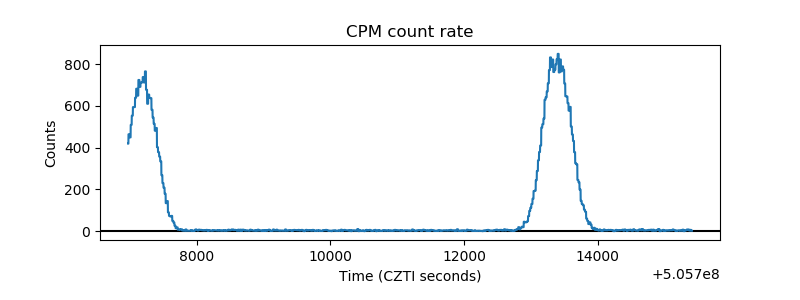 |
| CZT Counter | 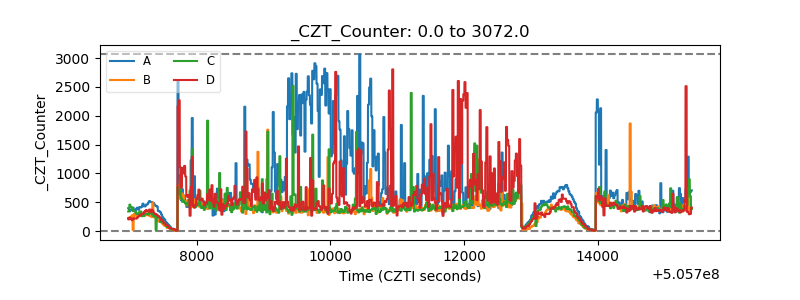 |
| +2.5 Volts monitor | 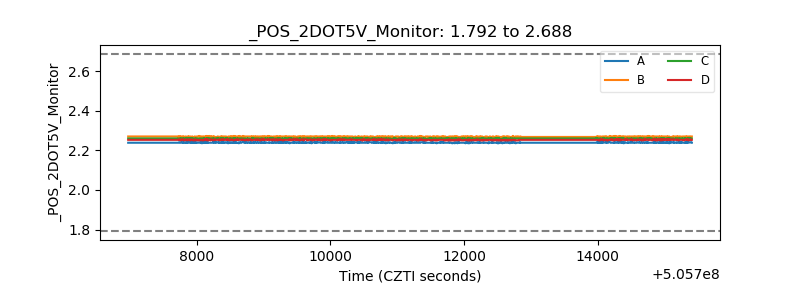 |
| +5 Volts monitor | 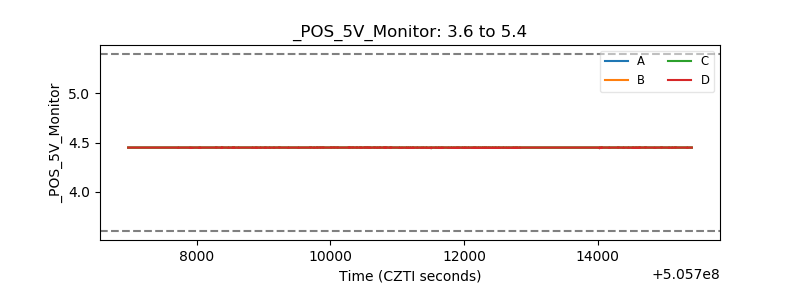 |
| _ROLL_ROT | 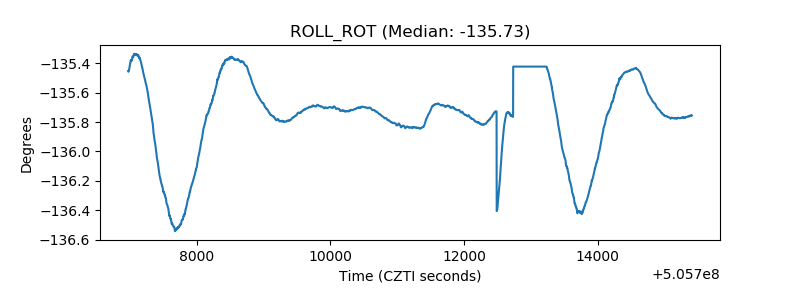 |
| _Roll_DEC | 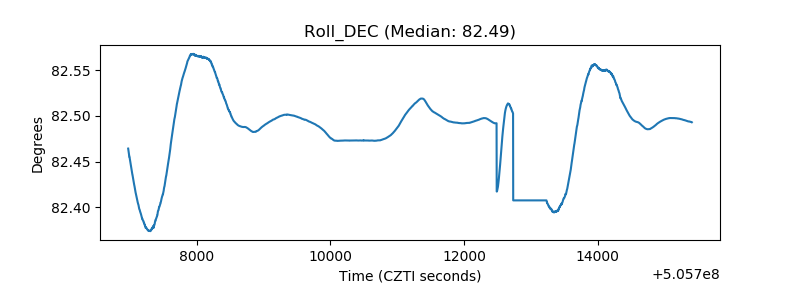 |
| _Roll_RA | 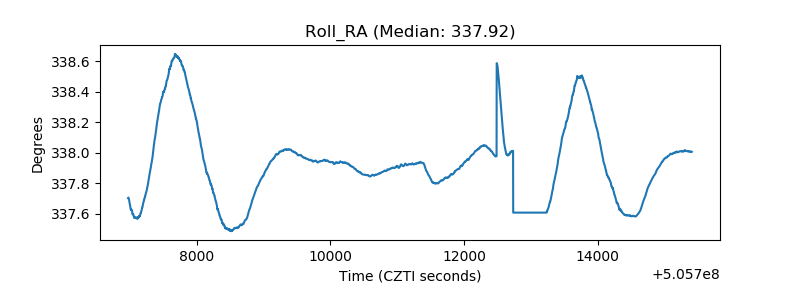 |
| Veto Counter | 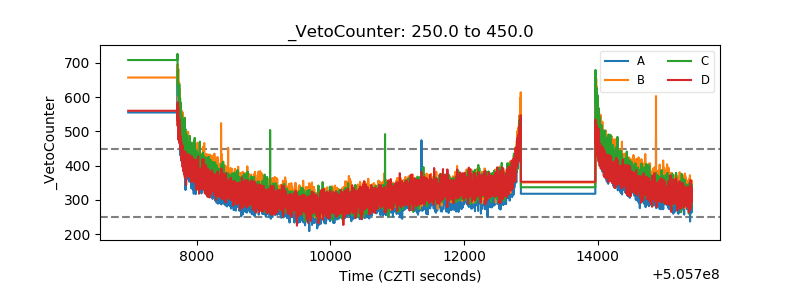 |