| Param | Original file | Final file |
|---|---|---|
| Filename | modeM0/AS1A14_021T06_9000006538_55649cztM0_level2.fits | modeM0/AS1A14_021T06_9000006538_55649cztM0_level2_quad_clean.evt |
| Size (bytes) | 483,482,880 | 88,934,400 |
| Size | 461.1 MB | 84.8 MB |
| Events in quadrant A | 8,289,944 | 443,422 |
| Events in quadrant B | 2,773,192 | 670,843 |
| Events in quadrant C | 2,835,480 | 586,146 |
| Events in quadrant D | 3,497,425 | 543,526 |
| Mode M9 | |||
|---|---|---|---|
| Quadrant | BADHDUFLAG | Total packets | Discarded packets |
| A | 0 | 18 | 0 |
| B | 0 | 19 | 0 |
| C | 0 | 19 | 0 |
| D | 0 | 19 | 0 |
| Mode M0 | |||
|---|---|---|---|
| Quadrant | BADHDUFLAG | Total packets | Discarded packets |
| A | 0 | 29191 | 2 |
| B | 0 | 13249 | 2 |
| C | 0 | 13523 | 2 |
| D | 0 | 15336 | 2 |
| Mode SS | |||
|---|---|---|---|
| Quadrant | BADHDUFLAG | Total packets | Discarded packets |
| A | 0 | 132 | 0 |
| B | 0 | 132 | 0 |
| C | 0 | 132 | 0 |
| D | 0 | 132 | 0 |
| Quadrant | Total seconds | Saturated seconds | Saturation percentage |
|---|---|---|---|
| A | 6433 | 1960 | 30.467900% |
| B | 6433 | 49 | 0.761697% |
| C | 6433 | 34 | 0.528525% |
| D | 6432 | 187 | 2.907338% |
Noise dominated data is calculated using 1-second bins in cleaned event files. If a bin has >2000 counts, and if more than 50% of those come from <1% of pixels, then it is considered to be noise-dominated and hence unusable.
| Quadrant | # 1 sec bins | Bins with >0 counts | Bins with >2000 counts | High rate bins dominated by noise | Noise dominated (total time) | Noise dominated (detector-on time) | Marked lightcurve |
|---|---|---|---|---|---|---|---|
| A | 7608 | 6435 | 1924 | 1924 | 25.29% | 29.90% | 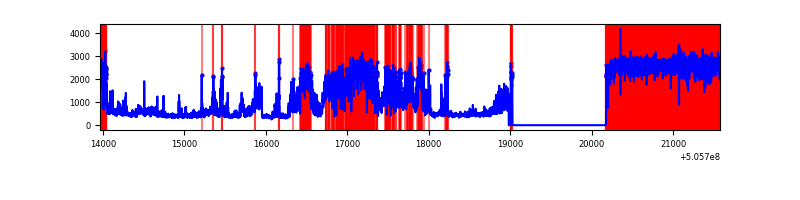 |
| B | 7608 | 6435 | 10 | 10 | 0.13% | 0.16% | 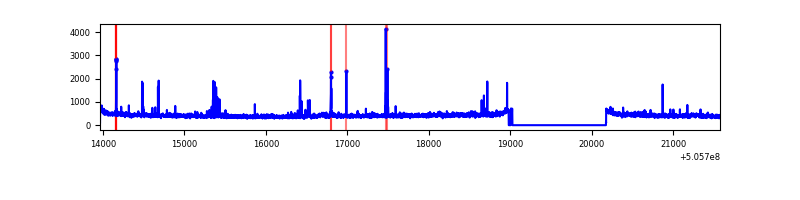 |
| C | 7608 | 6435 | 12 | 12 | 0.16% | 0.19% | 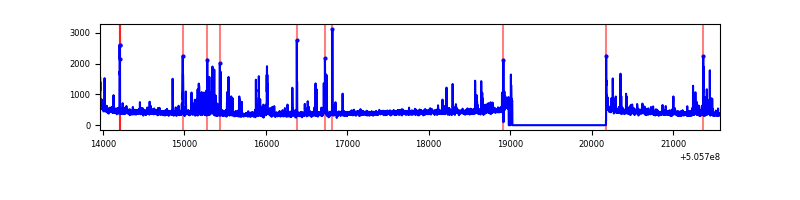 |
| D | 7607 | 6434 | 131 | 131 | 1.72% | 2.04% | 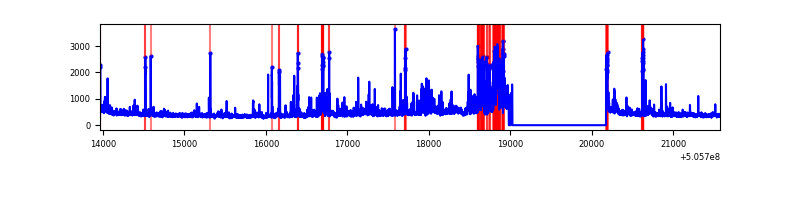 |
Top three noisy pixels from each quadrant. If the there are fewer than three noisy pixels in the level2.evt file, extra rows are filled as -1
| Pixel properties | Quadrant properties | ||||||
|---|---|---|---|---|---|---|---|
| Quadrant | DetID | PixID | Counts | Sigma | Mean | Median | Sigma |
| A | 12 | 115 | 5499645 | 38512.22 | 574 | 560 | 142.8 |
| A | 3 | 14 | 281400 | 1966.83 | 574 | 560 | 142.8 |
| A | 8 | 249 | 47799 | 330.83 | 574 | 560 | 142.8 |
| B | 0 | 171 | 43067 | 299.17 | 660 | 636 | 141.8 |
| B | 5 | 248 | 29151 | 201.05 | 660 | 636 | 141.8 |
| B | 10 | 247 | 28750 | 198.22 | 660 | 636 | 141.8 |
| C | 6 | 223 | 124171 | 707.24 | 641 | 634 | 174.7 |
| C | 9 | 38 | 52598 | 297.49 | 641 | 634 | 174.7 |
| C | 13 | 3 | 47477 | 268.17 | 641 | 634 | 174.7 |
| D | 11 | 129 | 235685 | 1306.14 | 631 | 602 | 180.0 |
| D | 2 | 31 | 228142 | 1264.23 | 631 | 602 | 180.0 |
| D | 2 | 249 | 217723 | 1206.34 | 631 | 602 | 180.0 |
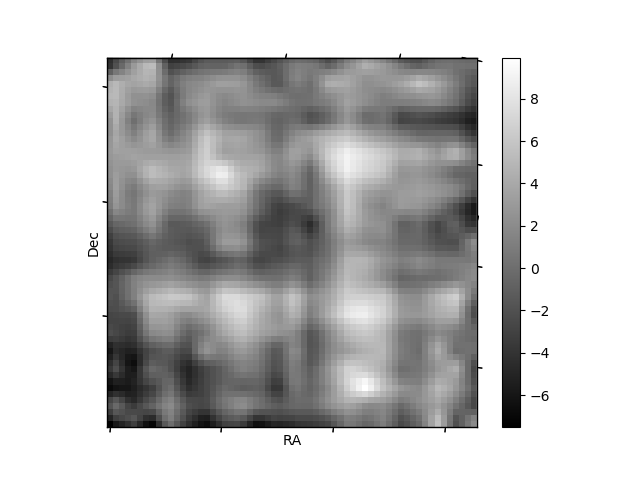
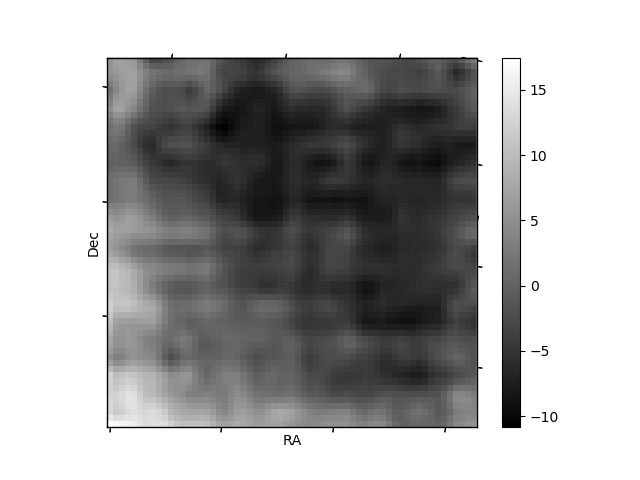
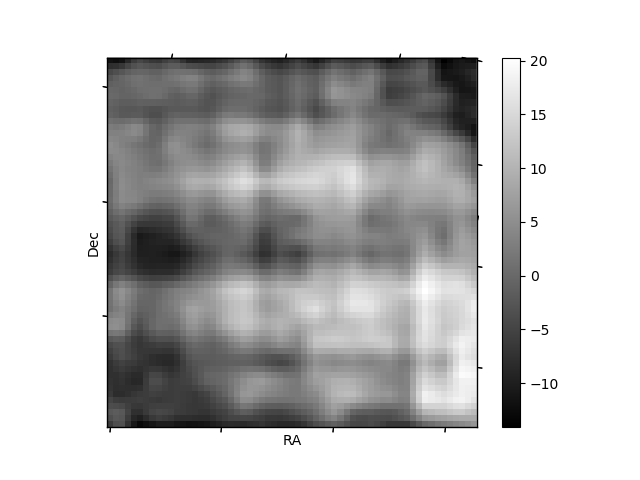
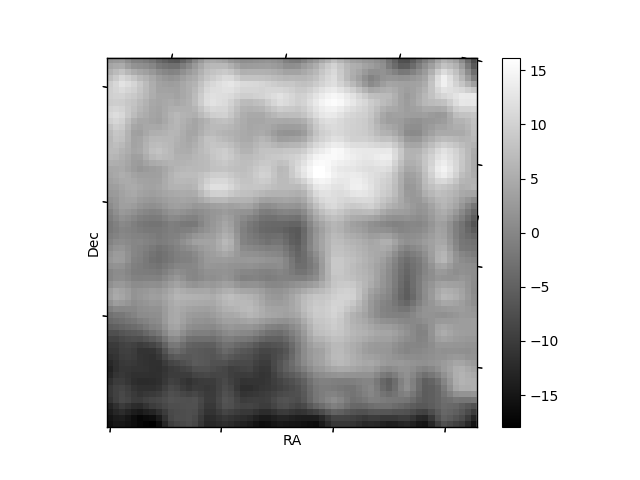
Histogram calculated using DETX and DETY for each event in the final _common_clean file
| Quadrant A | 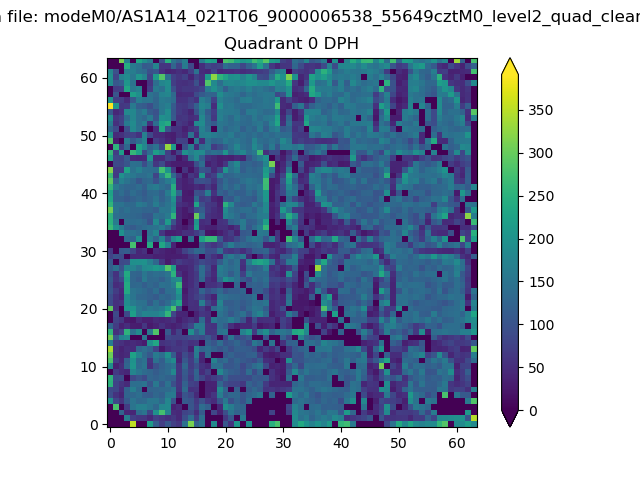 |
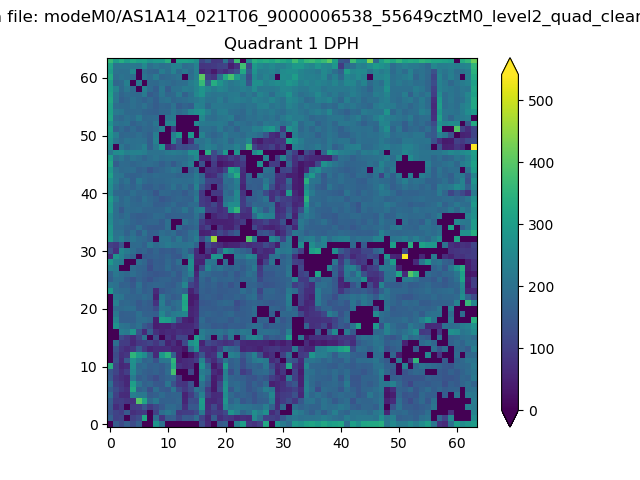 |
Quadrant B |
|---|---|---|---|
| Quadrant D | 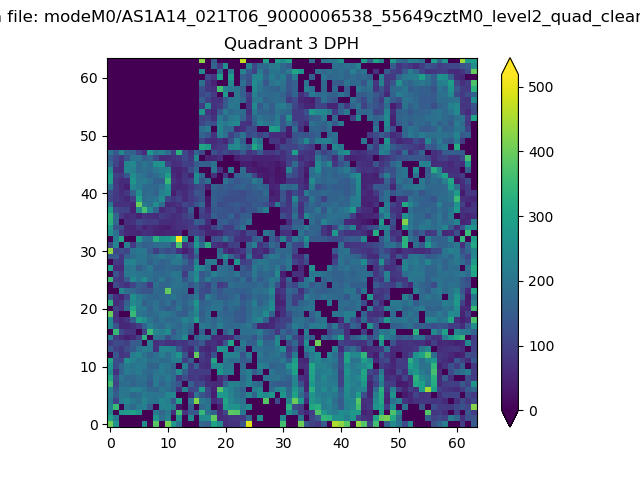 |
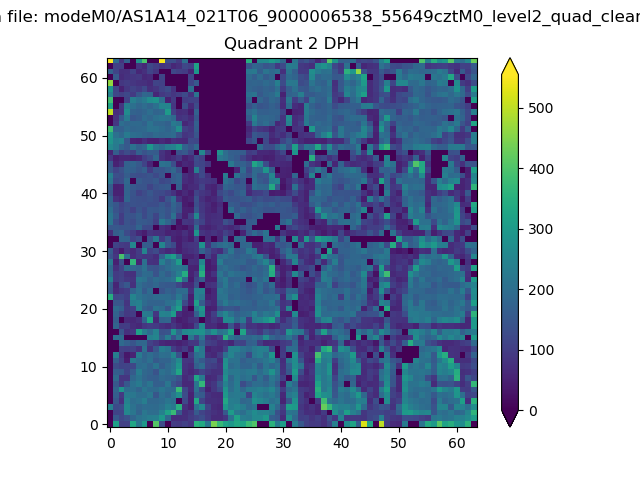 |
Quadrant C |
| Plot type | Count rate plots | Images |
|---|---|---|
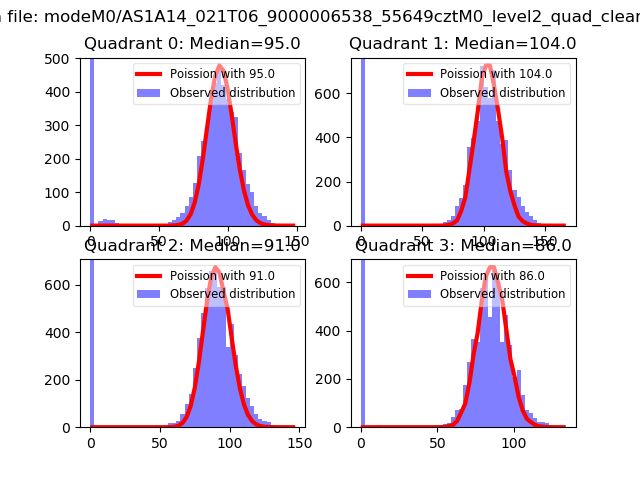
| Comparison with Poisson distribution Blue bars denote a histogram of data divided into 1 sec bins. Red curve is a Poisson curve with rate = median count rate of data. |
 |
 |
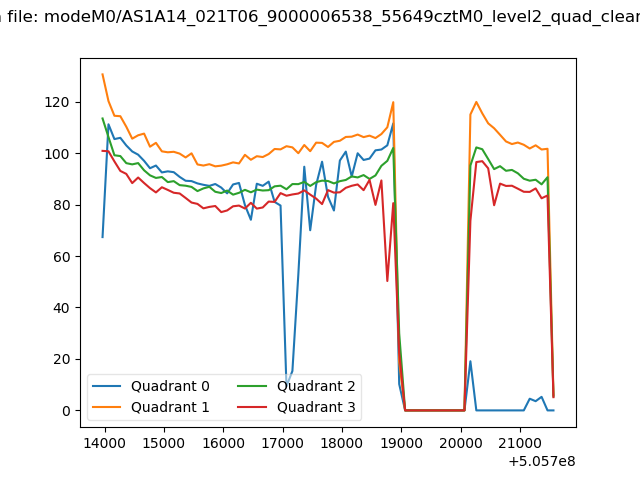
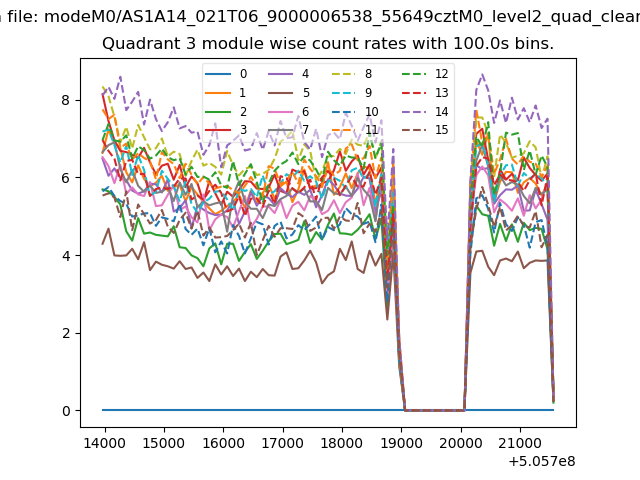
| Quadrant-wise count rates Data is divided into 100 sec bins |
 |
|
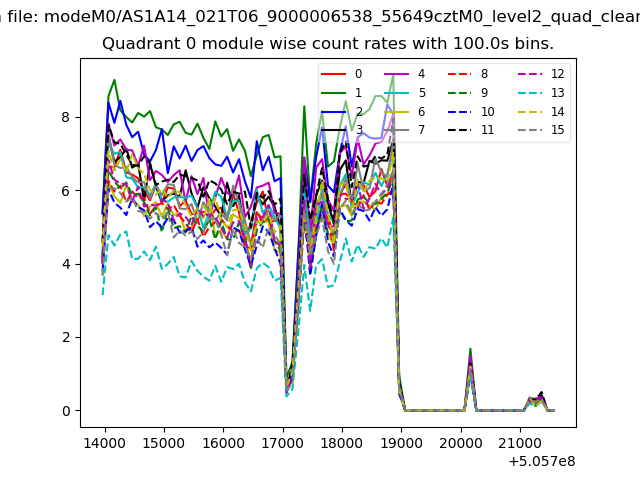
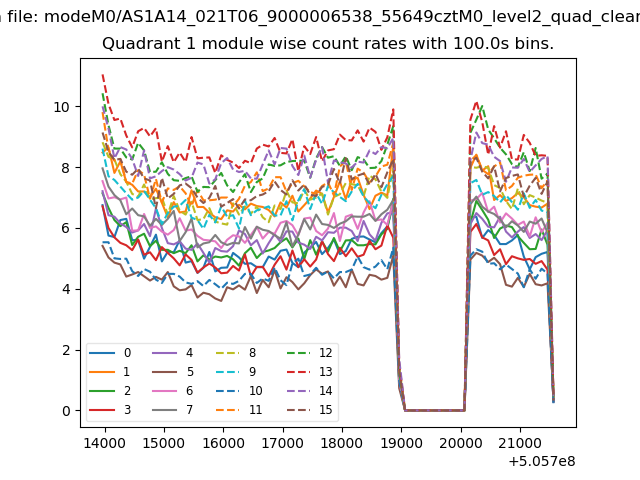
| Module-wise count rates for Quadrant A Data is divided into 100 sec bins |
 |
 |
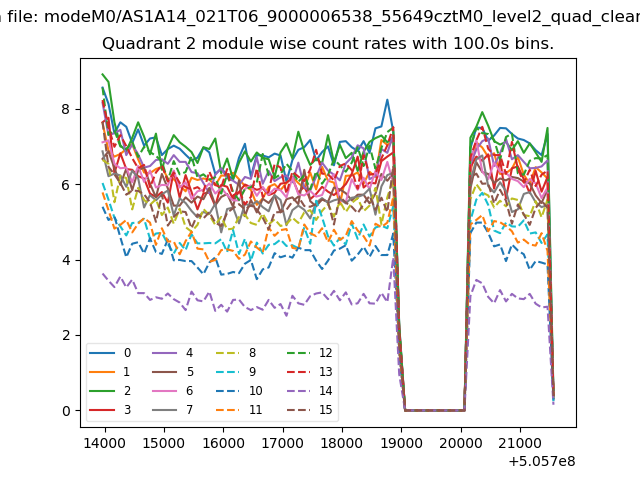
| Module-wise count rates for Quadrant B Data is divided into 100 sec bins |
 |
 |
| Module-wise count rates for Quadrant C Data is divided into 100 sec bins |
 |
 |
| Module-wise count rates for Quadrant D Data is divided into 100 sec bins |
 |
 |
| Parameter | Plot |
|---|---|
| CZT HV Monitor | 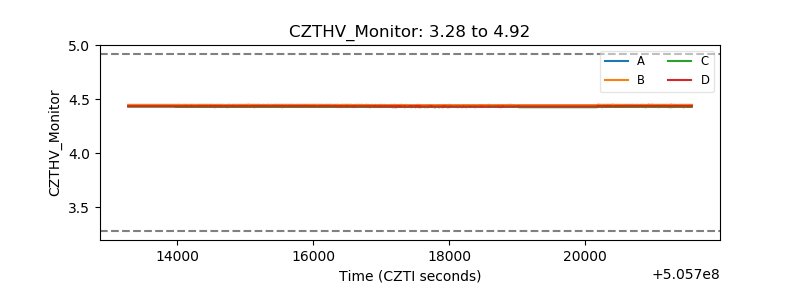 |
| D_VDD | 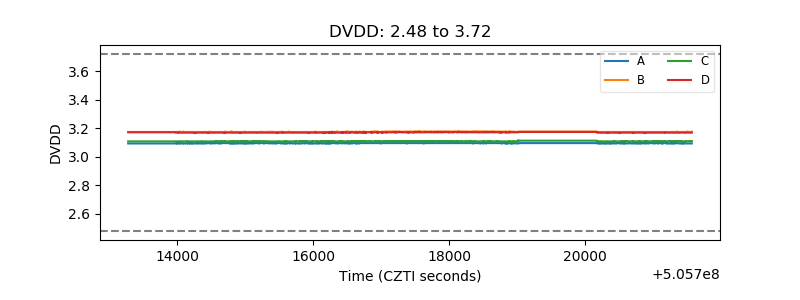 |
| Temperature 1 | 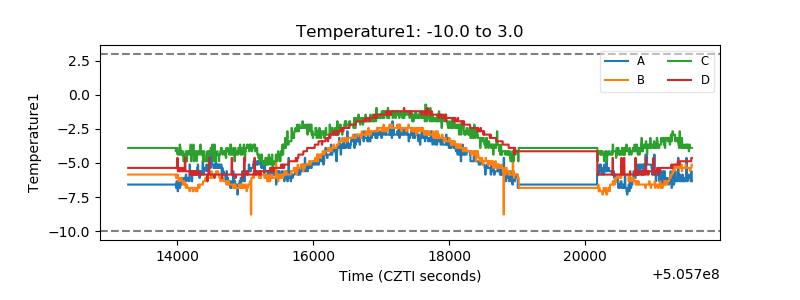 |
| Veto HV Monitor | 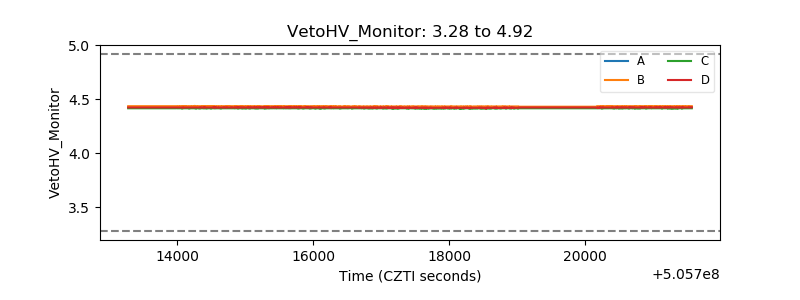 |
| Veto LLD | 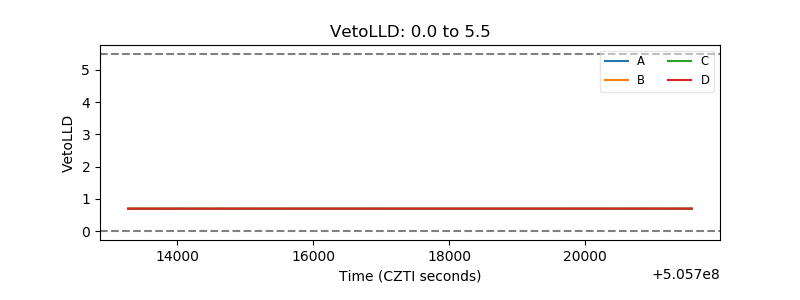 |
| Alpha Counter | 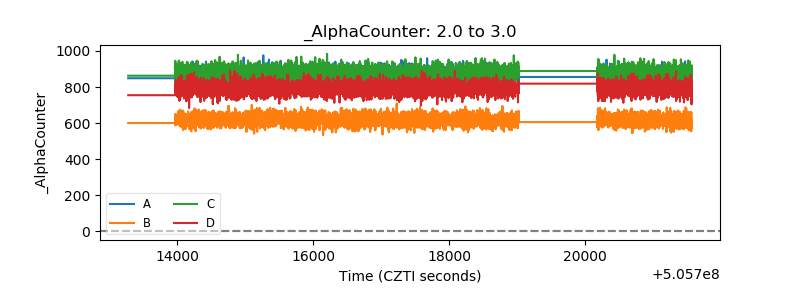 |
| _CPM_Rate | 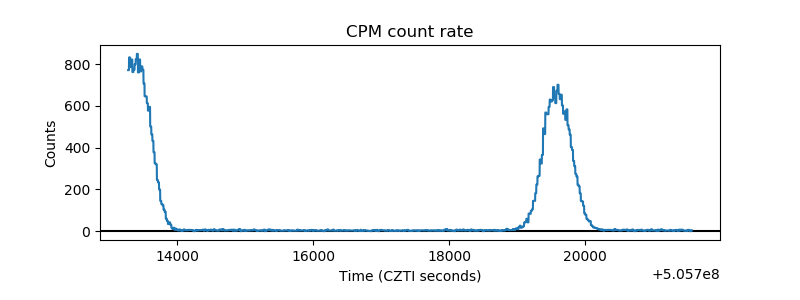 |
| CZT Counter | 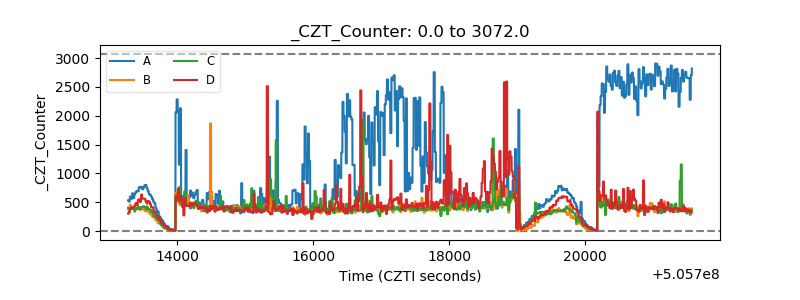 |
| +2.5 Volts monitor | 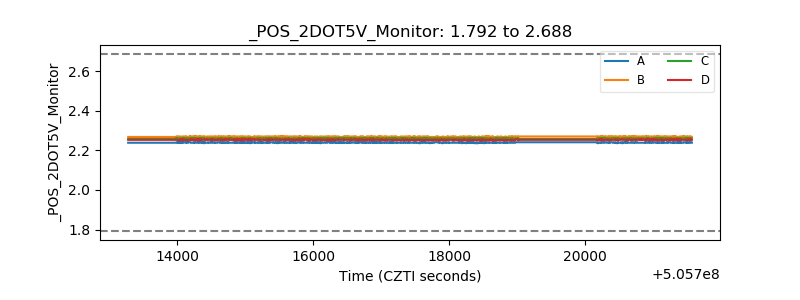 |
| +5 Volts monitor |  |
| _ROLL_ROT | 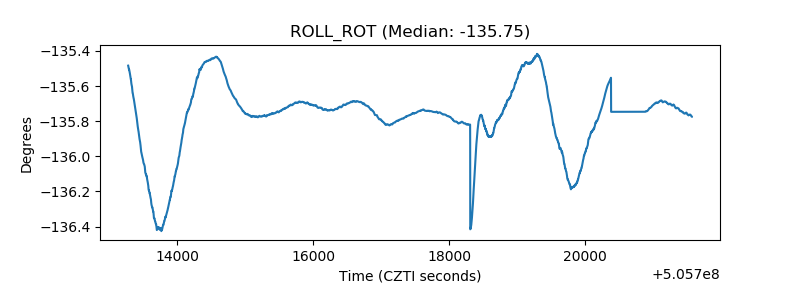 |
| _Roll_DEC | 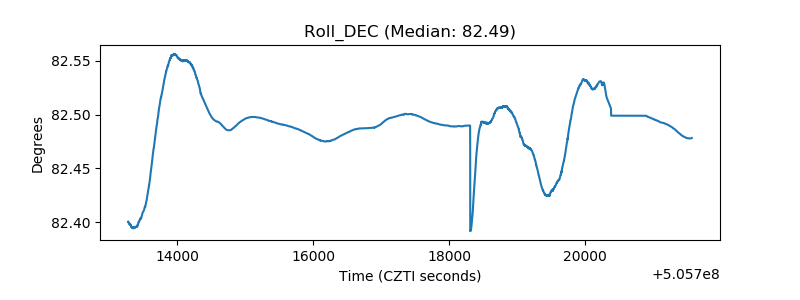 |
| _Roll_RA | 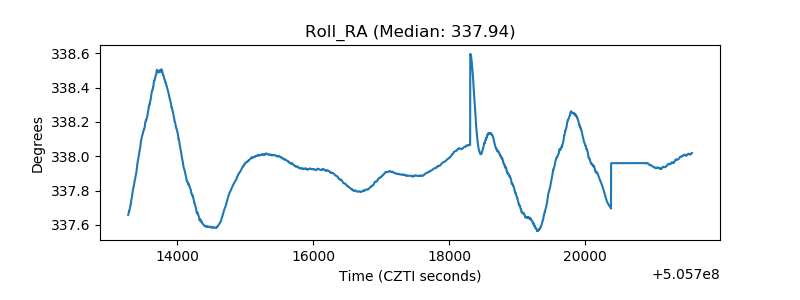 |
| Veto Counter | 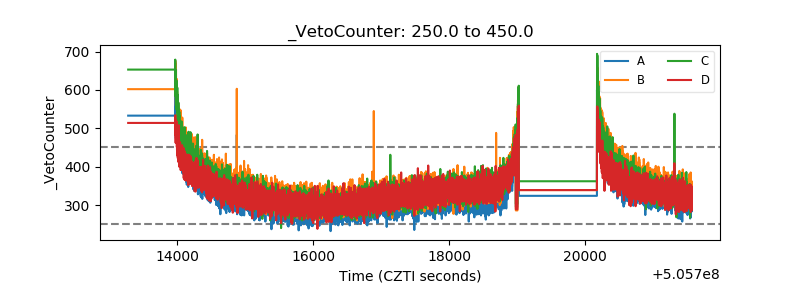 |