| Param | Original file | Final file |
|---|---|---|
| Filename | modeM0/AS1A14_021T06_9000006538_55650cztM0_level2.fits | modeM0/AS1A14_021T06_9000006538_55650cztM0_level2_quad_clean.evt |
| Size (bytes) | 477,043,200 | 77,486,400 |
| Size | 454.9 MB | 73.9 MB |
| Events in quadrant A | 8,922,449 | 318,319 |
| Events in quadrant B | 2,460,672 | 604,794 |
| Events in quadrant C | 2,616,167 | 526,663 |
| Events in quadrant D | 3,200,967 | 486,198 |
| Mode M9 | |||
|---|---|---|---|
| Quadrant | BADHDUFLAG | Total packets | Discarded packets |
| A | 0 | 11 | 0 |
| B | 0 | 11 | 0 |
| C | 0 | 11 | 0 |
| D | 0 | 11 | 0 |
| Mode M0 | |||
|---|---|---|---|
| Quadrant | BADHDUFLAG | Total packets | Discarded packets |
| A | 0 | 30609 | 1 |
| B | 0 | 12036 | 1 |
| C | 0 | 12527 | 2 |
| D | 0 | 13963 | 1 |
| Mode SS | |||
|---|---|---|---|
| Quadrant | BADHDUFLAG | Total packets | Discarded packets |
| A | 0 | 118 | 0 |
| B | 0 | 118 | 0 |
| C | 0 | 118 | 0 |
| D | 0 | 118 | 0 |
| Quadrant | Total seconds | Saturated seconds | Saturation percentage |
|---|---|---|---|
| A | 5877 | 2714 | 46.180024% |
| B | 5878 | 70 | 1.190881% |
| C | 5877 | 52 | 0.884805% |
| D | 5877 | 217 | 3.692360% |
Noise dominated data is calculated using 1-second bins in cleaned event files. If a bin has >2000 counts, and if more than 50% of those come from <1% of pixels, then it is considered to be noise-dominated and hence unusable.
| Quadrant | # 1 sec bins | Bins with >0 counts | Bins with >2000 counts | High rate bins dominated by noise | Noise dominated (total time) | Noise dominated (detector-on time) | Marked lightcurve |
|---|---|---|---|---|---|---|---|
| A | 6972 | 5878 | 2648 | 2648 | 37.98% | 45.05% | 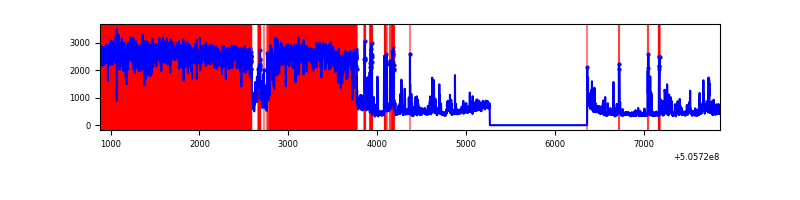 |
| B | 6973 | 5879 | 6 | 6 | 0.09% | 0.10% | 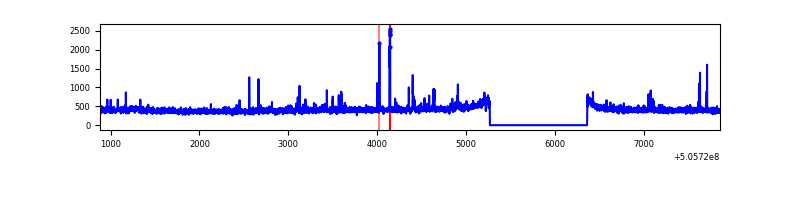 |
| C | 6972 | 5878 | 29 | 29 | 0.42% | 0.49% | 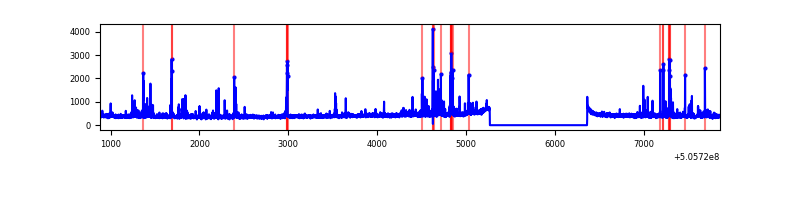 |
| D | 6972 | 5878 | 149 | 149 | 2.14% | 2.53% | 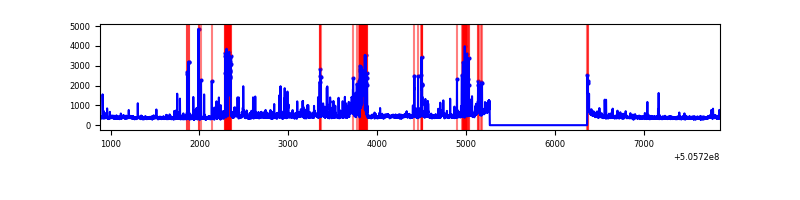 |
Top three noisy pixels from each quadrant. If the there are fewer than three noisy pixels in the level2.evt file, extra rows are filled as -1
| Pixel properties | Quadrant properties | ||||||
|---|---|---|---|---|---|---|---|
| Quadrant | DetID | PixID | Counts | Sigma | Mean | Median | Sigma |
| A | 12 | 115 | 6222271 | 51080.38 | 492 | 479 | 121.8 |
| A | 3 | 14 | 476503 | 3908.12 | 492 | 479 | 121.8 |
| A | 0 | 8 | 175622 | 1437.91 | 492 | 479 | 121.8 |
| B | 0 | 171 | 28758 | 221.35 | 598 | 578 | 127.3 |
| B | 5 | 248 | 23942 | 183.52 | 598 | 578 | 127.3 |
| B | 12 | 111 | 15311 | 115.73 | 598 | 578 | 127.3 |
| C | 6 | 223 | 155780 | 967.08 | 580 | 574 | 160.5 |
| C | 13 | 3 | 52370 | 322.74 | 580 | 574 | 160.5 |
| C | 9 | 38 | 43532 | 267.67 | 580 | 574 | 160.5 |
| D | 10 | 181 | 291705 | 1795.19 | 572 | 546 | 162.2 |
| D | 11 | 129 | 276077 | 1698.84 | 572 | 546 | 162.2 |
| D | 2 | 249 | 164179 | 1008.91 | 572 | 546 | 162.2 |
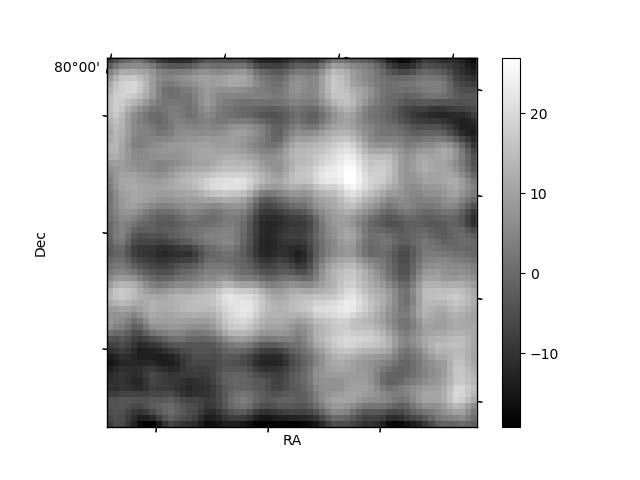
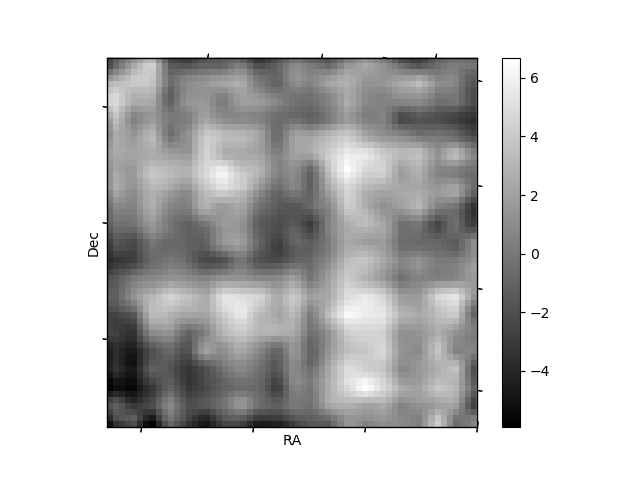
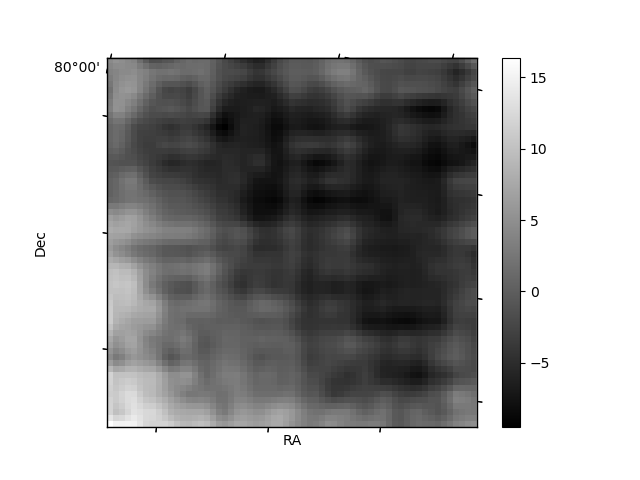
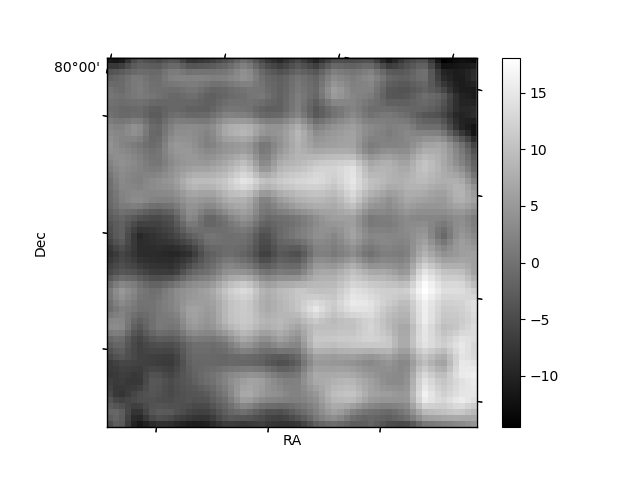
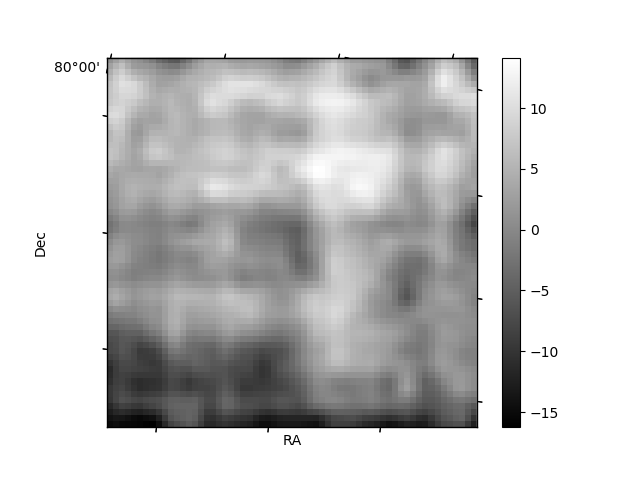
Histogram calculated using DETX and DETY for each event in the final _common_clean file
| Quadrant A | 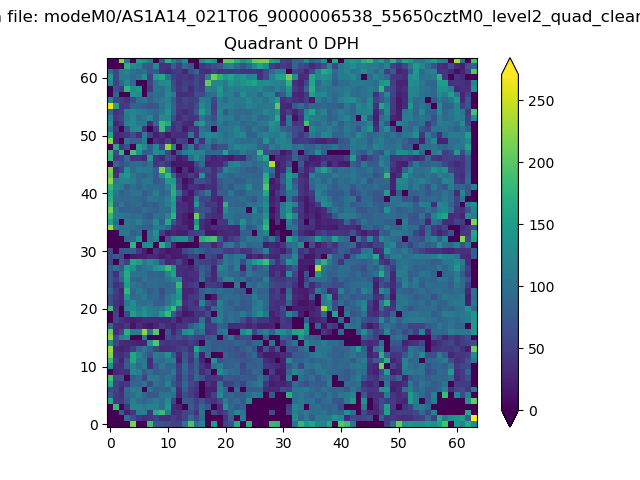 |
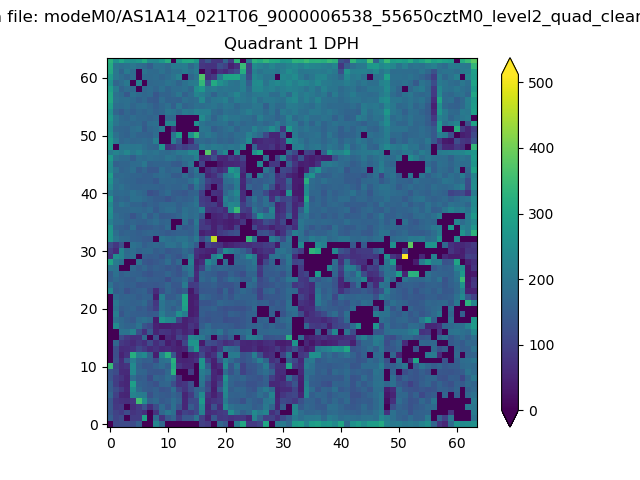 |
Quadrant B |
|---|---|---|---|
| Quadrant D | 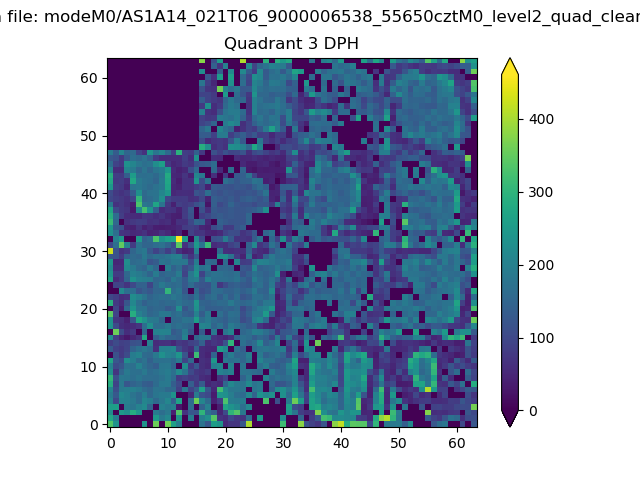 |
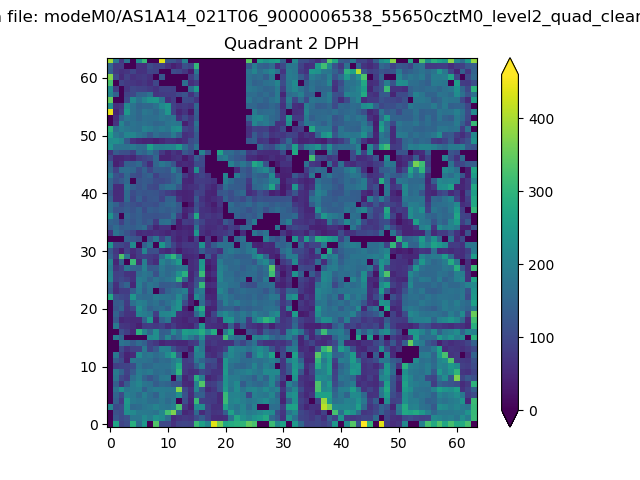 |
Quadrant C |
| Plot type | Count rate plots | Images |
|---|---|---|
| Comparison with Poisson distribution Blue bars denote a histogram of data divided into 1 sec bins. Red curve is a Poisson curve with rate = median count rate of data. |
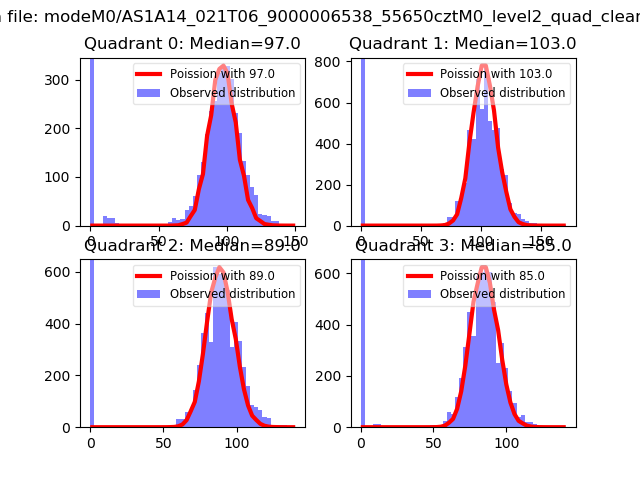 |
 |
| Quadrant-wise count rates Data is divided into 100 sec bins |
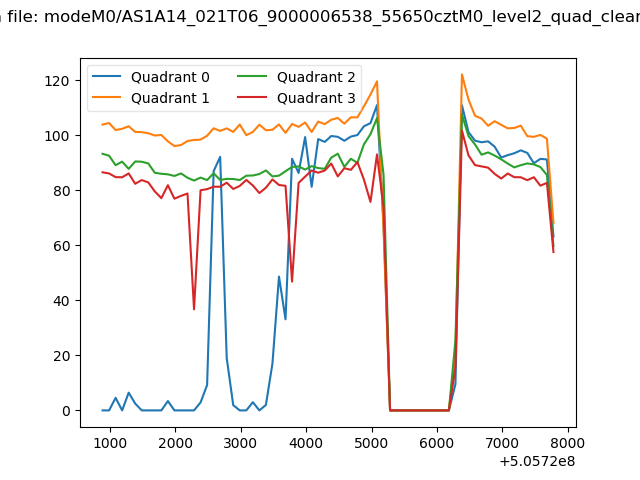 |
|
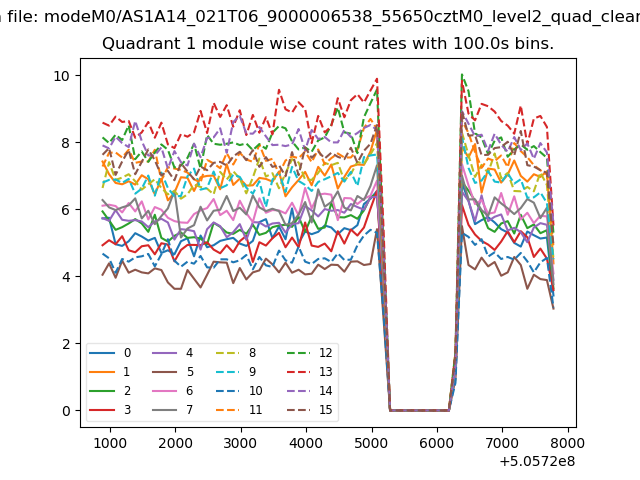
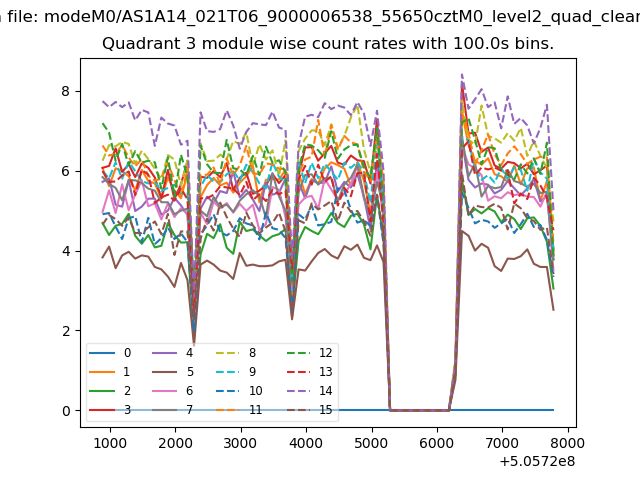
| Module-wise count rates for Quadrant A Data is divided into 100 sec bins |
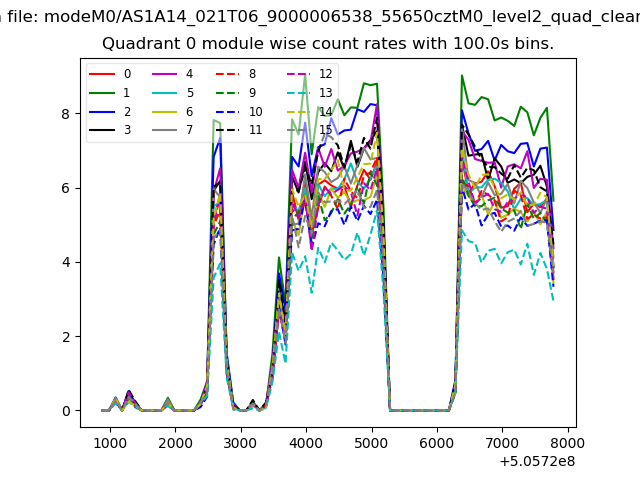 |
 |
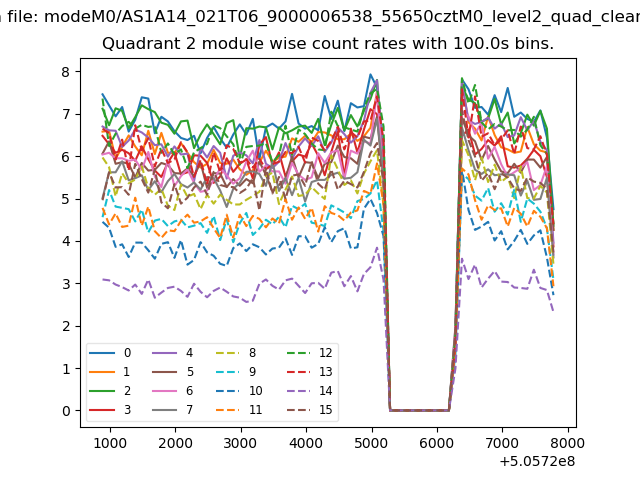
| Module-wise count rates for Quadrant B Data is divided into 100 sec bins |
 |
 |
| Module-wise count rates for Quadrant C Data is divided into 100 sec bins |
 |
 |
| Module-wise count rates for Quadrant D Data is divided into 100 sec bins |
 |
 |
| Parameter | Plot |
|---|---|
| CZT HV Monitor | 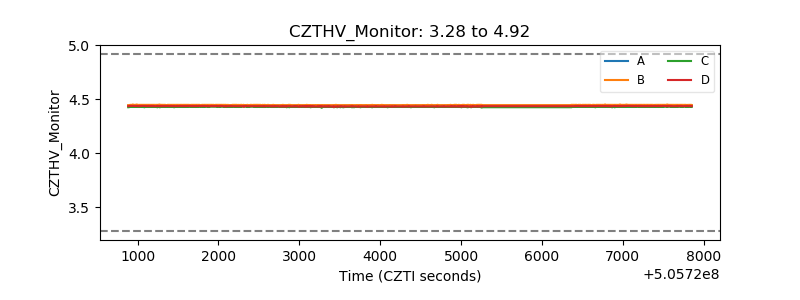 |
| D_VDD | 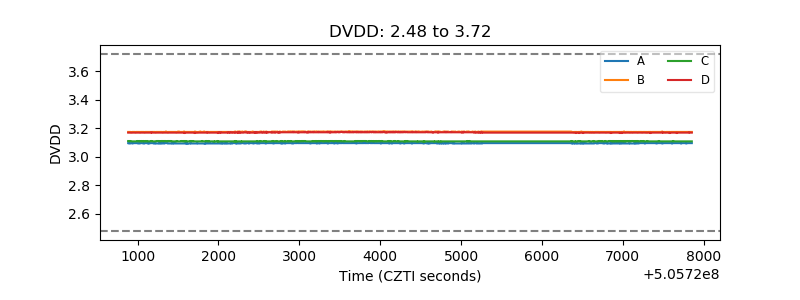 |
| Temperature 1 | 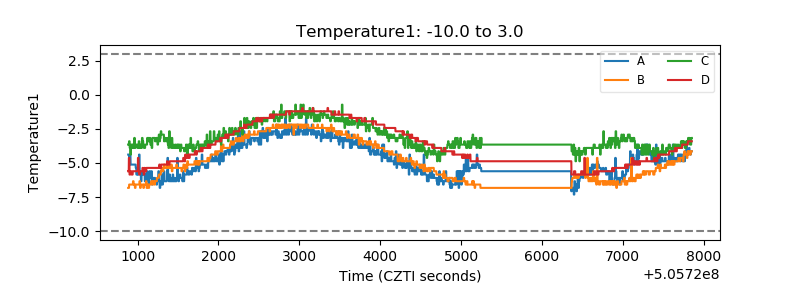 |
| Veto HV Monitor | 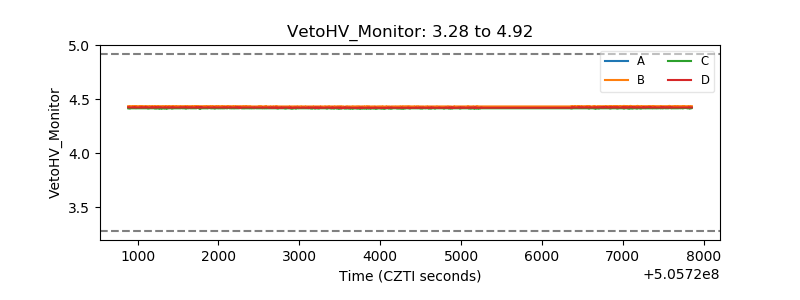 |
| Veto LLD | 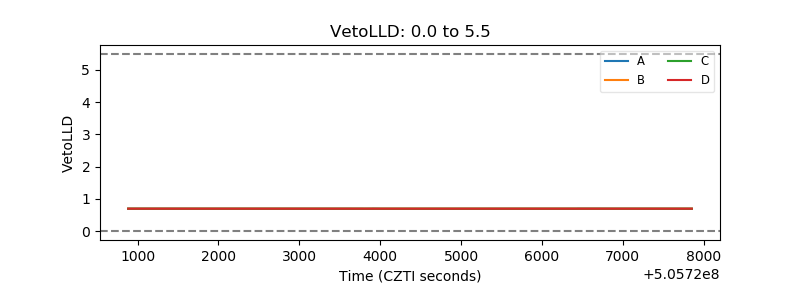 |
| Alpha Counter | 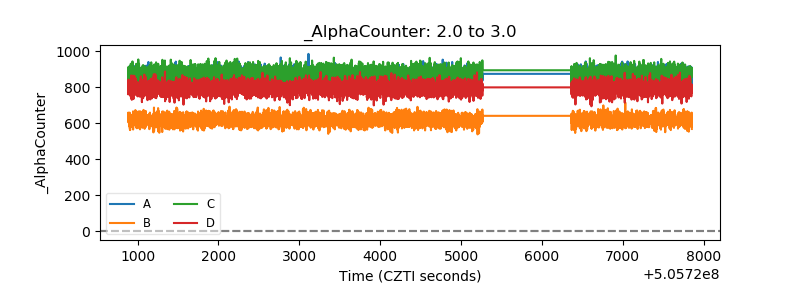 |
| _CPM_Rate | 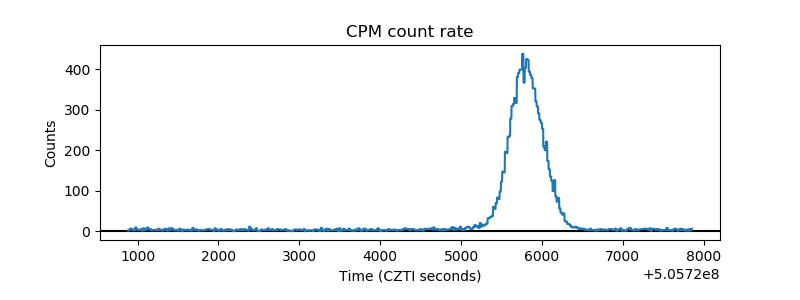 |
| CZT Counter | 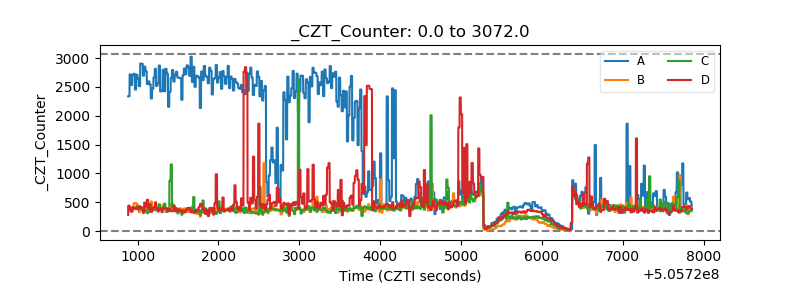 |
| +2.5 Volts monitor | 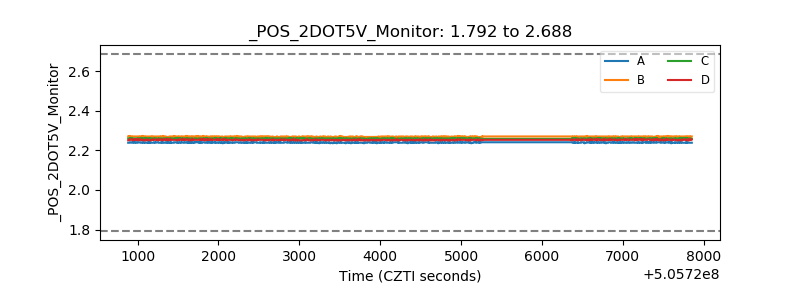 |
| +5 Volts monitor | 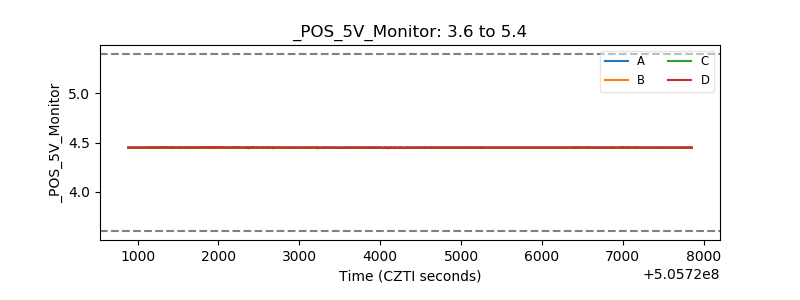 |
| _ROLL_ROT | 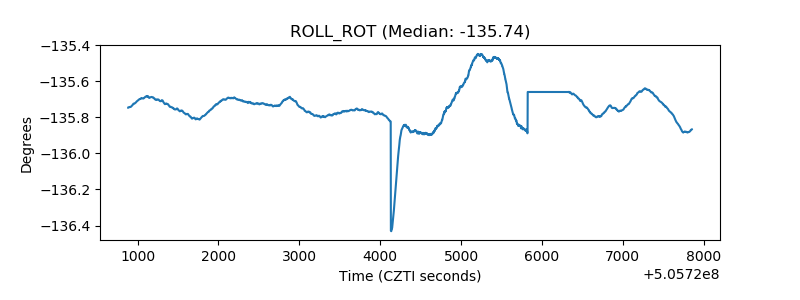 |
| _Roll_DEC | 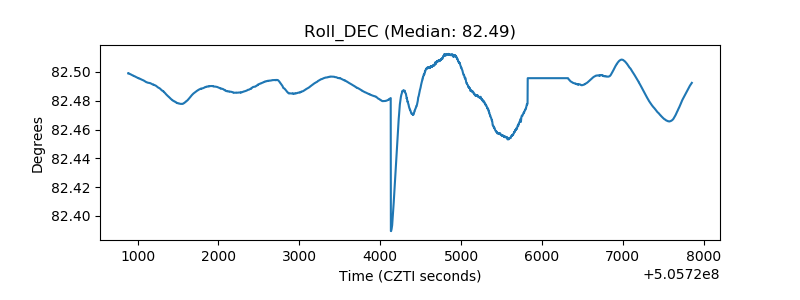 |
| _Roll_RA | 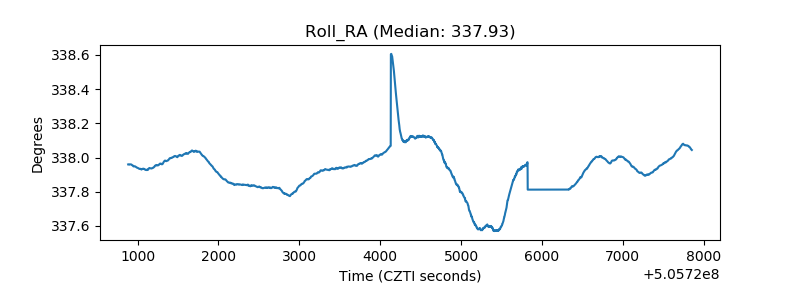 |
| Veto Counter | 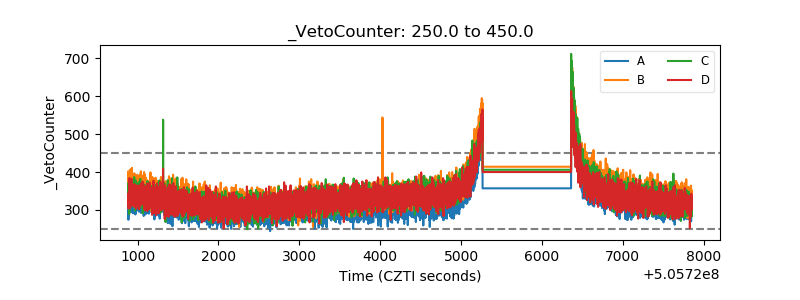 |