| Param | Original file | Final file |
|---|---|---|
| Filename | modeM0/AS1A14_021T06_9000006538_55651cztM0_level2.fits | modeM0/AS1A14_021T06_9000006538_55651cztM0_level2_quad_clean.evt |
| Size (bytes) | 473,592,960 | 92,292,480 |
| Size | 451.7 MB | 88.0 MB |
| Events in quadrant A | 4,351,456 | 622,582 |
| Events in quadrant B | 2,798,455 | 684,311 |
| Events in quadrant C | 2,974,850 | 599,348 |
| Events in quadrant D | 6,883,974 | 420,441 |
| Mode M9 | |||
|---|---|---|---|
| Quadrant | BADHDUFLAG | Total packets | Discarded packets |
| A | 0 | 9 | 0 |
| B | 0 | 9 | 0 |
| C | 0 | 9 | 0 |
| D | 0 | 9 | 0 |
| Mode M0 | |||
|---|---|---|---|
| Quadrant | BADHDUFLAG | Total packets | Discarded packets |
| A | 0 | 17587 | 2 |
| B | 0 | 13682 | 2 |
| C | 0 | 14257 | 2 |
| D | 0 | 25484 | 3 |
| Mode SS | |||
|---|---|---|---|
| Quadrant | BADHDUFLAG | Total packets | Discarded packets |
| A | 0 | 138 | 0 |
| B | 0 | 138 | 0 |
| C | 0 | 138 | 0 |
| D | 0 | 138 | 0 |
| Quadrant | Total seconds | Saturated seconds | Saturation percentage |
|---|---|---|---|
| A | 6704 | 204 | 3.042959% |
| B | 6705 | 83 | 1.237882% |
| C | 6705 | 53 | 0.790455% |
| D | 6704 | 1803 | 26.894391% |
Noise dominated data is calculated using 1-second bins in cleaned event files. If a bin has >2000 counts, and if more than 50% of those come from <1% of pixels, then it is considered to be noise-dominated and hence unusable.
| Quadrant | # 1 sec bins | Bins with >0 counts | Bins with >2000 counts | High rate bins dominated by noise | Noise dominated (total time) | Noise dominated (detector-on time) | Marked lightcurve |
|---|---|---|---|---|---|---|---|
| A | 7679 | 6705 | 114 | 114 | 1.48% | 1.70% | 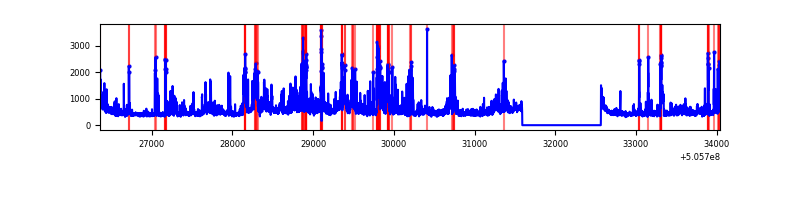 |
| B | 7680 | 6706 | 1 | 1 | 0.01% | 0.01% | 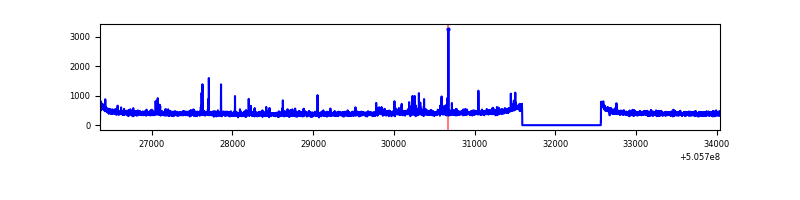 |
| C | 7680 | 6706 | 24 | 24 | 0.31% | 0.36% | 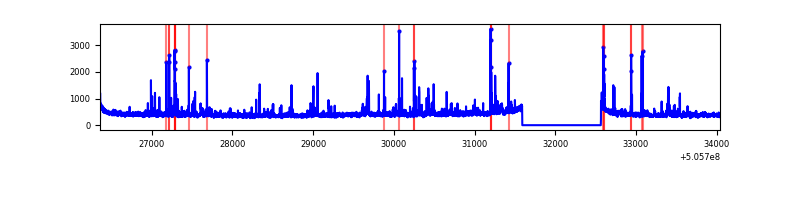 |
| D | 7679 | 6705 | 1697 | 1697 | 22.10% | 25.31% | 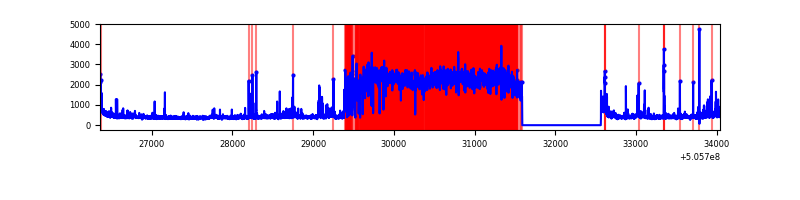 |
Top three noisy pixels from each quadrant. If the there are fewer than three noisy pixels in the level2.evt file, extra rows are filled as -1
| Pixel properties | Quadrant properties | ||||||
|---|---|---|---|---|---|---|---|
| Quadrant | DetID | PixID | Counts | Sigma | Mean | Median | Sigma |
| A | 3 | 14 | 1104061 | 6446.16 | 691 | 673 | 171.2 |
| A | 12 | 115 | 197835 | 1151.85 | 691 | 673 | 171.2 |
| A | 15 | 32 | 184642 | 1074.78 | 691 | 673 | 171.2 |
| B | 0 | 171 | 33333 | 225.58 | 683 | 659 | 144.8 |
| B | 12 | 111 | 17488 | 116.19 | 683 | 659 | 144.8 |
| B | 11 | 111 | 16304 | 108.01 | 683 | 659 | 144.8 |
| C | 13 | 3 | 134027 | 735.14 | 664 | 656 | 181.4 |
| C | 6 | 223 | 78601 | 429.63 | 664 | 656 | 181.4 |
| C | 12 | 250 | 47142 | 256.23 | 664 | 656 | 181.4 |
| D | 7 | 70 | 4036967 | 24273.57 | 594 | 567 | 166.3 |
| D | 11 | 129 | 159595 | 956.34 | 594 | 567 | 166.3 |
| D | 2 | 249 | 64238 | 382.9 | 594 | 567 | 166.3 |
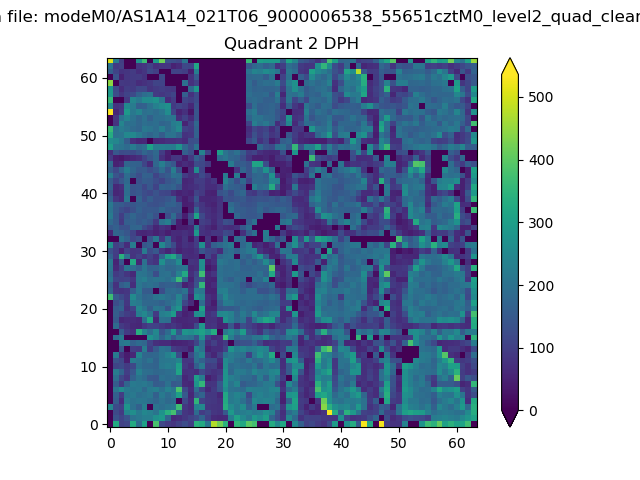
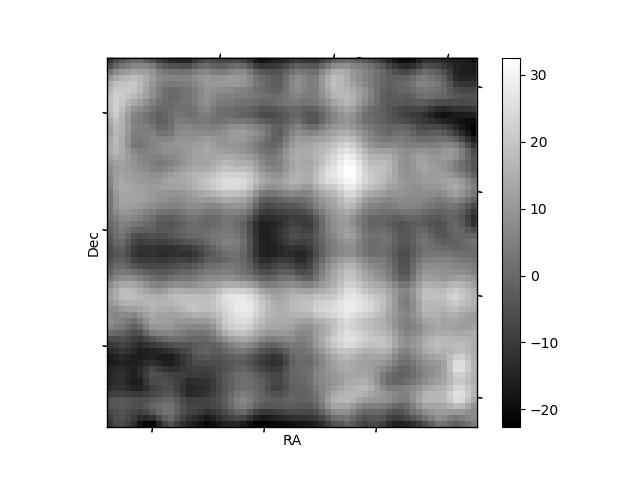
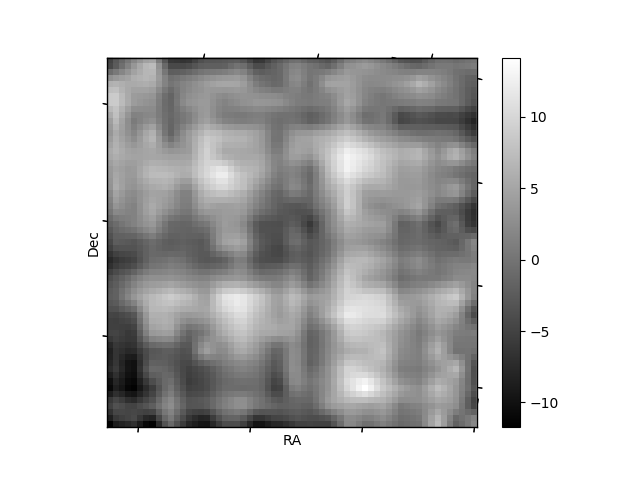
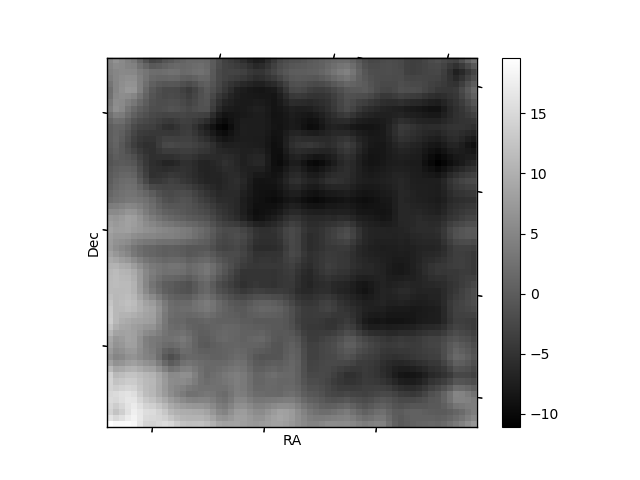
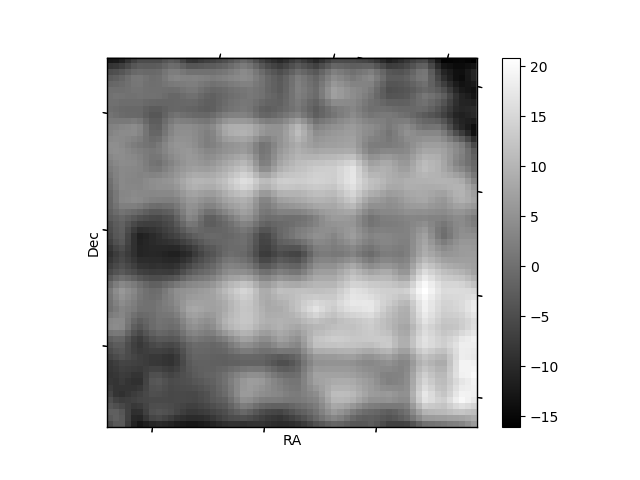
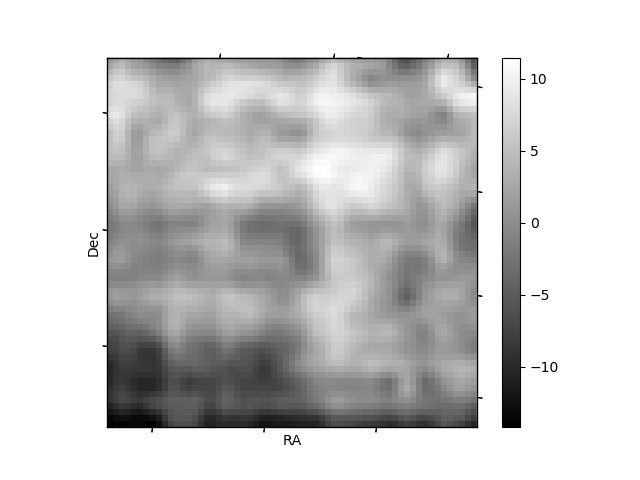
Histogram calculated using DETX and DETY for each event in the final _common_clean file
| Quadrant A | 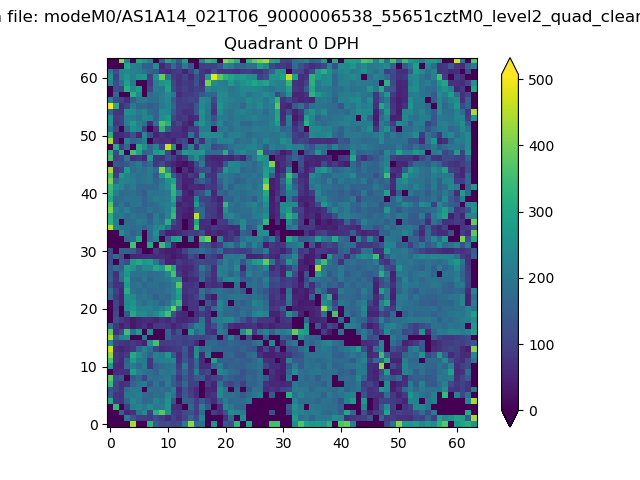 |
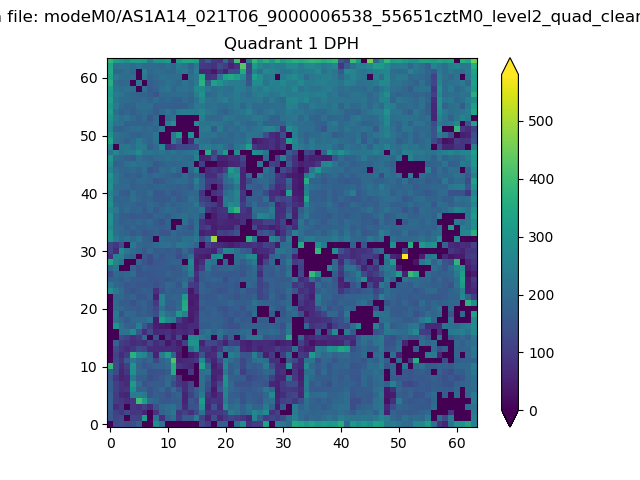 |
Quadrant B |
|---|---|---|---|
| Quadrant D | 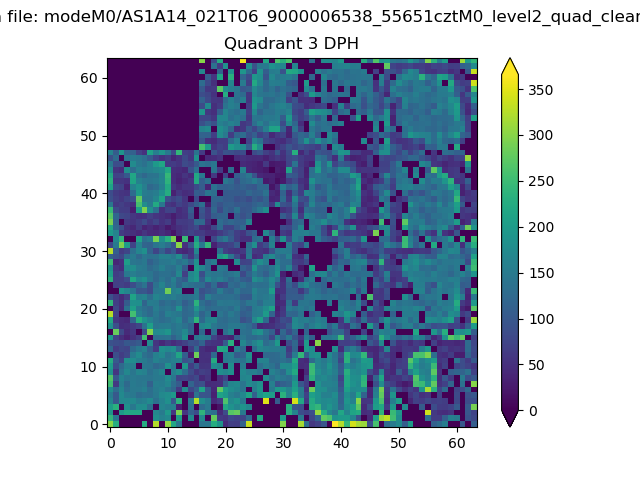 |
 |
Quadrant C |
| Plot type | Count rate plots | Images |
|---|---|---|
| Comparison with Poisson distribution Blue bars denote a histogram of data divided into 1 sec bins. Red curve is a Poisson curve with rate = median count rate of data. |
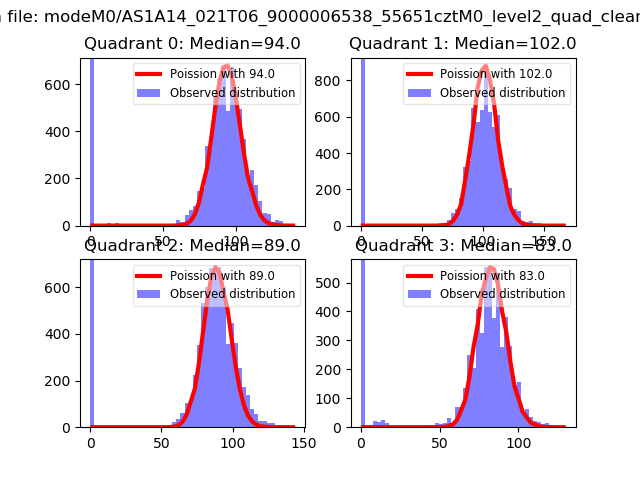 |
 |
| Quadrant-wise count rates Data is divided into 100 sec bins |
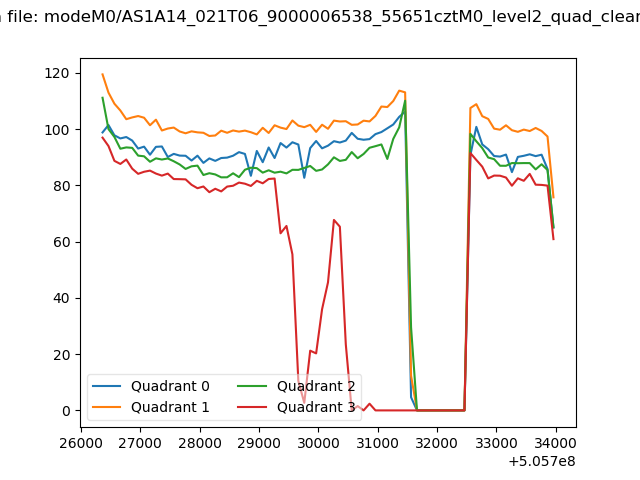 |
|
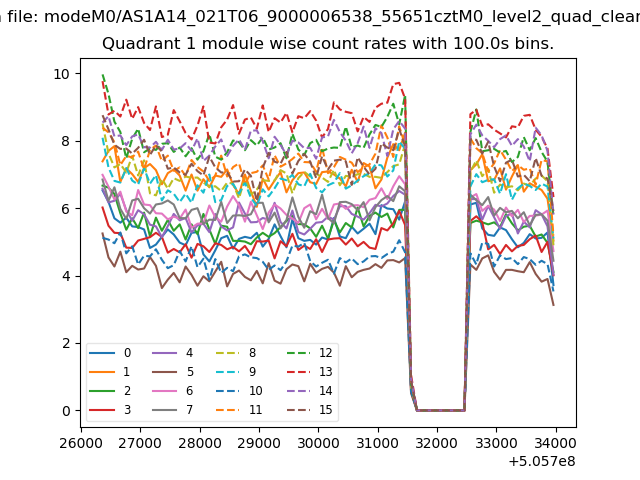
| Module-wise count rates for Quadrant A Data is divided into 100 sec bins |
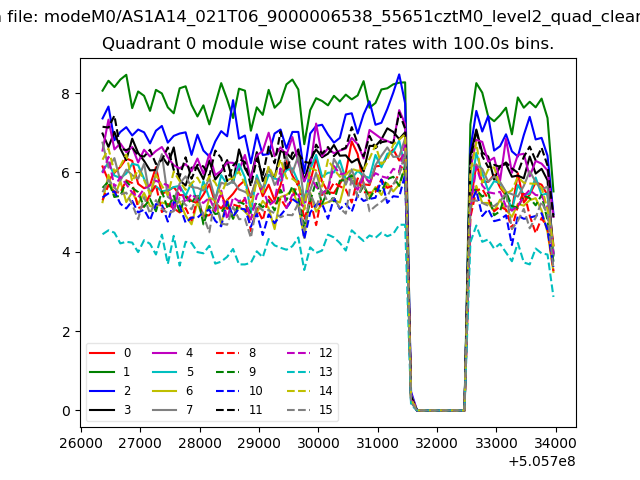 |
 |
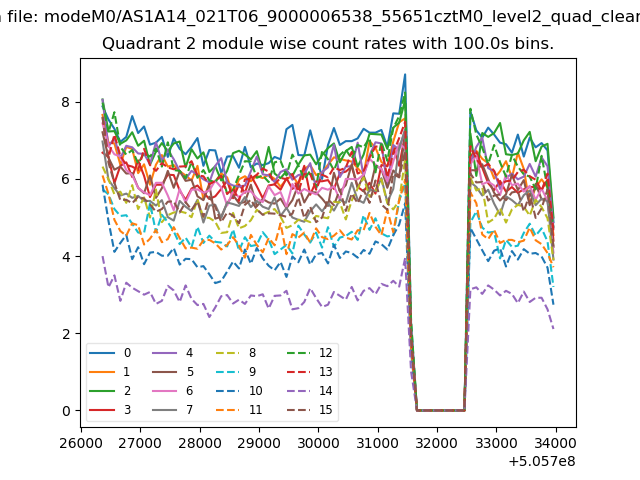
| Module-wise count rates for Quadrant B Data is divided into 100 sec bins |
 |
 |
| Module-wise count rates for Quadrant C Data is divided into 100 sec bins |
 |
 |
| Module-wise count rates for Quadrant D Data is divided into 100 sec bins |
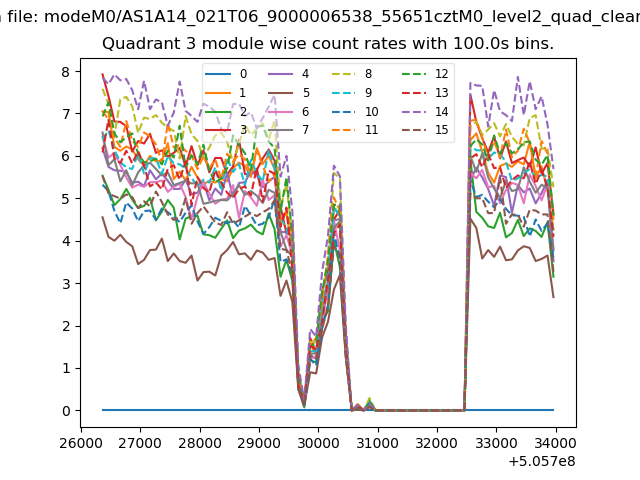 |
 |
| Parameter | Plot |
|---|---|
| CZT HV Monitor | 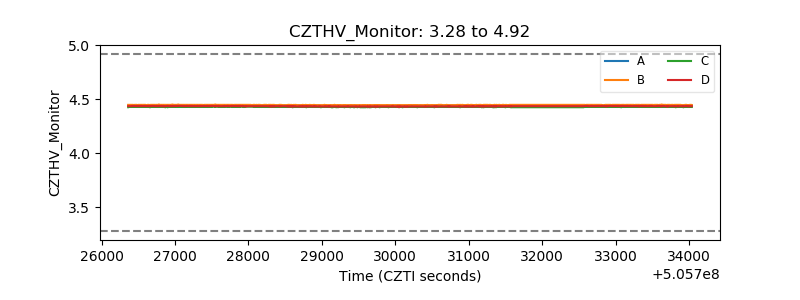 |
| D_VDD | 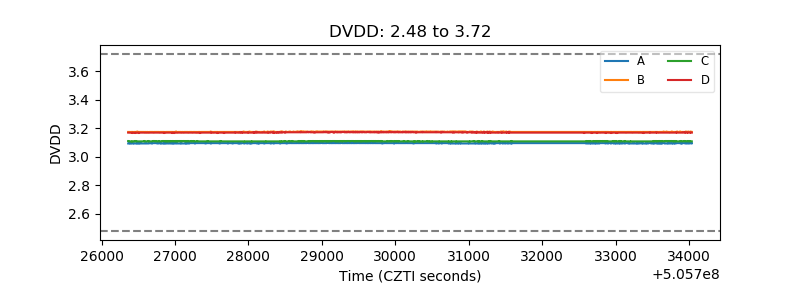 |
| Temperature 1 | 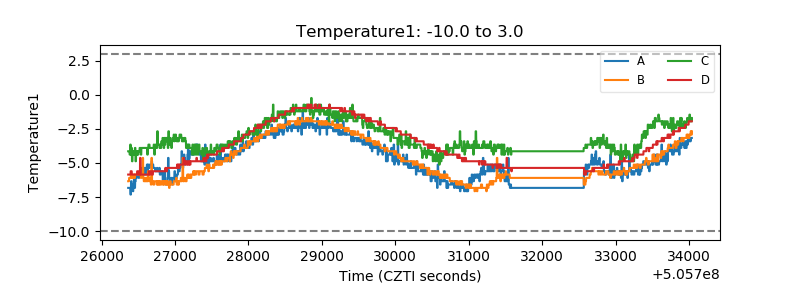 |
| Veto HV Monitor | 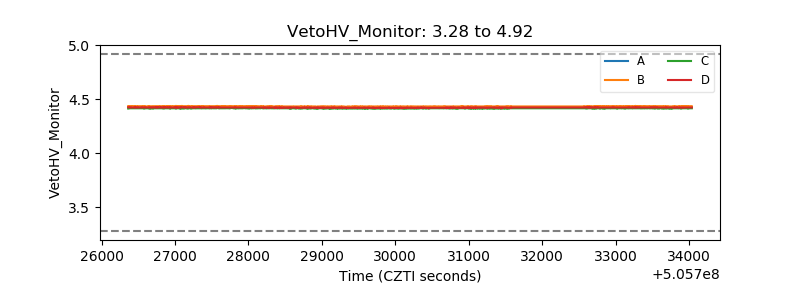 |
| Veto LLD | 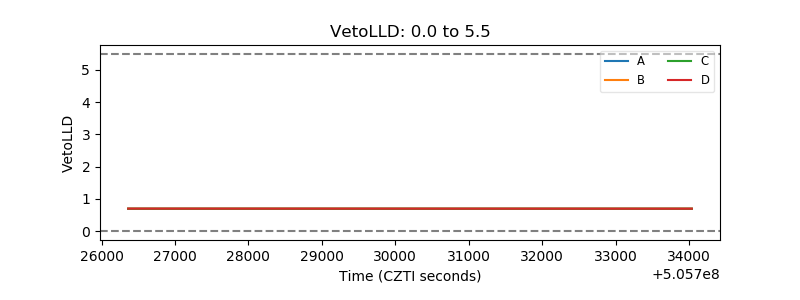 |
| Alpha Counter | 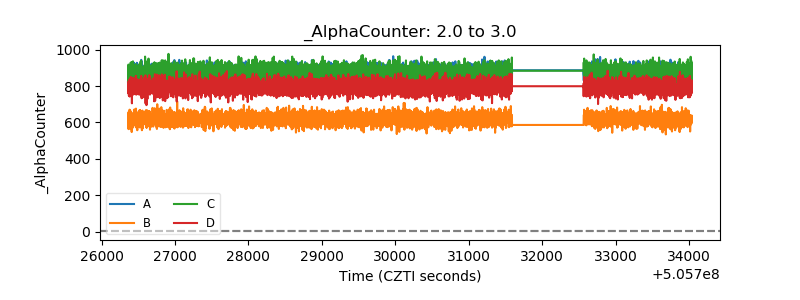 |
| _CPM_Rate | 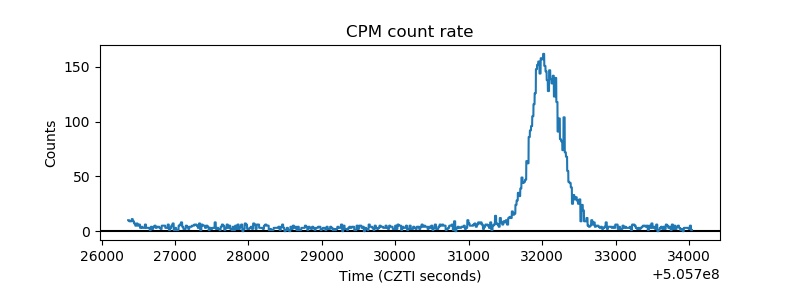 |
| CZT Counter | 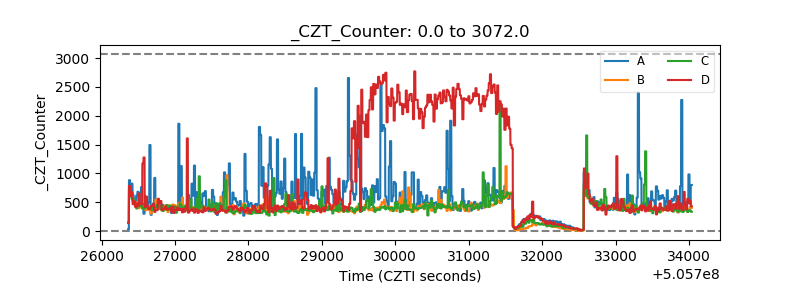 |
| +2.5 Volts monitor | 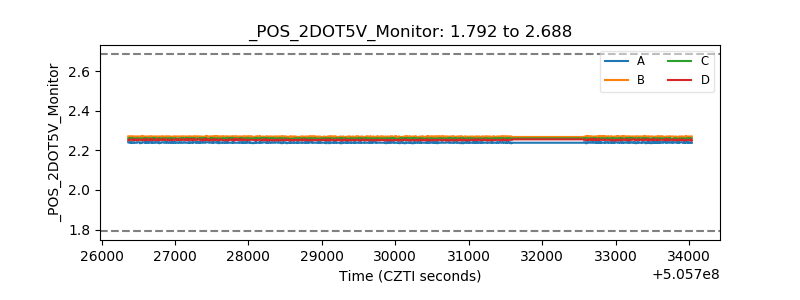 |
| +5 Volts monitor |  |
| _ROLL_ROT |  |
| _Roll_DEC | 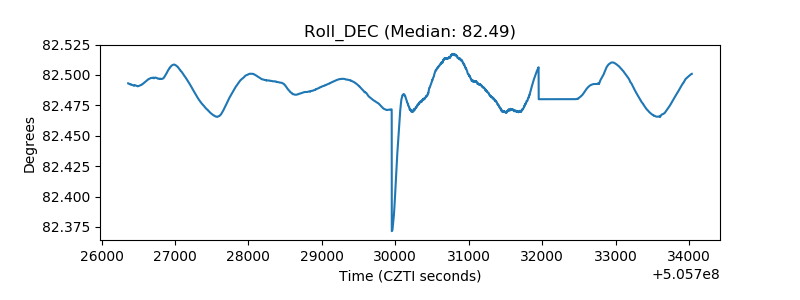 |
| _Roll_RA | 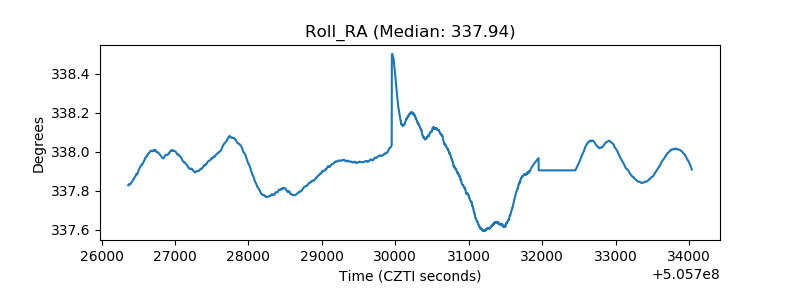 |
| Veto Counter |  |