| Param | Original file | Final file |
|---|---|---|
| Filename | modeM0/AS1A14_021T06_9000006538_55652cztM0_level2.fits | modeM0/AS1A14_021T06_9000006538_55652cztM0_level2_quad_clean.evt |
| Size (bytes) | 467,490,240 | 99,907,200 |
| Size | 445.8 MB | 95.3 MB |
| Events in quadrant A | 5,396,285 | 618,232 |
| Events in quadrant B | 2,989,870 | 710,777 |
| Events in quadrant C | 3,147,693 | 627,318 |
| Events in quadrant D | 5,217,686 | 572,743 |
| Mode M9 | |||
|---|---|---|---|
| Quadrant | BADHDUFLAG | Total packets | Discarded packets |
| A | 0 | 6 | 0 |
| B | 0 | 7 | 0 |
| C | 0 | 7 | 0 |
| D | 0 | 7 | 0 |
| Mode M0 | |||
|---|---|---|---|
| Quadrant | BADHDUFLAG | Total packets | Discarded packets |
| A | 0 | 21020 | 6 |
| B | 0 | 14640 | 2 |
| C | 0 | 15127 | 2 |
| D | 0 | 20569 | 2 |
| Mode SS | |||
|---|---|---|---|
| Quadrant | BADHDUFLAG | Total packets | Discarded packets |
| A | 0 | 146 | 0 |
| B | 0 | 146 | 0 |
| C | 0 | 146 | 0 |
| D | 0 | 146 | 0 |
| Quadrant | Total seconds | Saturated seconds | Saturation percentage |
|---|---|---|---|
| A | 7116 | 556 | 7.813378% |
| B | 7116 | 132 | 1.854975% |
| C | 7116 | 67 | 0.941540% |
| D | 7116 | 353 | 4.960652% |
Noise dominated data is calculated using 1-second bins in cleaned event files. If a bin has >2000 counts, and if more than 50% of those come from <1% of pixels, then it is considered to be noise-dominated and hence unusable.
| Quadrant | # 1 sec bins | Bins with >0 counts | Bins with >2000 counts | High rate bins dominated by noise | Noise dominated (total time) | Noise dominated (detector-on time) | Marked lightcurve |
|---|---|---|---|---|---|---|---|
| A | 7741 | 7117 | 254 | 254 | 3.28% | 3.57% | 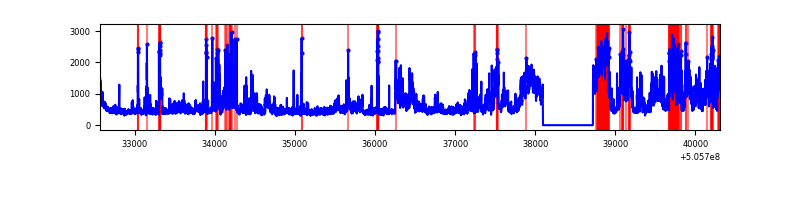 |
| B | 7741 | 7117 | 4 | 4 | 0.05% | 0.06% | 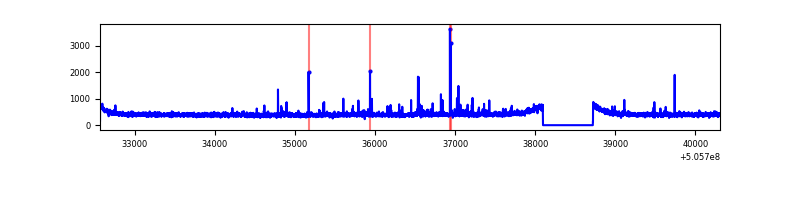 |
| C | 7741 | 7117 | 23 | 23 | 0.30% | 0.32% | 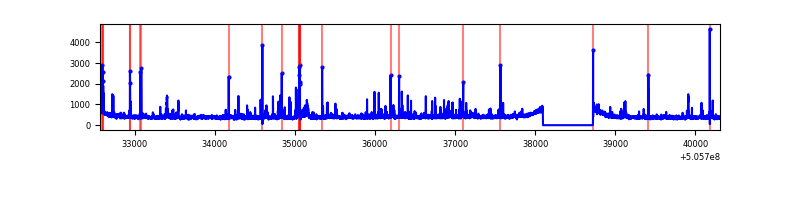 |
| D | 7741 | 7117 | 263 | 263 | 3.40% | 3.70% | 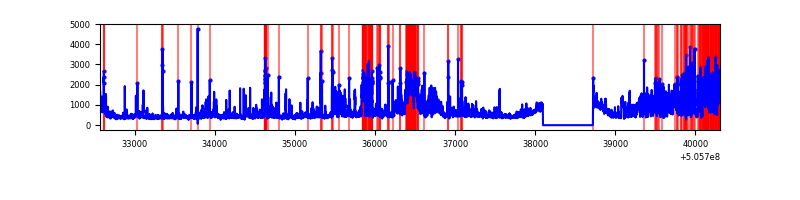 |
Top three noisy pixels from each quadrant. If the there are fewer than three noisy pixels in the level2.evt file, extra rows are filled as -1
| Pixel properties | Quadrant properties | ||||||
|---|---|---|---|---|---|---|---|
| Quadrant | DetID | PixID | Counts | Sigma | Mean | Median | Sigma |
| A | 12 | 115 | 1632571 | 9323.78 | 718 | 699 | 175.0 |
| A | 3 | 14 | 608897 | 3474.97 | 718 | 699 | 175.0 |
| A | 8 | 249 | 81757 | 463.13 | 718 | 699 | 175.0 |
| B | 7 | 252 | 43306 | 273.51 | 728 | 703 | 155.8 |
| B | 12 | 111 | 18682 | 115.43 | 728 | 703 | 155.8 |
| B | 11 | 111 | 17728 | 109.3 | 728 | 703 | 155.8 |
| C | 13 | 3 | 127417 | 657.1 | 709 | 701 | 192.8 |
| C | 15 | 160 | 51722 | 264.57 | 709 | 701 | 192.8 |
| C | 6 | 223 | 40233 | 205.0 | 709 | 701 | 192.8 |
| D | 7 | 70 | 1391210 | 6946.1 | 706 | 672 | 200.2 |
| D | 11 | 129 | 476450 | 2376.64 | 706 | 672 | 200.2 |
| D | 2 | 249 | 150468 | 748.27 | 706 | 672 | 200.2 |
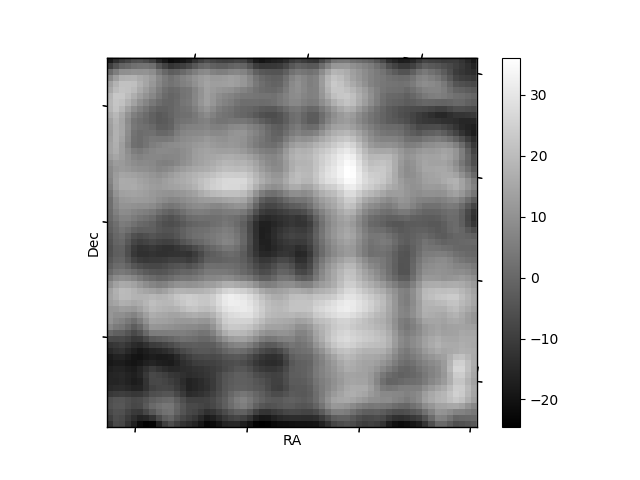
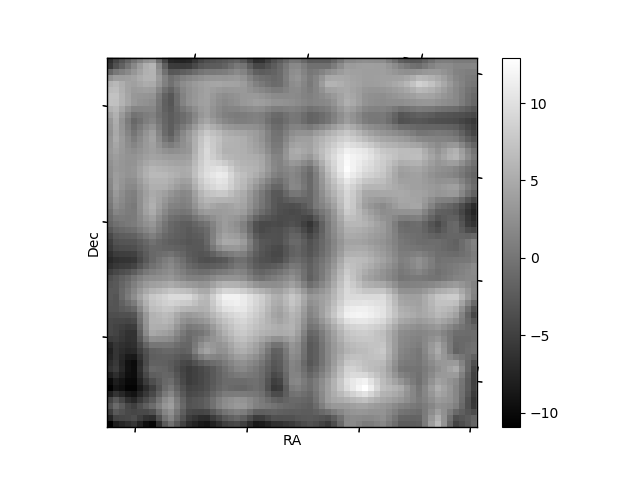
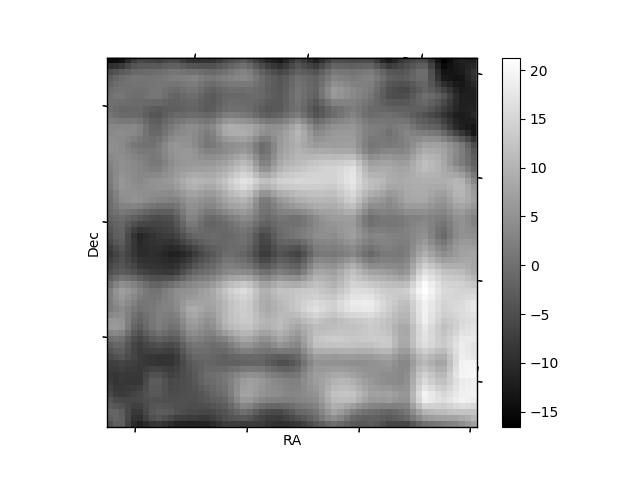
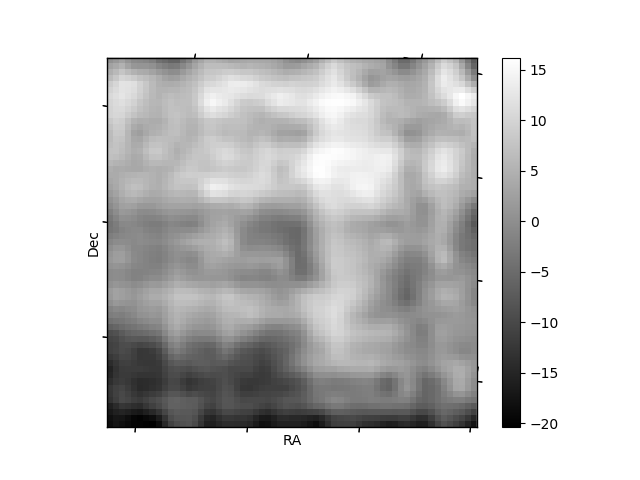
Histogram calculated using DETX and DETY for each event in the final _common_clean file
| Quadrant A | 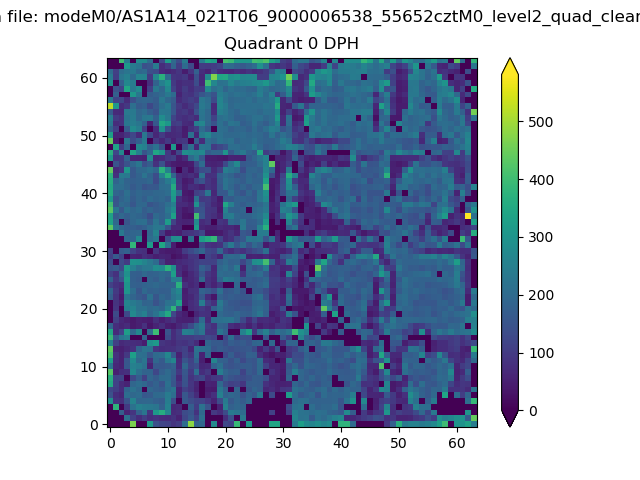 |
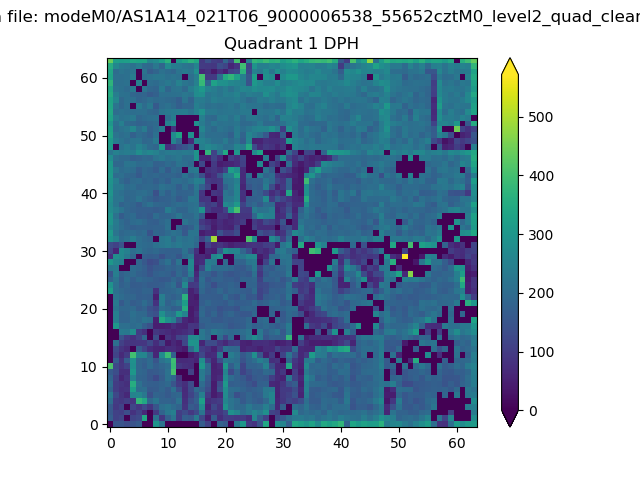 |
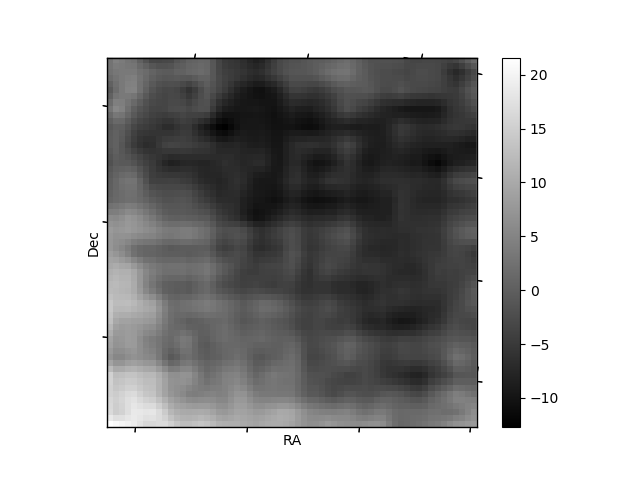
Quadrant B |
|---|---|---|---|
| Quadrant D | 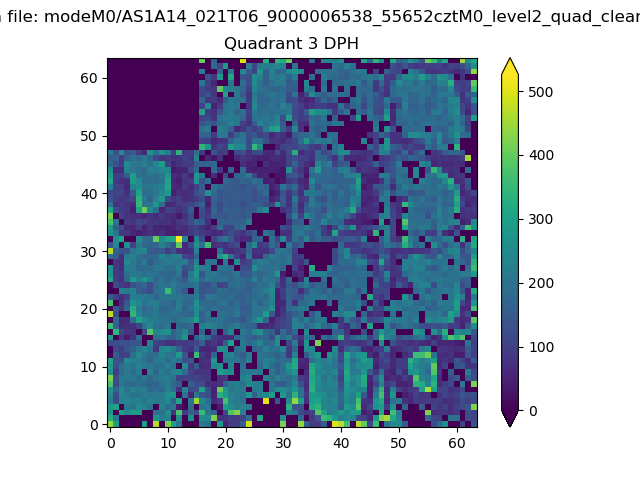 |
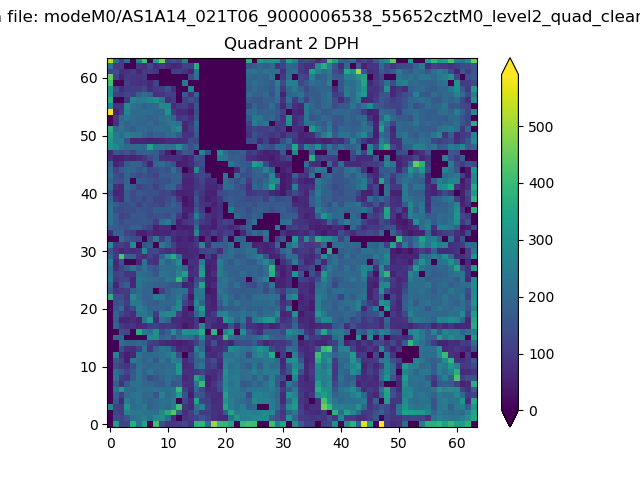 |
Quadrant C |
| Plot type | Count rate plots | Images |
|---|---|---|
| Comparison with Poisson distribution Blue bars denote a histogram of data divided into 1 sec bins. Red curve is a Poisson curve with rate = median count rate of data. |
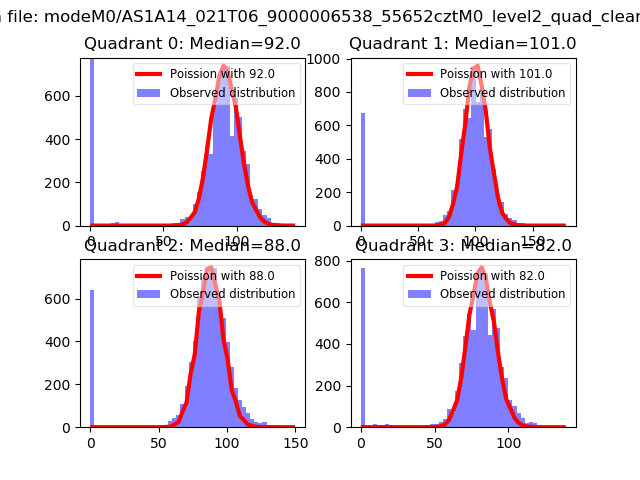 |
 |
| Quadrant-wise count rates Data is divided into 100 sec bins |
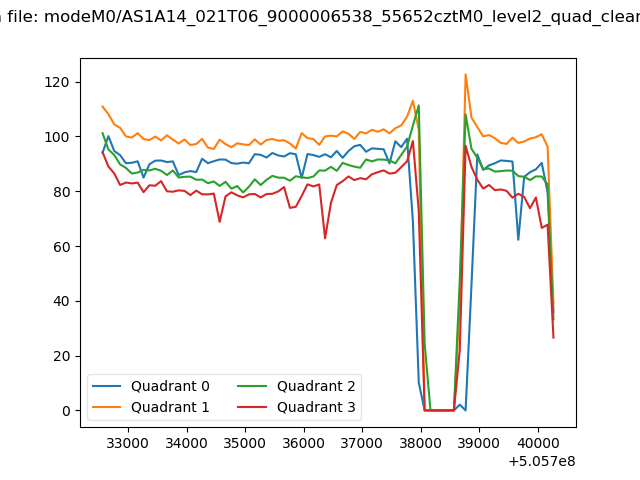 |
|
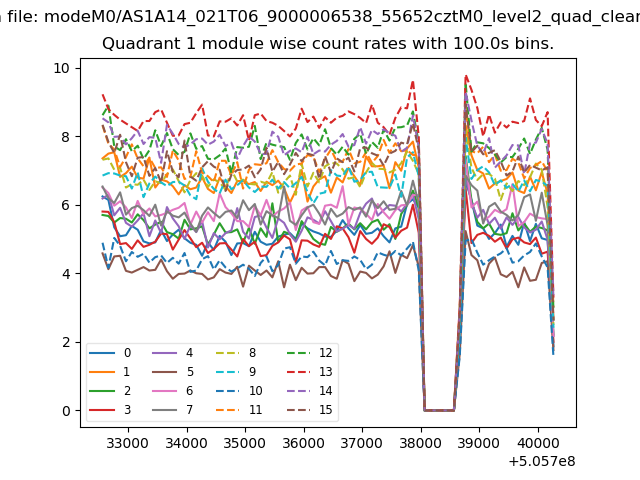
| Module-wise count rates for Quadrant A Data is divided into 100 sec bins |
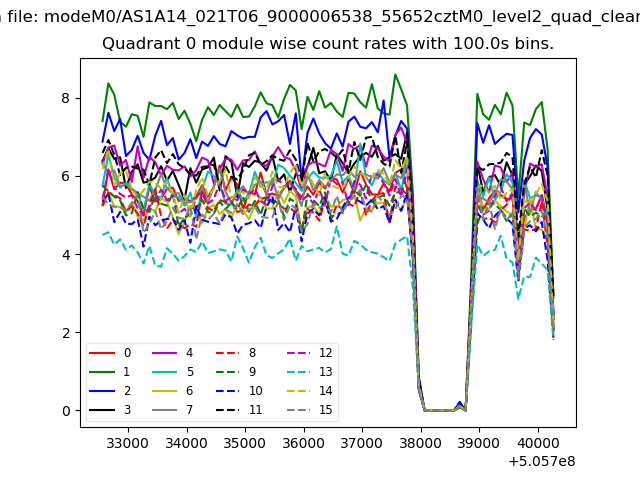 |
 |
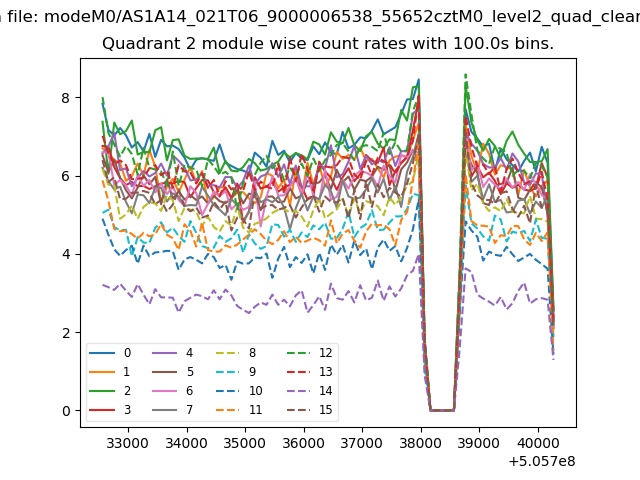
| Module-wise count rates for Quadrant B Data is divided into 100 sec bins |
 |
 |
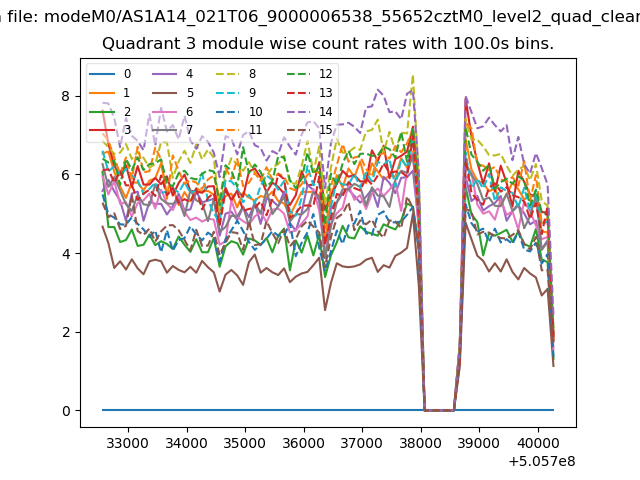
| Module-wise count rates for Quadrant C Data is divided into 100 sec bins |
 |
 |
| Module-wise count rates for Quadrant D Data is divided into 100 sec bins |
 |
 |
| Parameter | Plot |
|---|---|
| CZT HV Monitor |  |
| D_VDD | 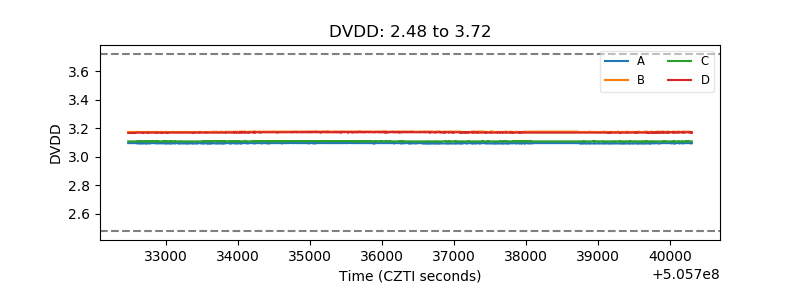 |
| Temperature 1 | 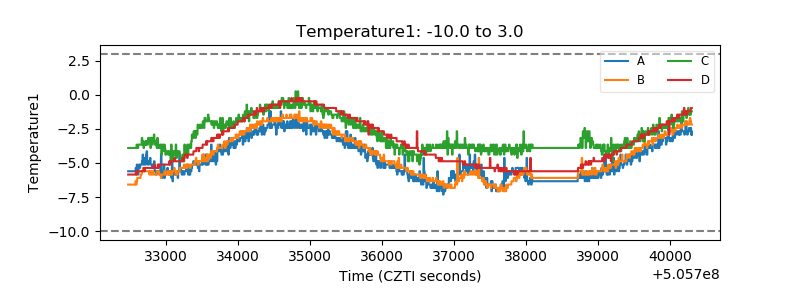 |
| Veto HV Monitor | 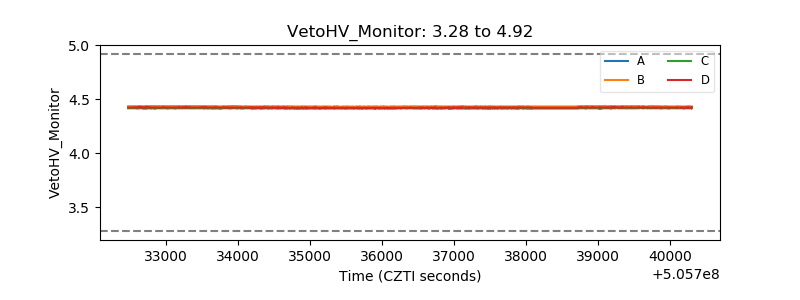 |
| Veto LLD | 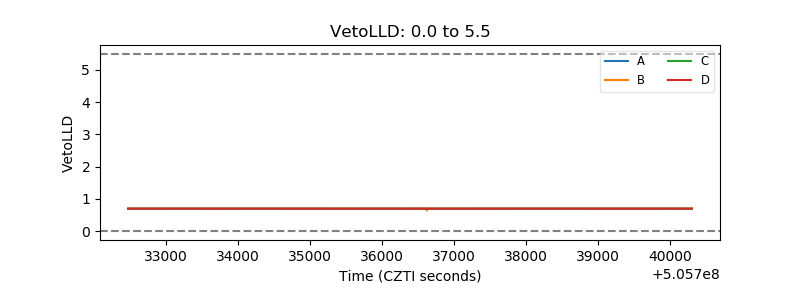 |
| Alpha Counter | 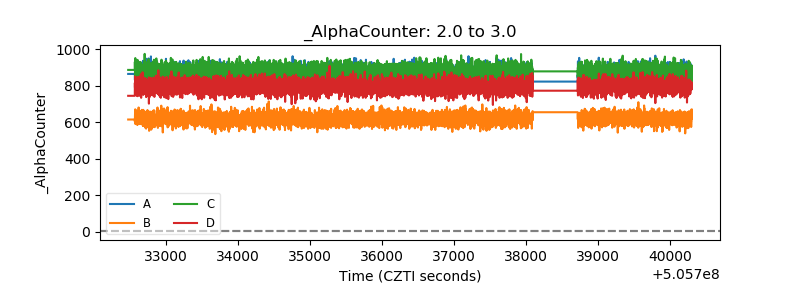 |
| _CPM_Rate | 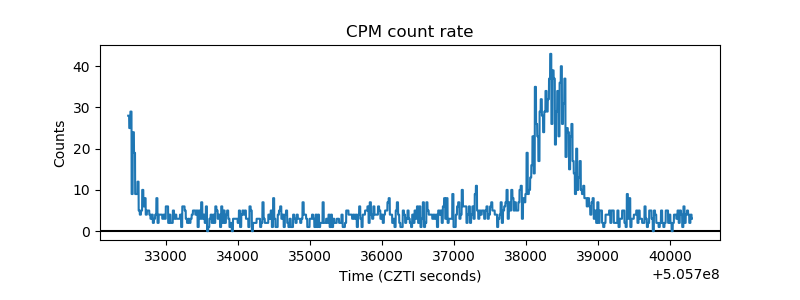 |
| CZT Counter | 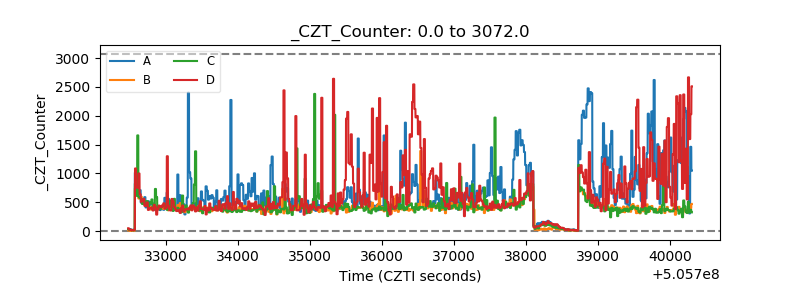 |
| +2.5 Volts monitor |  |
| +5 Volts monitor |  |
| _ROLL_ROT | 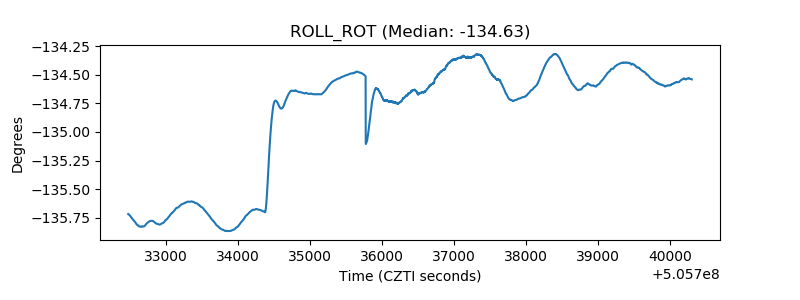 |
| _Roll_DEC | 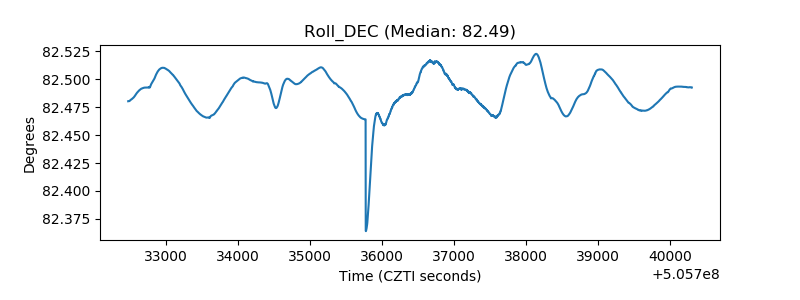 |
| _Roll_RA | 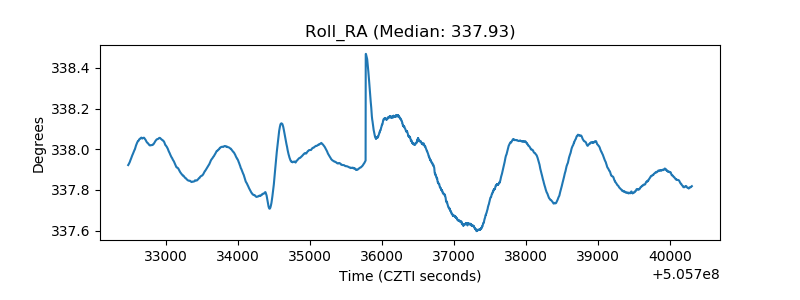 |
| Veto Counter | 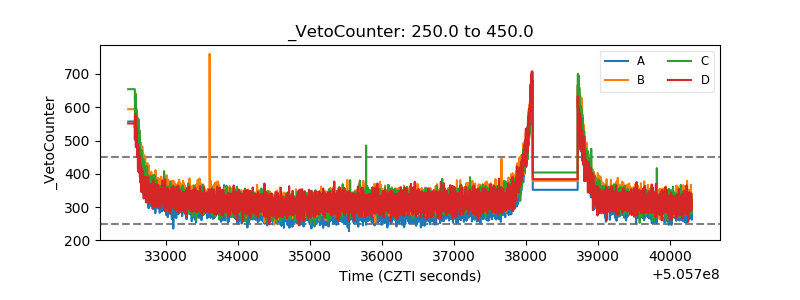 |