| Param | Original file | Final file |
|---|---|---|
| Filename | modeM0/AS1A14_021T06_9000006538_55653cztM0_level2.fits | modeM0/AS1A14_021T06_9000006538_55653cztM0_level2_quad_clean.evt |
| Size (bytes) | 730,229,760 | 99,904,320 |
| Size | 696.4 MB | 95.3 MB |
| Events in quadrant A | 7,292,559 | 649,496 |
| Events in quadrant B | 3,334,752 | 772,154 |
| Events in quadrant C | 3,499,134 | 674,617 |
| Events in quadrant D | 12,306,095 | 391,758 |
| Mode M0 | |||
|---|---|---|---|
| Quadrant | BADHDUFLAG | Total packets | Discarded packets |
| A | 0 | 27016 | 1 |
| B | 0 | 16039 | 1 |
| C | 0 | 16761 | 1 |
| D | 0 | 41894 | 1 |
| Mode SS | |||
|---|---|---|---|
| Quadrant | BADHDUFLAG | Total packets | Discarded packets |
| A | 0 | 156 | 0 |
| B | 0 | 156 | 0 |
| C | 0 | 156 | 0 |
| D | 0 | 156 | 0 |
| Quadrant | Total seconds | Saturated seconds | Saturation percentage |
|---|---|---|---|
| A | 7710 | 867 | 11.245136% |
| B | 7711 | 84 | 1.089353% |
| C | 7711 | 115 | 1.491376% |
| D | 7711 | 3332 | 43.210997% |
Noise dominated data is calculated using 1-second bins in cleaned event files. If a bin has >2000 counts, and if more than 50% of those come from <1% of pixels, then it is considered to be noise-dominated and hence unusable.
| Quadrant | # 1 sec bins | Bins with >0 counts | Bins with >2000 counts | High rate bins dominated by noise | Noise dominated (total time) | Noise dominated (detector-on time) | Marked lightcurve |
|---|---|---|---|---|---|---|---|
| A | 7725 | 7711 | 626 | 626 | 8.10% | 8.12% | 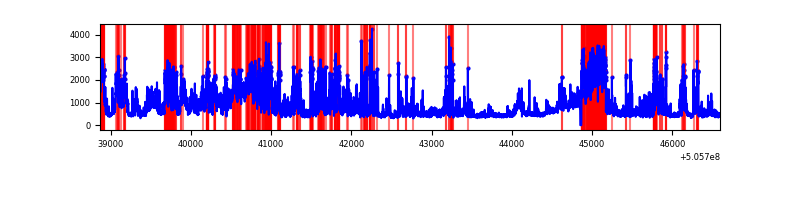 |
| B | 7726 | 7712 | 8 | 8 | 0.10% | 0.10% | 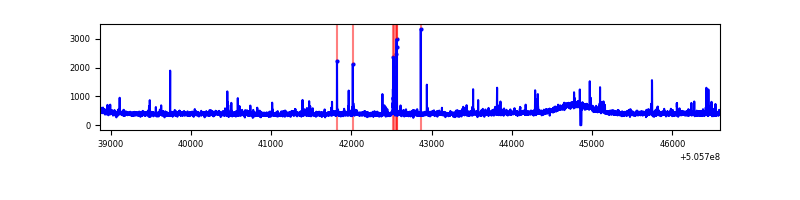 |
| C | 7726 | 7712 | 65 | 65 | 0.84% | 0.84% | 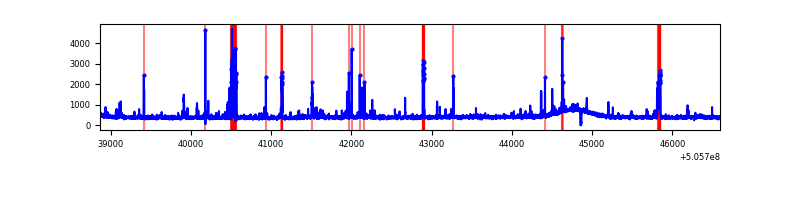 |
| D | 7726 | 7712 | 2958 | 2958 | 38.29% | 38.36% | 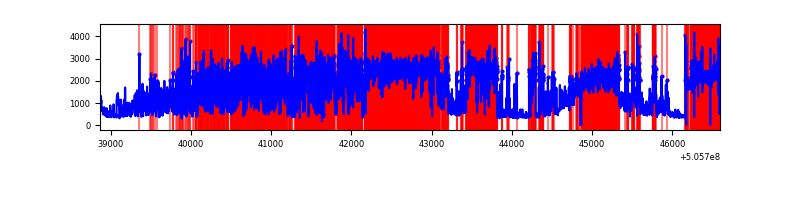 |
Top three noisy pixels from each quadrant. If the there are fewer than three noisy pixels in the level2.evt file, extra rows are filled as -1
| Pixel properties | Quadrant properties | ||||||
|---|---|---|---|---|---|---|---|
| Quadrant | DetID | PixID | Counts | Sigma | Mean | Median | Sigma |
| A | 12 | 115 | 1867595 | 9826.05 | 773 | 750 | 190.0 |
| A | 3 | 14 | 999944 | 5259.21 | 773 | 750 | 190.0 |
| A | 15 | 32 | 410812 | 2158.34 | 773 | 750 | 190.0 |
| B | 7 | 252 | 80451 | 462.55 | 797 | 767 | 172.3 |
| B | 0 | 171 | 26254 | 147.95 | 797 | 767 | 172.3 |
| B | 12 | 111 | 20685 | 115.62 | 797 | 767 | 172.3 |
| C | 13 | 3 | 186388 | 881.96 | 780 | 775 | 210.5 |
| C | 12 | 250 | 90810 | 427.81 | 780 | 775 | 210.5 |
| C | 10 | 19 | 86875 | 409.12 | 780 | 775 | 210.5 |
| D | 7 | 70 | 8787039 | 48553.76 | 637 | 605 | 181.0 |
| D | 8 | 245 | 536810 | 2963.06 | 637 | 605 | 181.0 |
| D | 11 | 129 | 127273 | 699.97 | 637 | 605 | 181.0 |
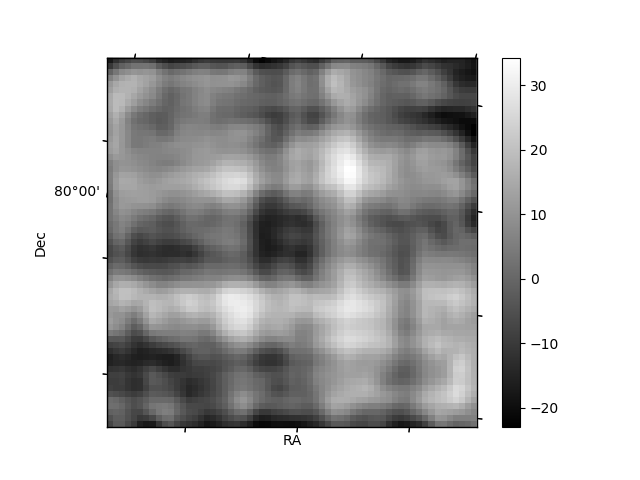
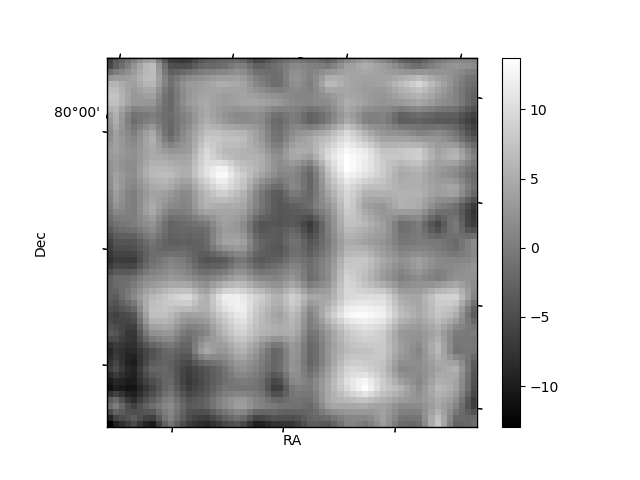
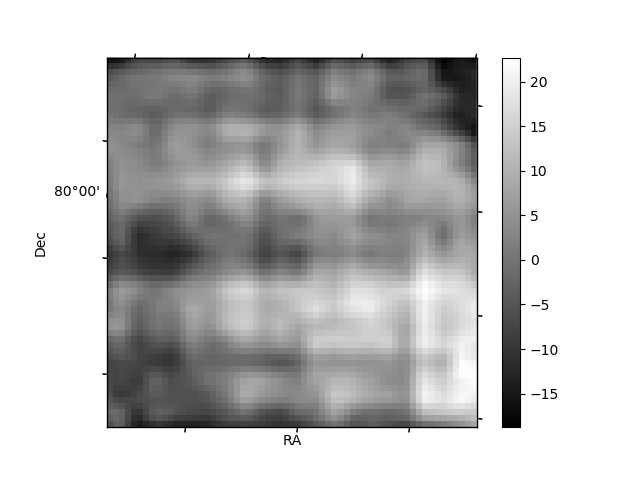
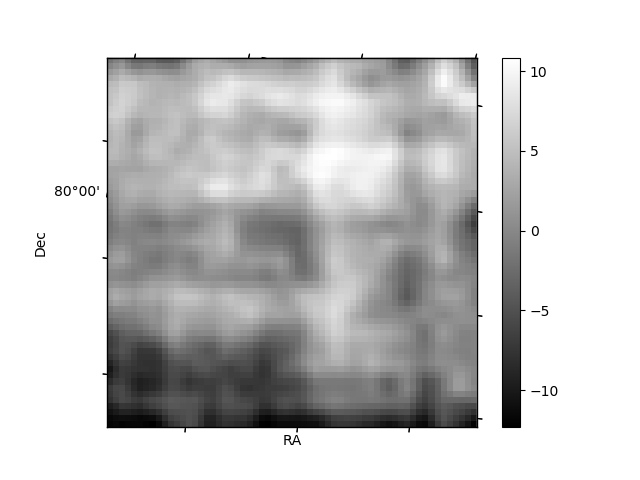
Histogram calculated using DETX and DETY for each event in the final _common_clean file
| Quadrant A | 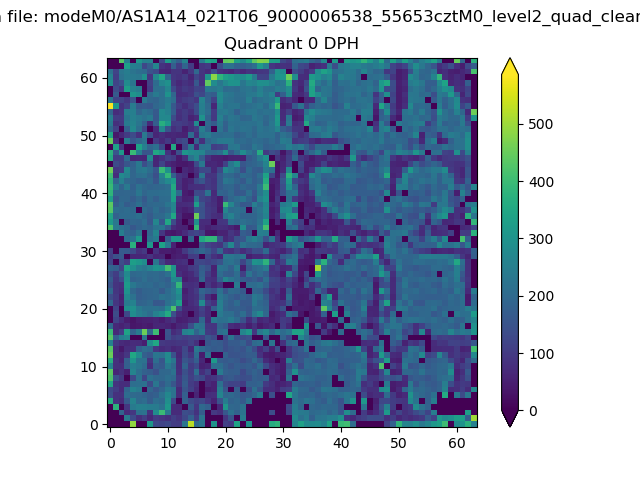 |
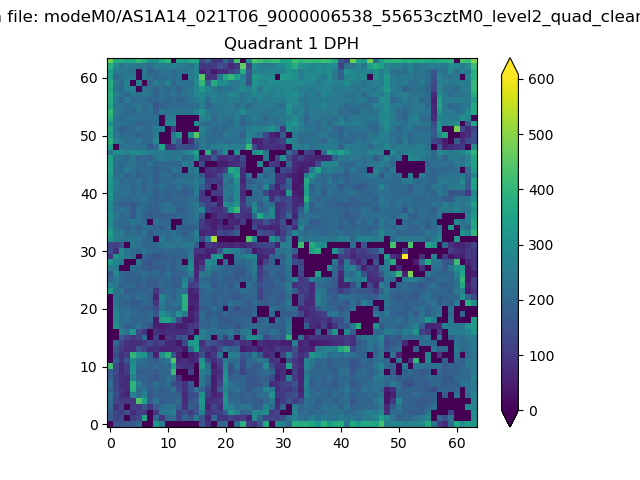 |
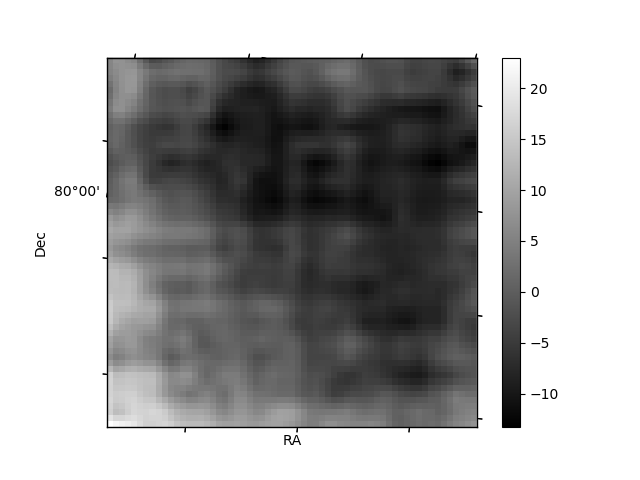
Quadrant B |
|---|---|---|---|
| Quadrant D | 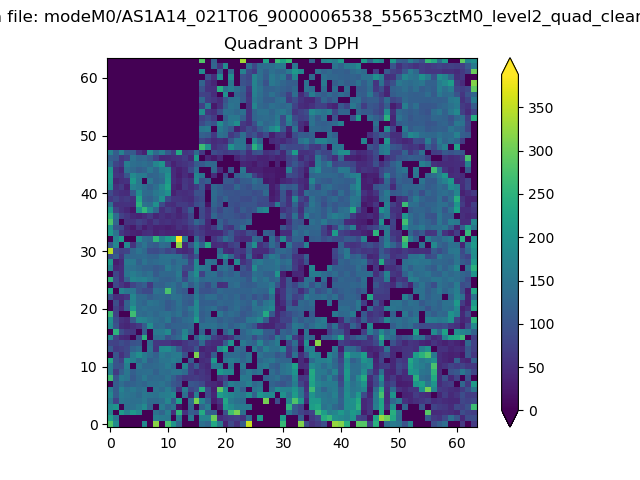 |
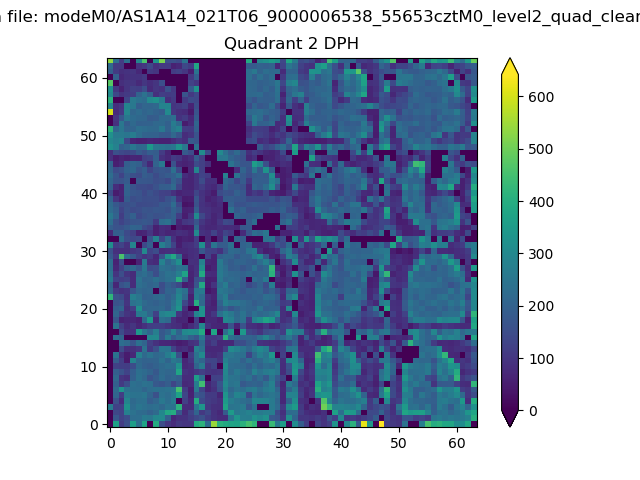 |
Quadrant C |
| Plot type | Count rate plots | Images |
|---|---|---|
| Comparison with Poisson distribution Blue bars denote a histogram of data divided into 1 sec bins. Red curve is a Poisson curve with rate = median count rate of data. |
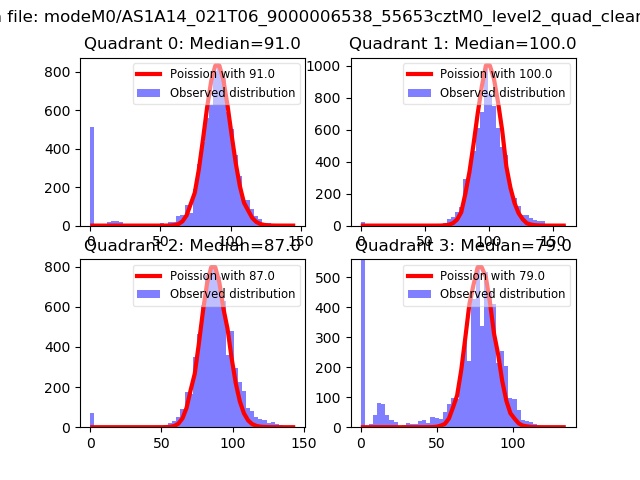 |
 |
| Quadrant-wise count rates Data is divided into 100 sec bins |
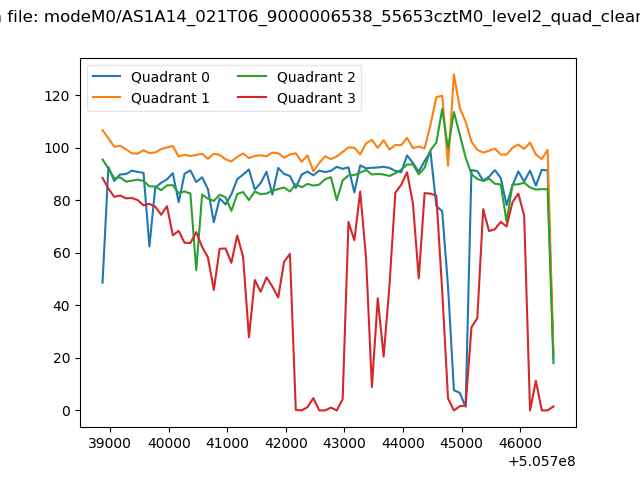 |
|
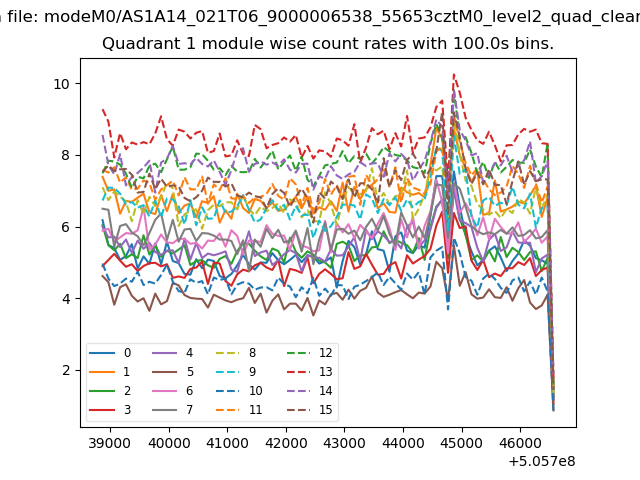
| Module-wise count rates for Quadrant A Data is divided into 100 sec bins |
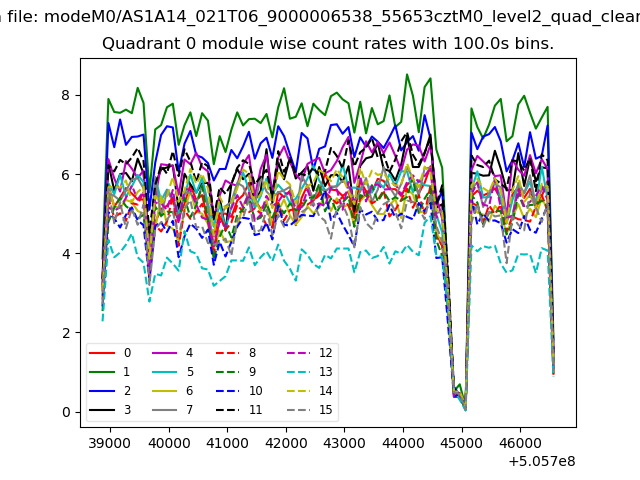 |
 |
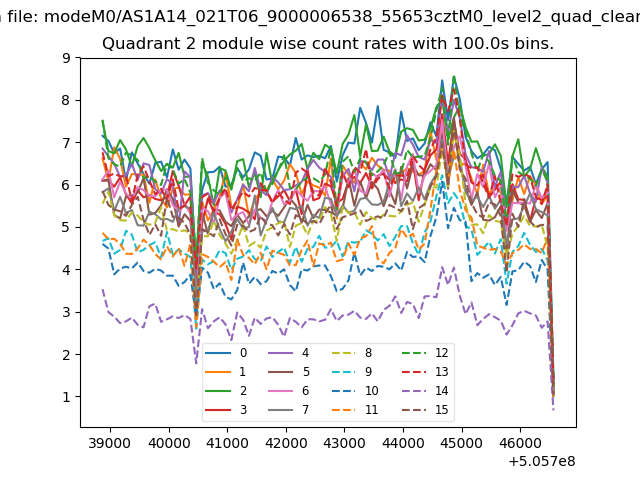
| Module-wise count rates for Quadrant B Data is divided into 100 sec bins |
 |
 |
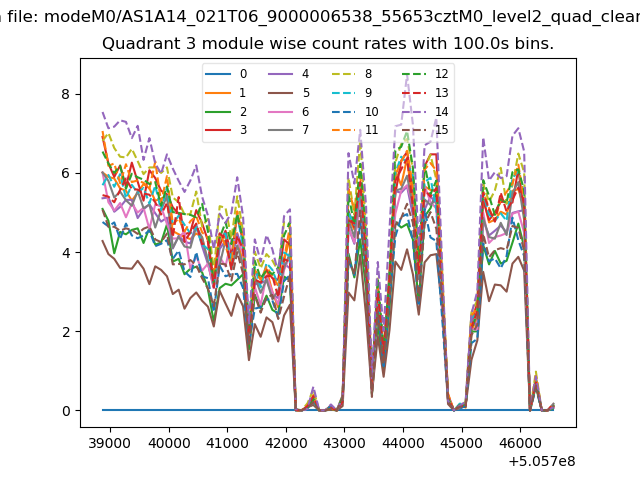
| Module-wise count rates for Quadrant C Data is divided into 100 sec bins |
 |
 |
| Module-wise count rates for Quadrant D Data is divided into 100 sec bins |
 |
 |
| Parameter | Plot |
|---|---|
| CZT HV Monitor |  |
| D_VDD | 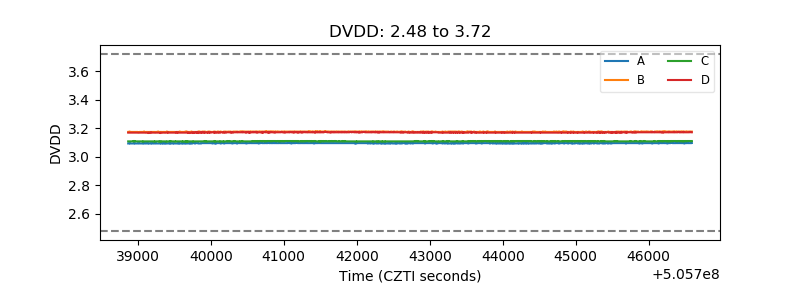 |
| Temperature 1 | 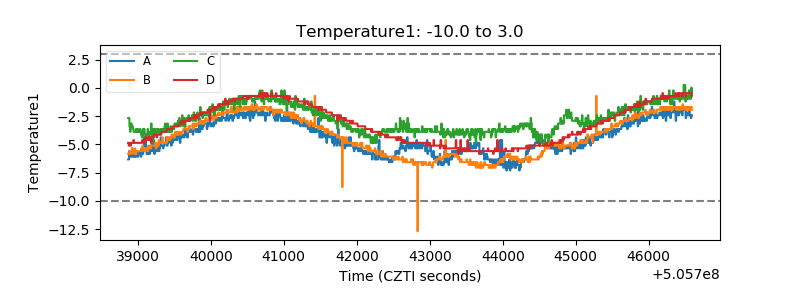 |
| Veto HV Monitor | 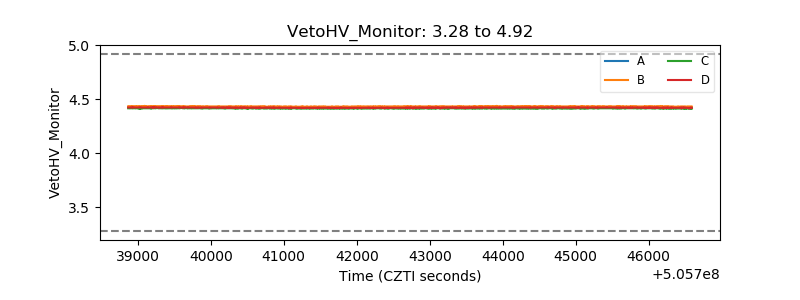 |
| Veto LLD | 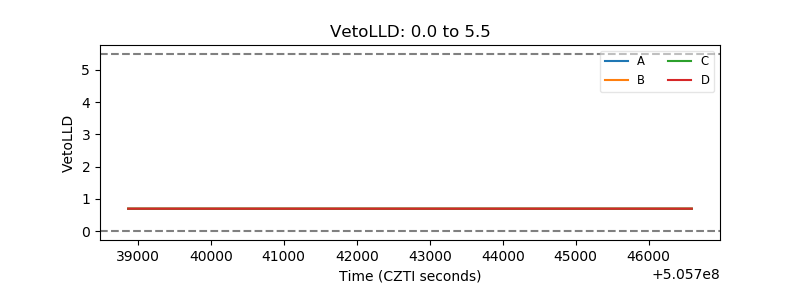 |
| Alpha Counter | 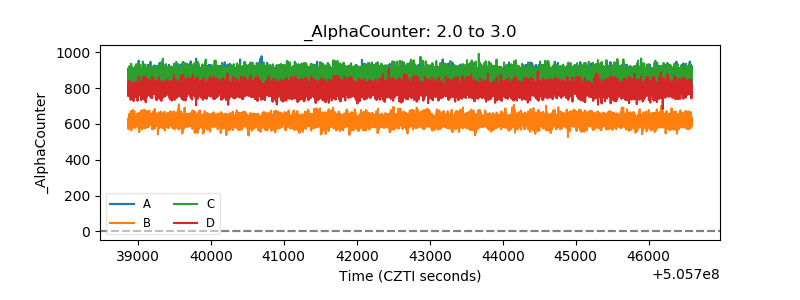 |
| _CPM_Rate | 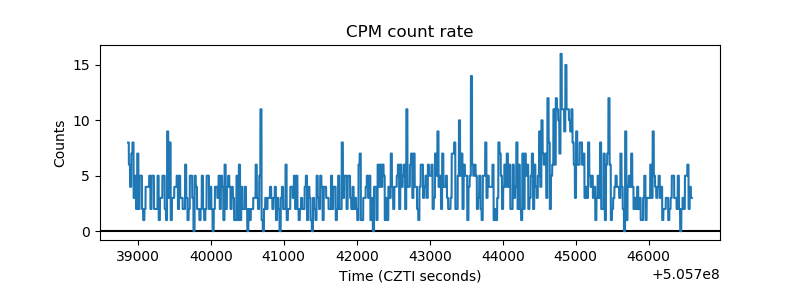 |
| CZT Counter | 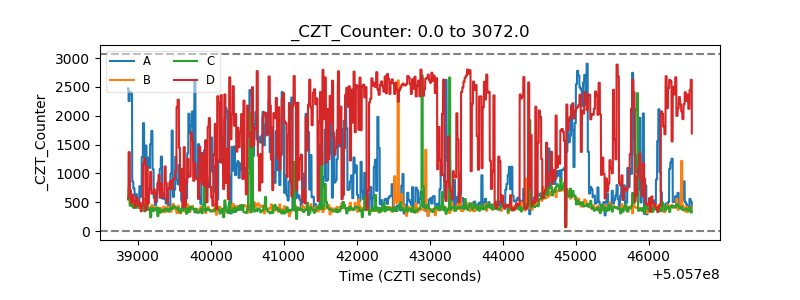 |
| +2.5 Volts monitor |  |
| +5 Volts monitor |  |
| _ROLL_ROT | 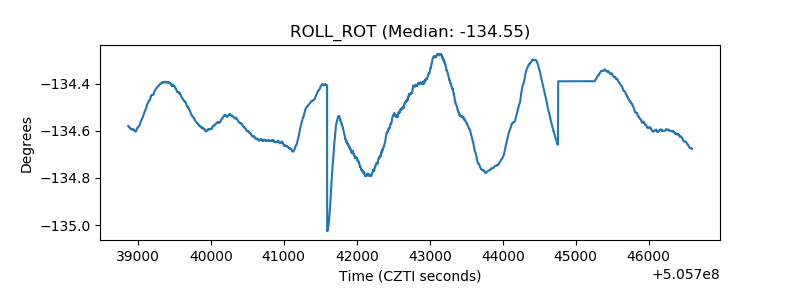 |
| _Roll_DEC | 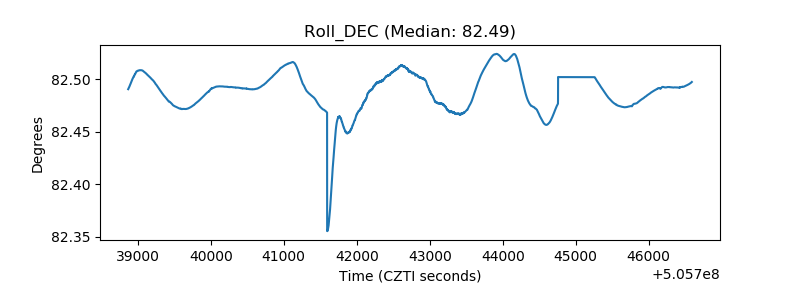 |
| _Roll_RA | 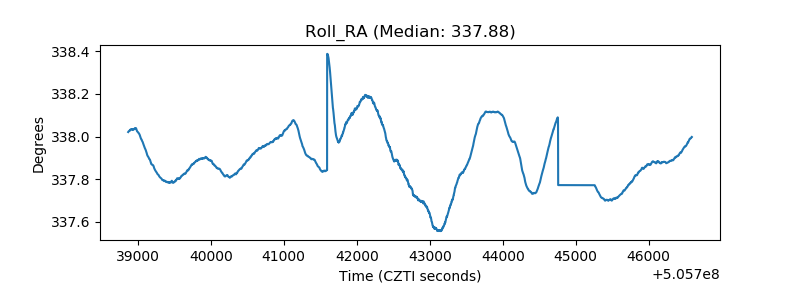 |
| Veto Counter | 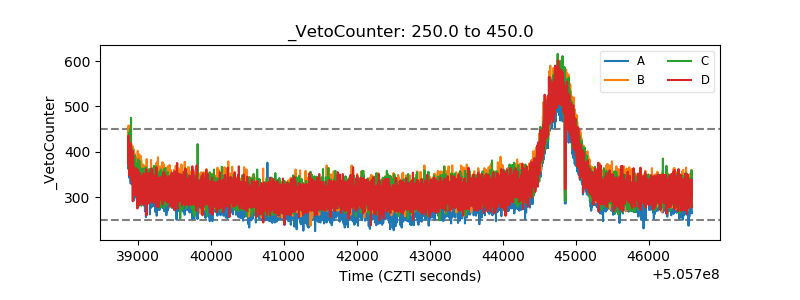 |