| Param | Original file | Final file |
|---|---|---|
| Filename | modeM0/AS1A14_021T06_9000006538_55658cztM0_level2.fits | modeM0/AS1A14_021T06_9000006538_55658cztM0_level2_quad_clean.evt |
| Size (bytes) | 1,186,444,800 | 258,333,120 |
| Size | 1.1 GB | 246.4 MB |
| Events in quadrant A | 10,549,559 | 1,669,123 |
| Events in quadrant B | 8,469,214 | 1,801,867 |
| Events in quadrant C | 9,261,146 | 1,597,722 |
| Events in quadrant D | 14,193,939 | 1,467,327 |
| Mode M9 | |||
|---|---|---|---|
| Quadrant | BADHDUFLAG | Total packets | Discarded packets |
| A | 0 | 14 | 0 |
| B | 0 | 14 | 0 |
| C | 0 | 14 | 0 |
| D | 0 | 14 | 0 |
| Mode M0 | |||
|---|---|---|---|
| Quadrant | BADHDUFLAG | Total packets | Discarded packets |
| A | 0 | 44982 | 3 |
| B | 0 | 39780 | 3 |
| C | 0 | 42133 | 3 |
| D | 0 | 55261 | 3 |
| Mode SS | |||
|---|---|---|---|
| Quadrant | BADHDUFLAG | Total packets | Discarded packets |
| A | 0 | 378 | 0 |
| B | 0 | 378 | 0 |
| C | 0 | 378 | 0 |
| D | 0 | 378 | 0 |
| Quadrant | Total seconds | Saturated seconds | Saturation percentage |
|---|---|---|---|
| A | 18657 | 355 | 1.902771% |
| B | 18657 | 210 | 1.125583% |
| C | 18657 | 297 | 1.591896% |
| D | 18658 | 855 | 4.582485% |
Noise dominated data is calculated using 1-second bins in cleaned event files. If a bin has >2000 counts, and if more than 50% of those come from <1% of pixels, then it is considered to be noise-dominated and hence unusable.
| Quadrant | # 1 sec bins | Bins with >0 counts | Bins with >2000 counts | High rate bins dominated by noise | Noise dominated (total time) | Noise dominated (detector-on time) | Marked lightcurve |
|---|---|---|---|---|---|---|---|
| A | 20022 | 18660 | 246 | 246 | 1.23% | 1.32% | 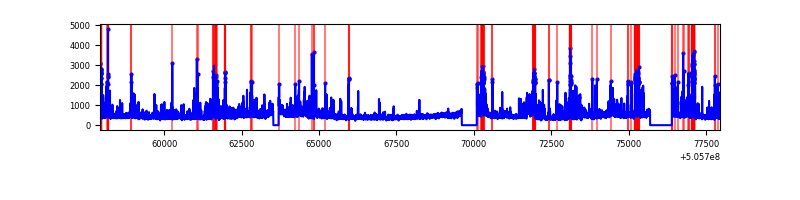 |
| B | 20022 | 18660 | 54 | 54 | 0.27% | 0.29% | 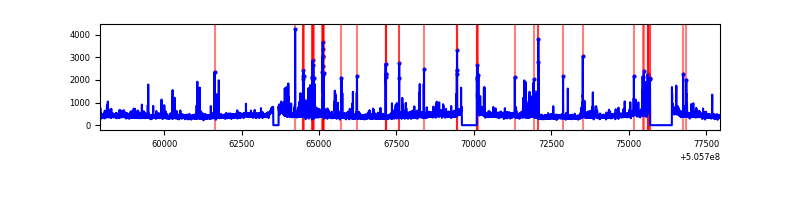 |
| C | 20022 | 18660 | 219 | 219 | 1.09% | 1.17% | 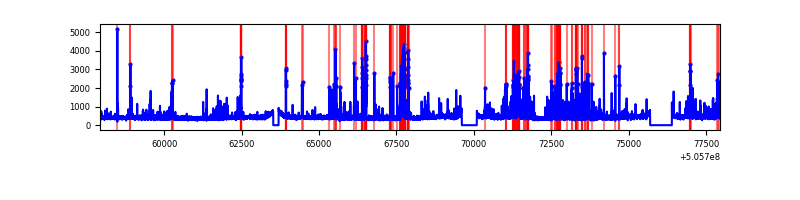 |
| D | 20023 | 18661 | 968 | 968 | 4.83% | 5.19% | 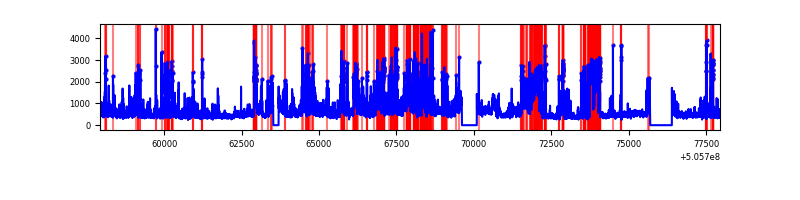 |
Top three noisy pixels from each quadrant. If the there are fewer than three noisy pixels in the level2.evt file, extra rows are filled as -1
| Pixel properties | Quadrant properties | ||||||
|---|---|---|---|---|---|---|---|
| Quadrant | DetID | PixID | Counts | Sigma | Mean | Median | Sigma |
| A | 8 | 249 | 825847 | 1752.01 | 1908 | 1864 | 470.3 |
| A | 0 | 8 | 698674 | 1481.6 | 1908 | 1864 | 470.3 |
| A | 3 | 14 | 684469 | 1451.4 | 1908 | 1864 | 470.3 |
| B | 5 | 172 | 704066 | 1738.49 | 1896 | 1824 | 403.9 |
| B | 7 | 252 | 102013 | 248.03 | 1896 | 1824 | 403.9 |
| B | 12 | 111 | 49425 | 117.84 | 1896 | 1824 | 403.9 |
| C | 12 | 250 | 832427 | 1628.28 | 1867 | 1848 | 510.1 |
| C | 6 | 223 | 290577 | 566.03 | 1867 | 1848 | 510.1 |
| C | 13 | 3 | 261990 | 509.99 | 1867 | 1848 | 510.1 |
| D | 8 | 245 | 4734365 | 9087.55 | 1849 | 1769 | 520.8 |
| D | 7 | 70 | 636961 | 1219.7 | 1849 | 1769 | 520.8 |
| D | 11 | 129 | 472712 | 904.31 | 1849 | 1769 | 520.8 |
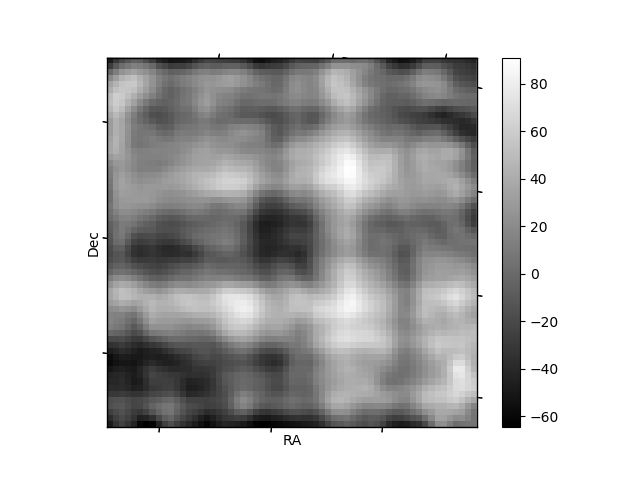
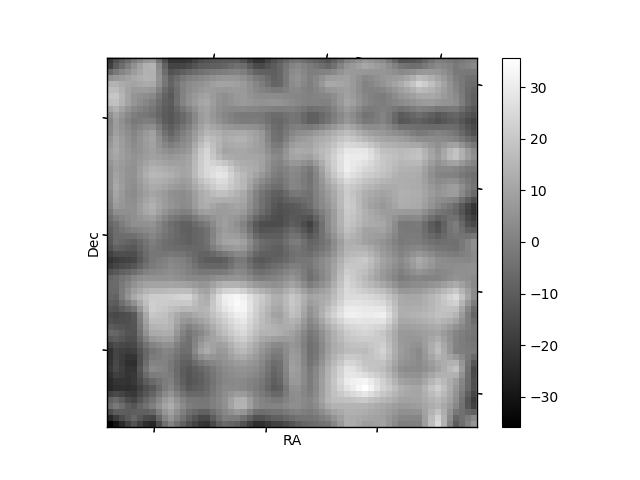
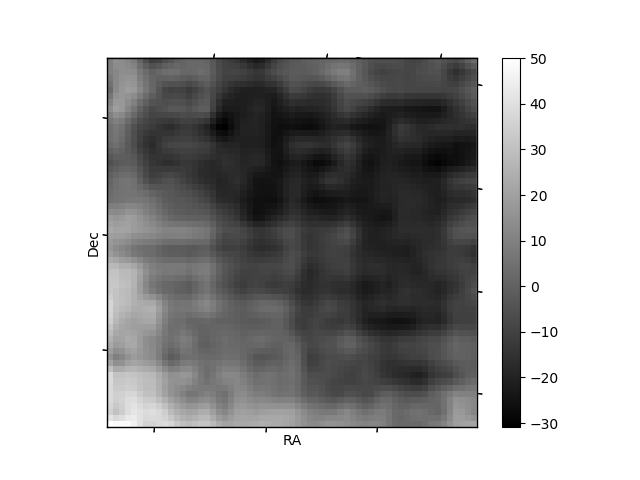
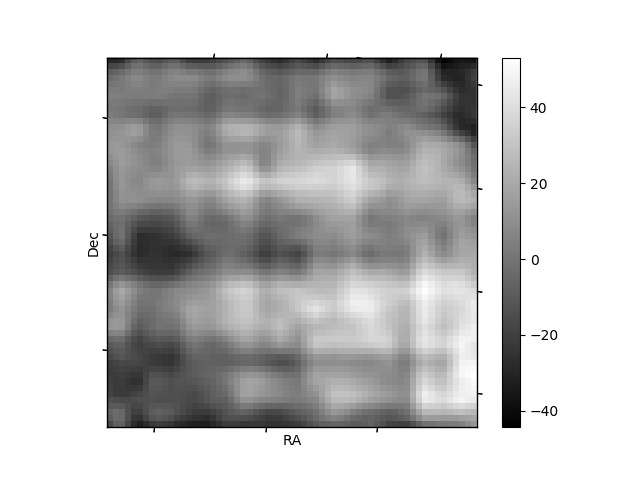
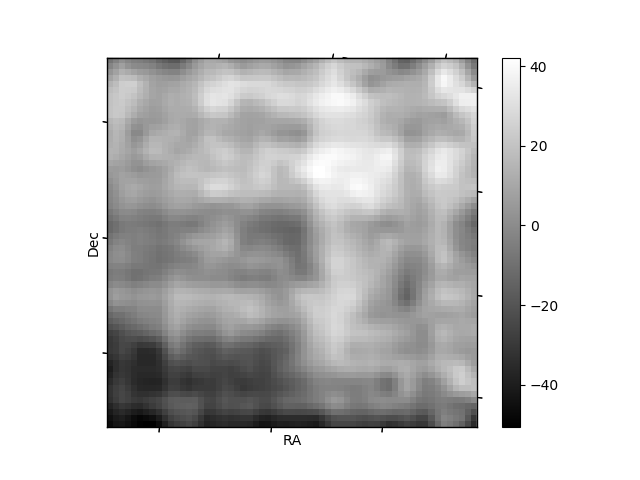
Histogram calculated using DETX and DETY for each event in the final _common_clean file
| Quadrant A | 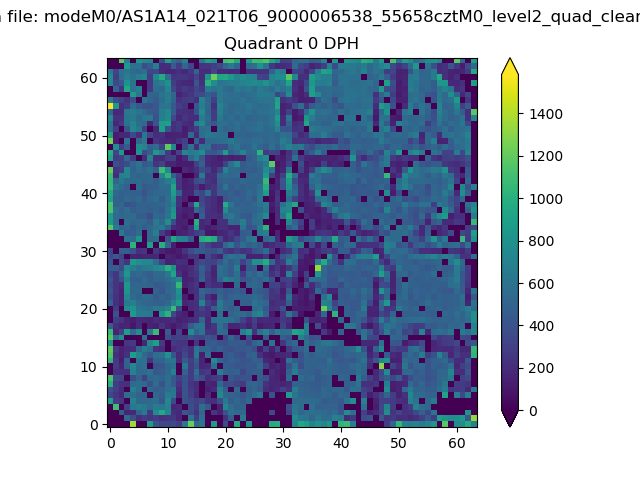 |
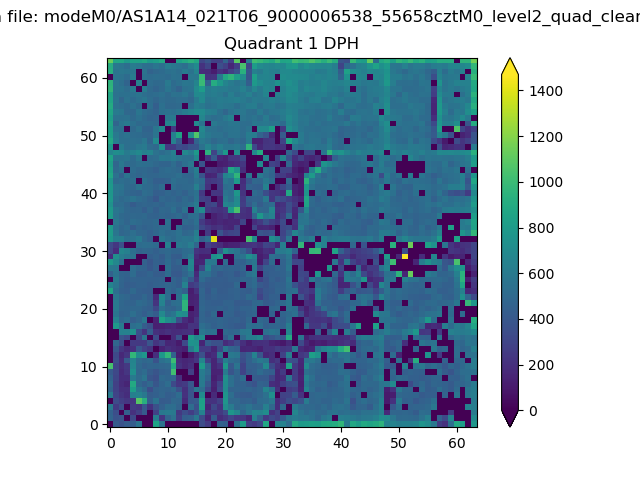 |
Quadrant B |
|---|---|---|---|
| Quadrant D | 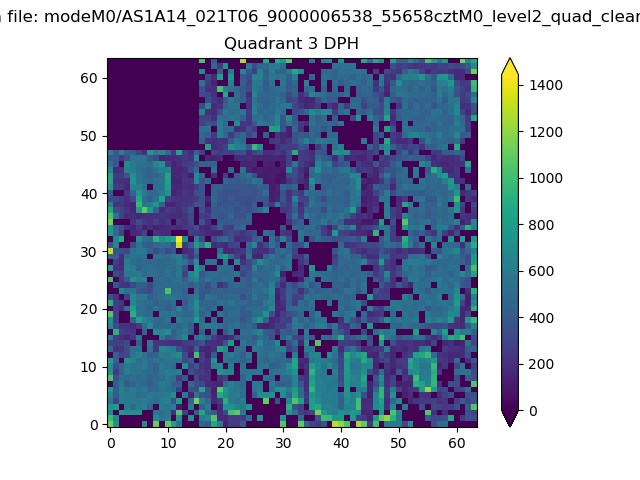 |
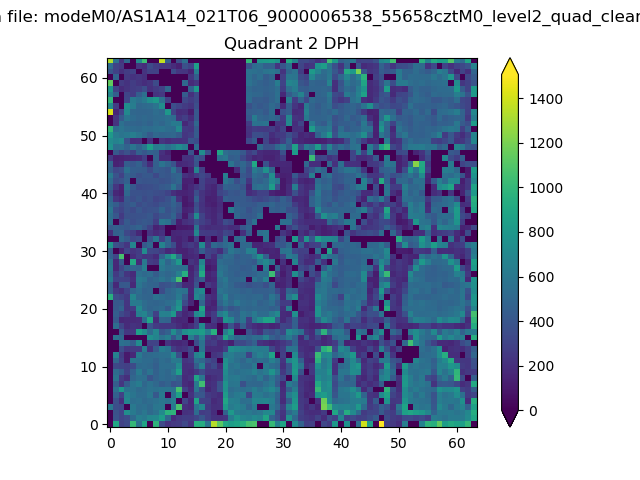 |
Quadrant C |
| Plot type | Count rate plots | Images |
|---|---|---|
| Comparison with Poisson distribution Blue bars denote a histogram of data divided into 1 sec bins. Red curve is a Poisson curve with rate = median count rate of data. |
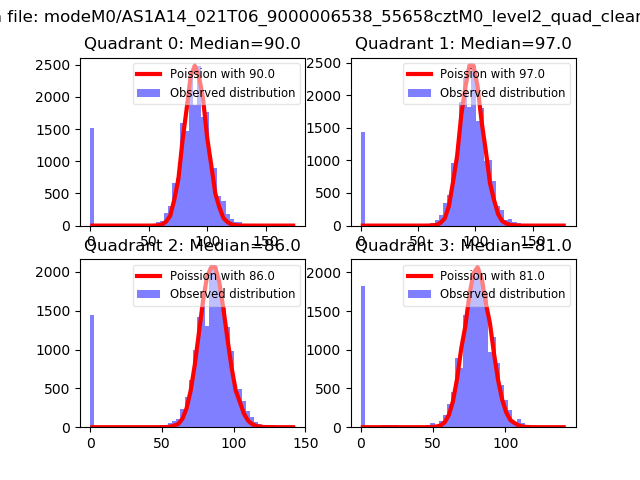 |
 |
| Quadrant-wise count rates Data is divided into 100 sec bins |
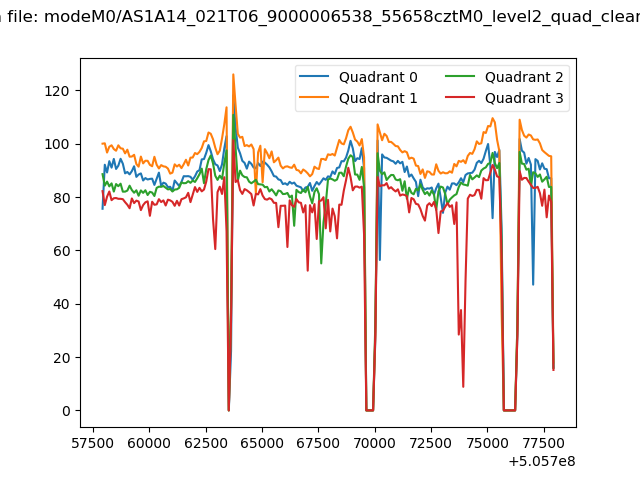 |
|
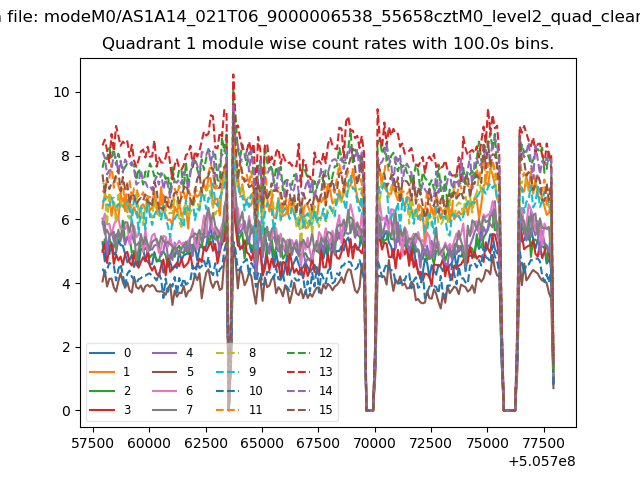
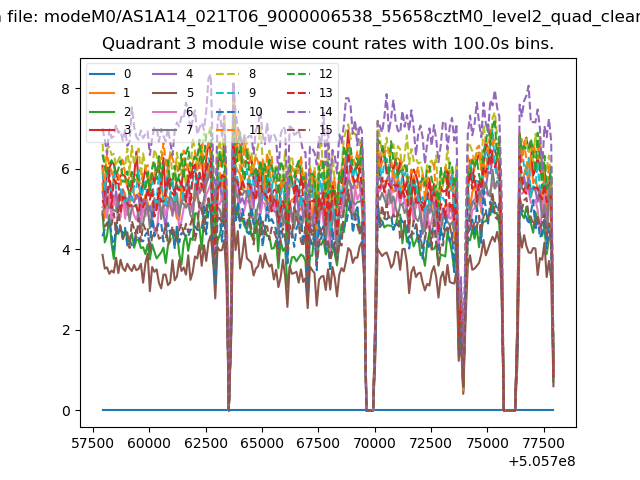
| Module-wise count rates for Quadrant A Data is divided into 100 sec bins |
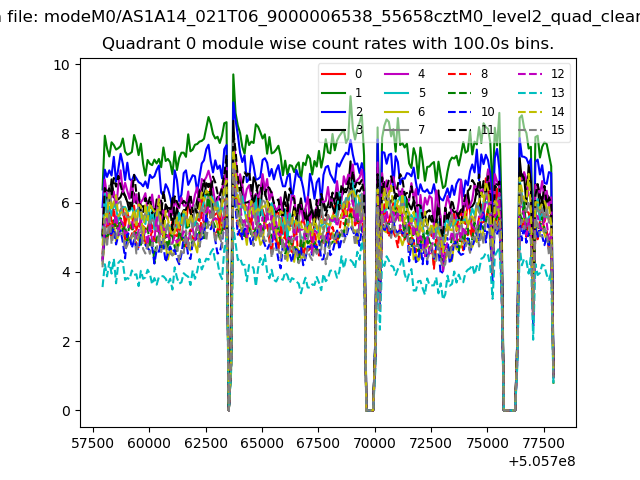 |
 |
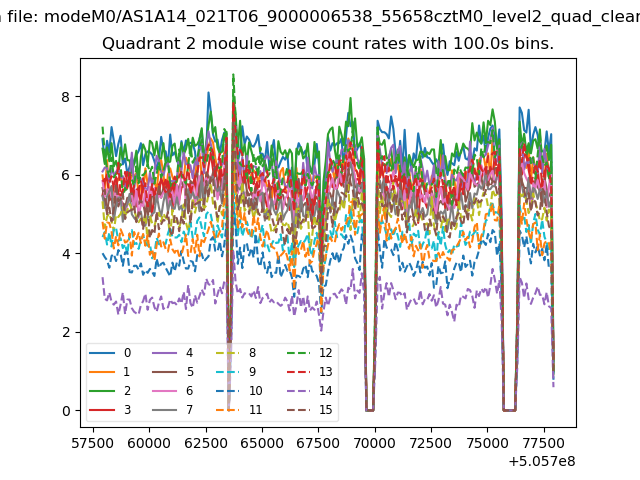
| Module-wise count rates for Quadrant B Data is divided into 100 sec bins |
 |
 |
| Module-wise count rates for Quadrant C Data is divided into 100 sec bins |
 |
 |
| Module-wise count rates for Quadrant D Data is divided into 100 sec bins |
 |
 |
| Parameter | Plot |
|---|---|
| CZT HV Monitor | 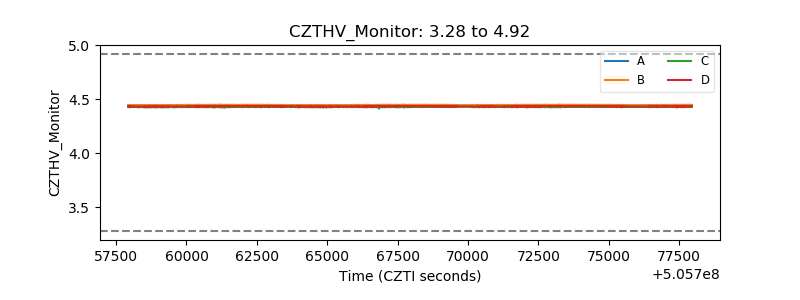 |
| D_VDD | 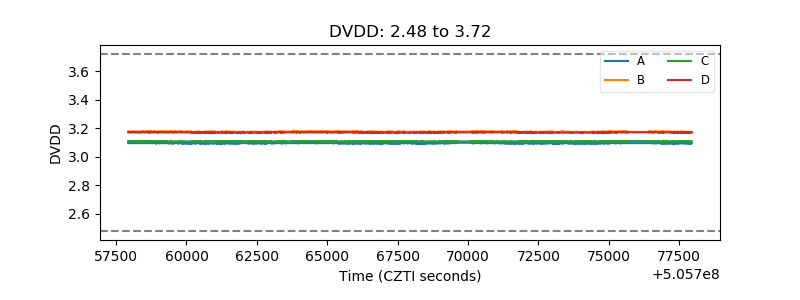 |
| Temperature 1 | 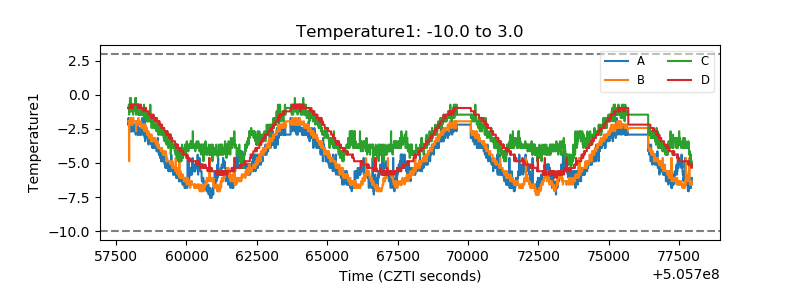 |
| Veto HV Monitor | 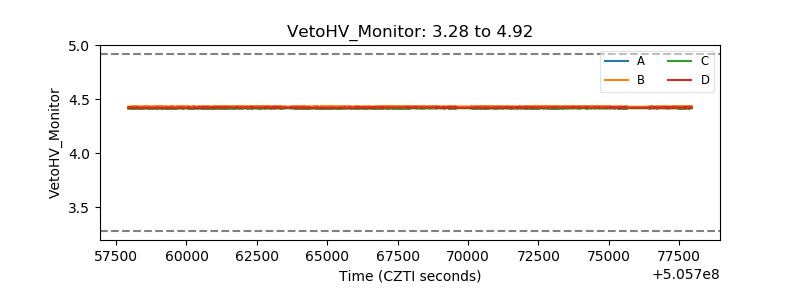 |
| Veto LLD | 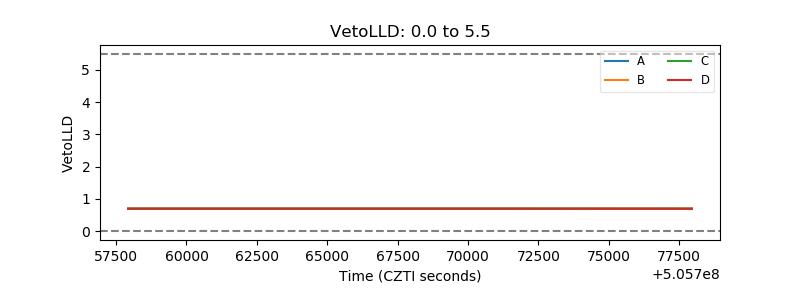 |
| Alpha Counter | 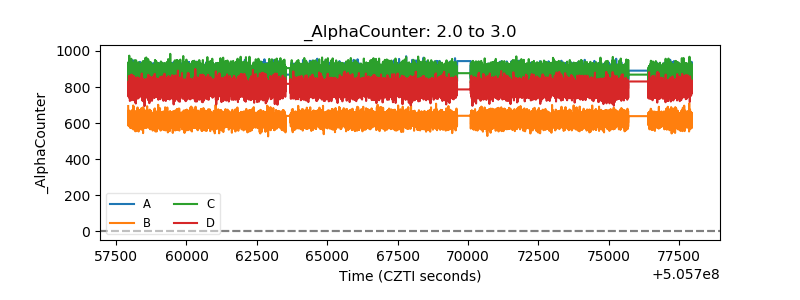 |
| _CPM_Rate | 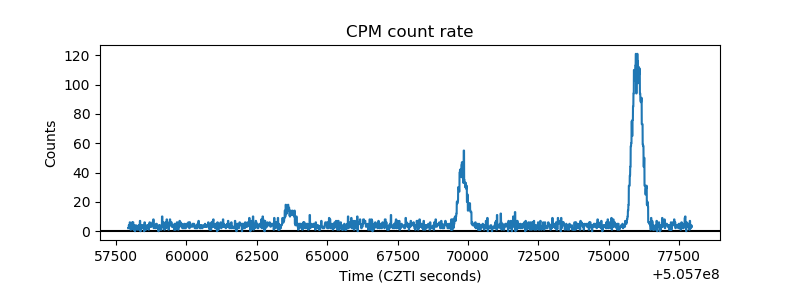 |
| CZT Counter | 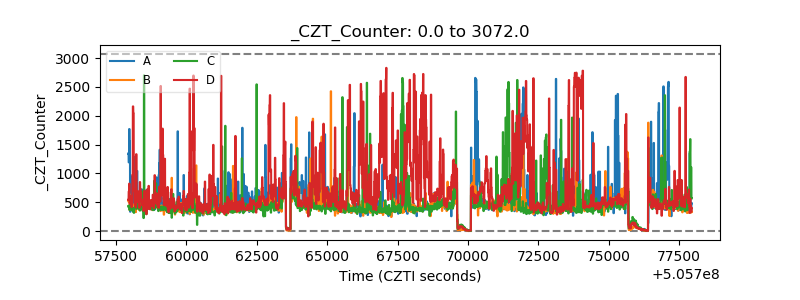 |
| +2.5 Volts monitor | 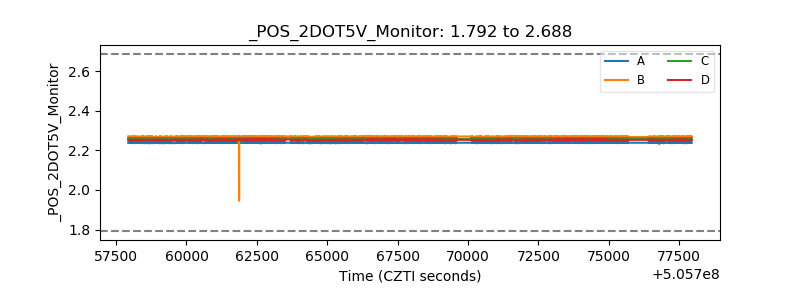 |
| +5 Volts monitor | 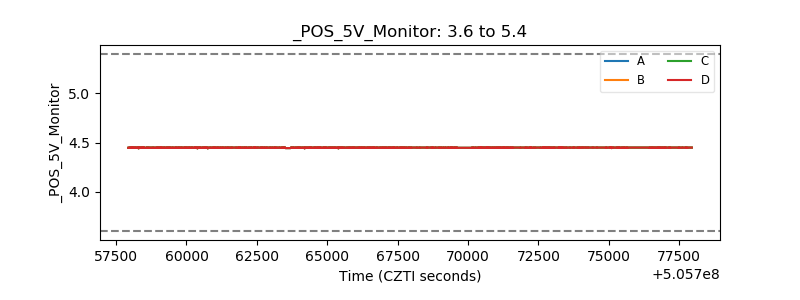 |
| _ROLL_ROT | 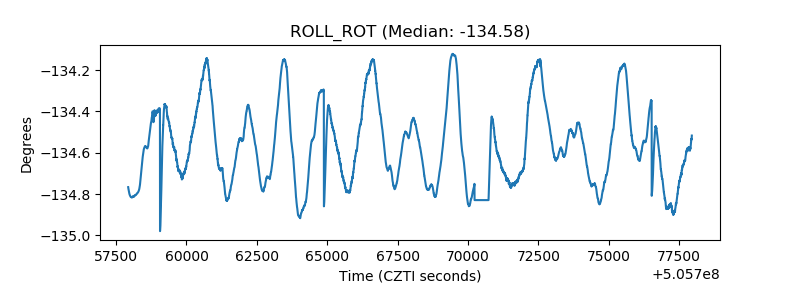 |
| _Roll_DEC | 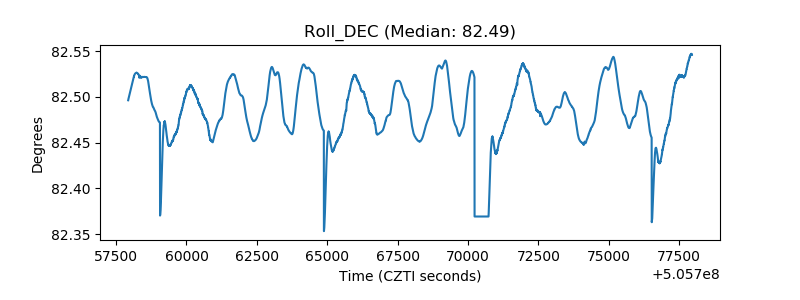 |
| _Roll_RA | 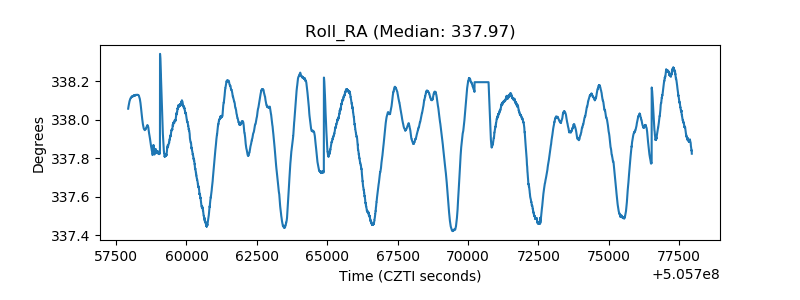 |
| Veto Counter | 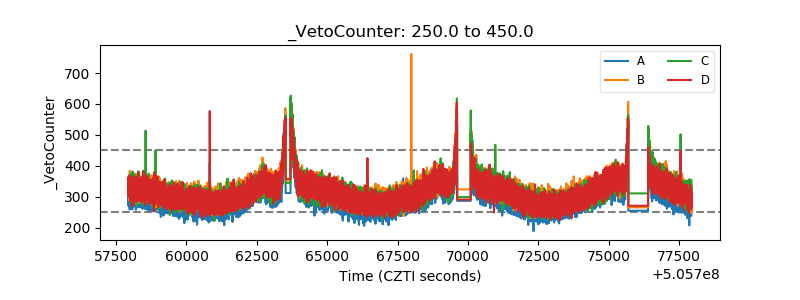 |