| Param | Original file | Final file |
|---|---|---|
| Filename | modeM0/AS1A14_021T06_9000006538_55659cztM0_level2.fits | modeM0/AS1A14_021T06_9000006538_55659cztM0_level2_quad_clean.evt |
| Size (bytes) | 457,447,680 | 105,572,160 |
| Size | 436.3 MB | 100.7 MB |
| Events in quadrant A | 4,710,114 | 699,111 |
| Events in quadrant B | 3,100,221 | 741,306 |
| Events in quadrant C | 3,402,182 | 652,038 |
| Events in quadrant D | 5,175,383 | 615,638 |
| Mode M9 | |||
|---|---|---|---|
| Quadrant | BADHDUFLAG | Total packets | Discarded packets |
| A | 0 | 13 | 0 |
| B | 0 | 14 | 0 |
| C | 0 | 14 | 0 |
| D | 0 | 14 | 0 |
| Mode M0 | |||
|---|---|---|---|
| Quadrant | BADHDUFLAG | Total packets | Discarded packets |
| A | 0 | 19197 | 2 |
| B | 0 | 14769 | 2 |
| C | 0 | 15489 | 2 |
| D | 0 | 20392 | 2 |
| Mode SS | |||
|---|---|---|---|
| Quadrant | BADHDUFLAG | Total packets | Discarded packets |
| A | 0 | 142 | 0 |
| B | 0 | 142 | 0 |
| C | 0 | 142 | 0 |
| D | 0 | 142 | 0 |
| Quadrant | Total seconds | Saturated seconds | Saturation percentage |
|---|---|---|---|
| A | 7016 | 273 | 3.891106% |
| B | 7016 | 25 | 0.356328% |
| C | 7016 | 81 | 1.154504% |
| D | 7016 | 441 | 6.285633% |
Noise dominated data is calculated using 1-second bins in cleaned event files. If a bin has >2000 counts, and if more than 50% of those come from <1% of pixels, then it is considered to be noise-dominated and hence unusable.
| Quadrant | # 1 sec bins | Bins with >0 counts | Bins with >2000 counts | High rate bins dominated by noise | Noise dominated (total time) | Noise dominated (detector-on time) | Marked lightcurve |
|---|---|---|---|---|---|---|---|
| A | 7851 | 7017 | 206 | 206 | 2.62% | 2.94% | 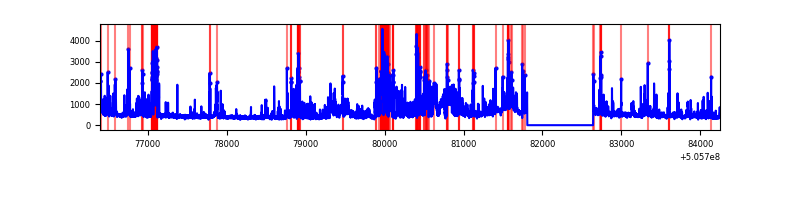 |
| B | 7851 | 7017 | 4 | 4 | 0.05% | 0.06% | 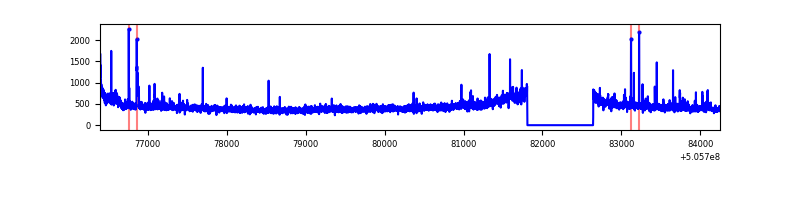 |
| C | 7851 | 7017 | 47 | 47 | 0.60% | 0.67% | 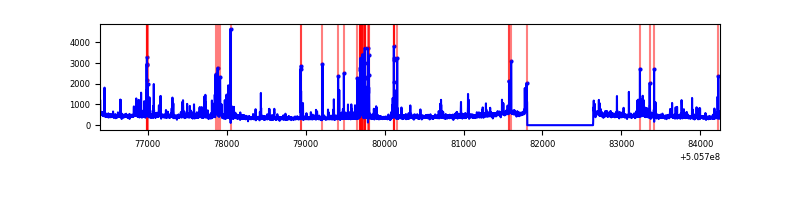 |
| D | 7851 | 7017 | 511 | 511 | 6.51% | 7.28% | 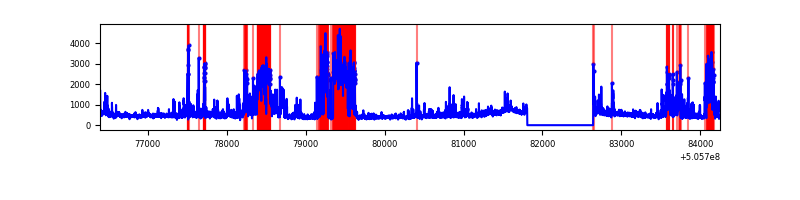 |
Top three noisy pixels from each quadrant. If the there are fewer than three noisy pixels in the level2.evt file, extra rows are filled as -1
| Pixel properties | Quadrant properties | ||||||
|---|---|---|---|---|---|---|---|
| Quadrant | DetID | PixID | Counts | Sigma | Mean | Median | Sigma |
| A | 0 | 8 | 525247 | 2821.78 | 733 | 713 | 185.9 |
| A | 8 | 6 | 405658 | 2178.44 | 733 | 713 | 185.9 |
| A | 3 | 14 | 392627 | 2108.33 | 733 | 713 | 185.9 |
| B | 5 | 172 | 121036 | 761.22 | 730 | 705 | 158.1 |
| B | 0 | 171 | 23154 | 142.01 | 730 | 705 | 158.1 |
| B | 5 | 248 | 21226 | 129.82 | 730 | 705 | 158.1 |
| C | 12 | 250 | 159880 | 805.68 | 718 | 711 | 197.6 |
| C | 13 | 3 | 149730 | 754.3 | 718 | 711 | 197.6 |
| C | 15 | 148 | 112509 | 565.9 | 718 | 711 | 197.6 |
| D | 8 | 245 | 1574915 | 7721.89 | 713 | 680 | 203.9 |
| D | 11 | 129 | 284650 | 1392.92 | 713 | 680 | 203.9 |
| D | 7 | 70 | 149524 | 730.11 | 713 | 680 | 203.9 |
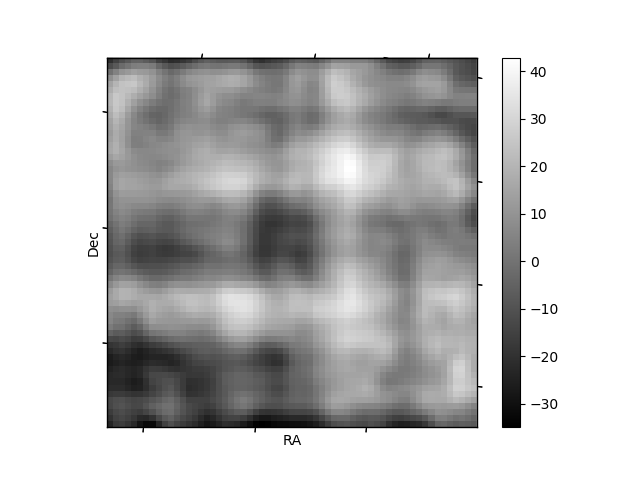
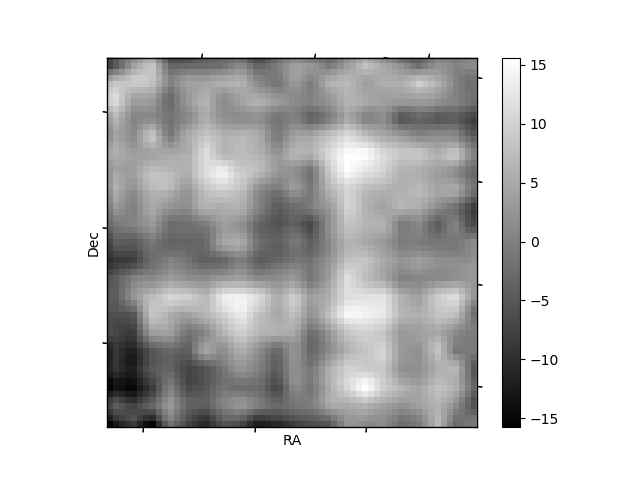
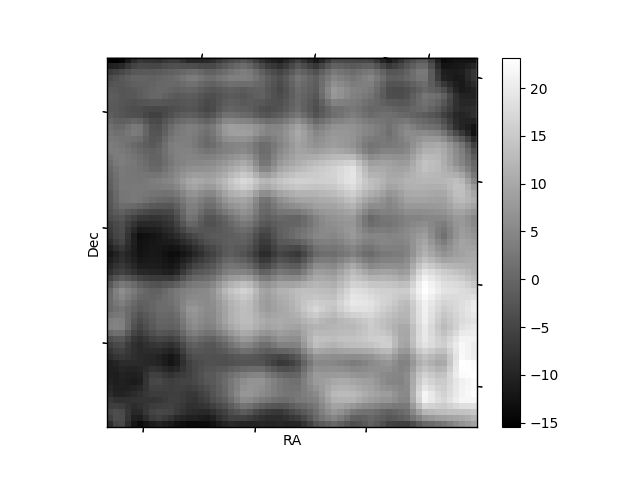
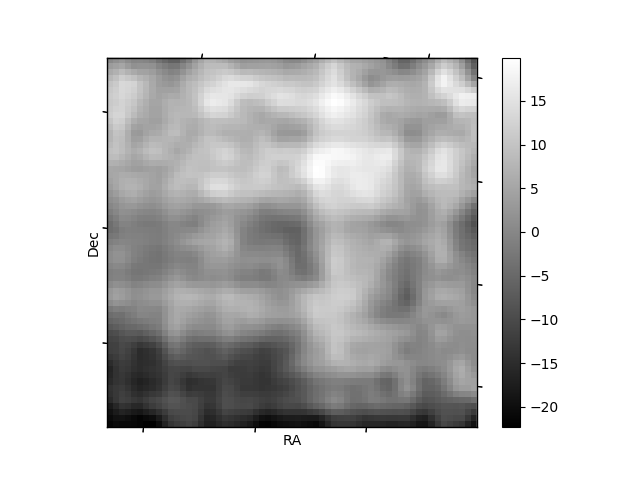
Histogram calculated using DETX and DETY for each event in the final _common_clean file
| Quadrant A | 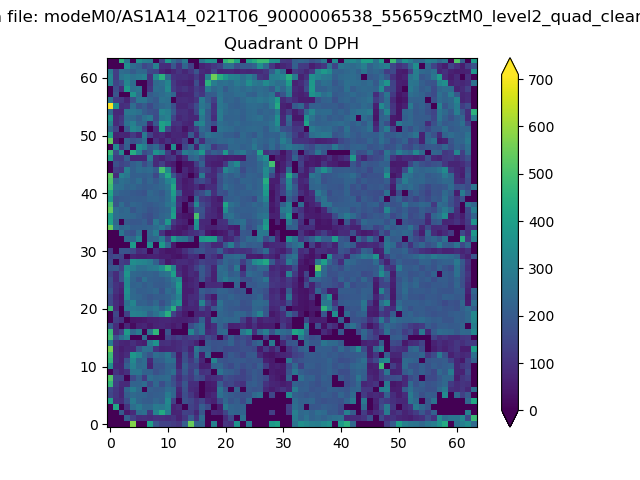 |
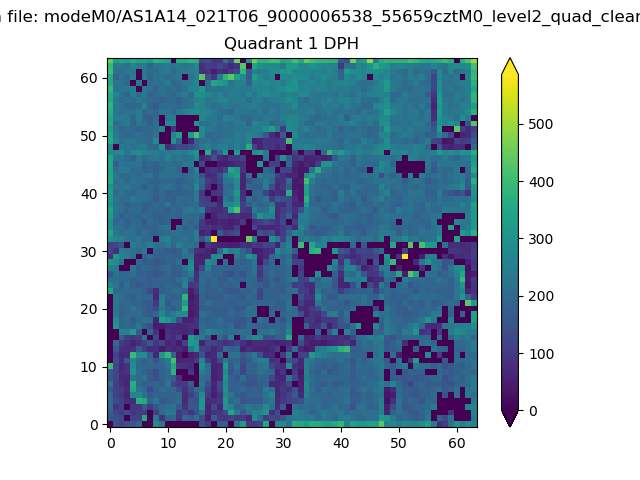 |
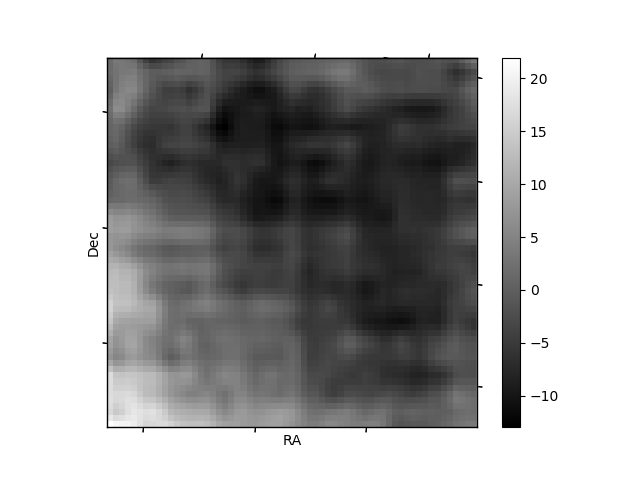
Quadrant B |
|---|---|---|---|
| Quadrant D | 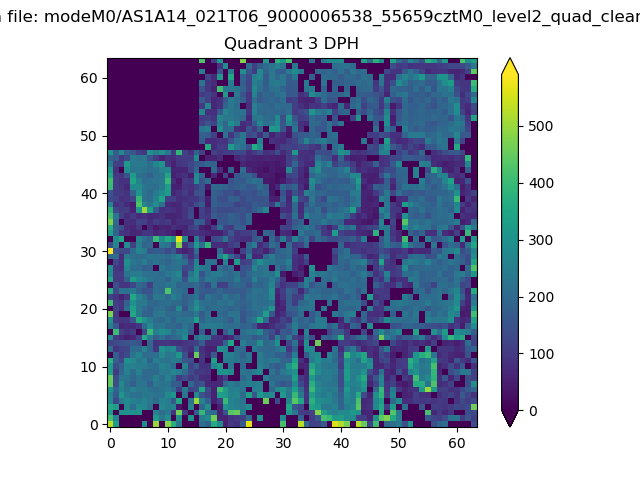 |
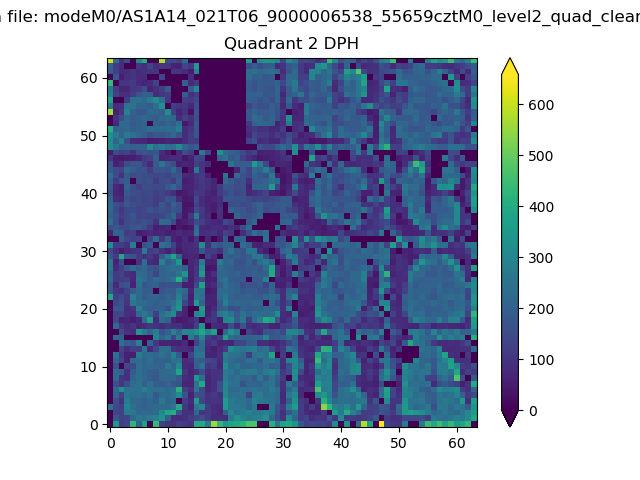 |
Quadrant C |
| Plot type | Count rate plots | Images |
|---|---|---|
| Comparison with Poisson distribution Blue bars denote a histogram of data divided into 1 sec bins. Red curve is a Poisson curve with rate = median count rate of data. |
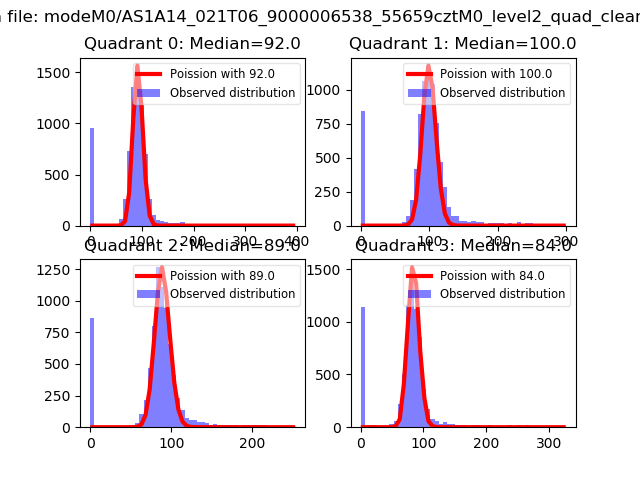 |
 |
| Quadrant-wise count rates Data is divided into 100 sec bins |
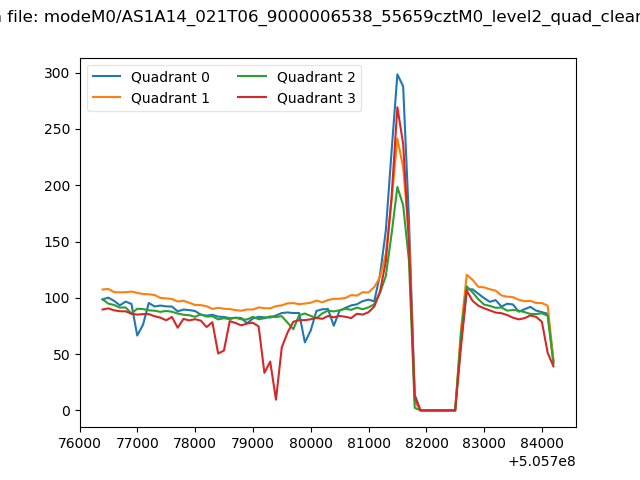 |
|
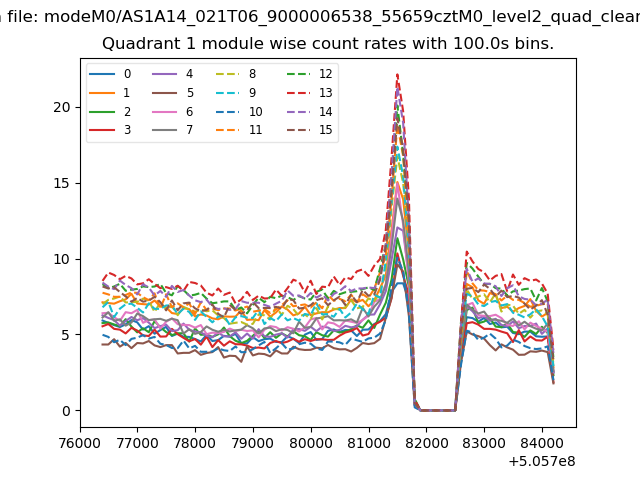
| Module-wise count rates for Quadrant A Data is divided into 100 sec bins |
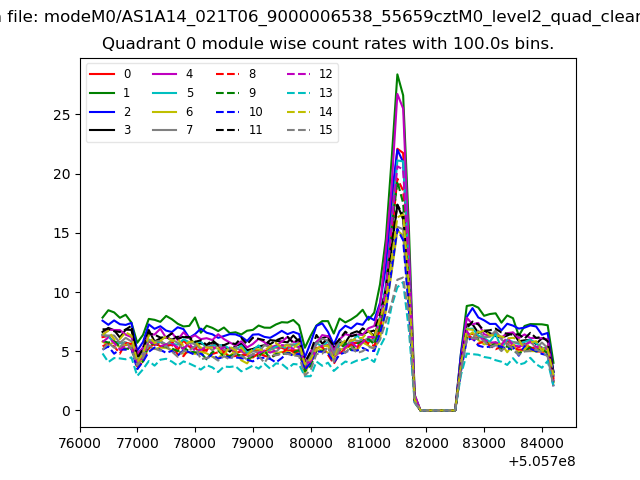 |
 |
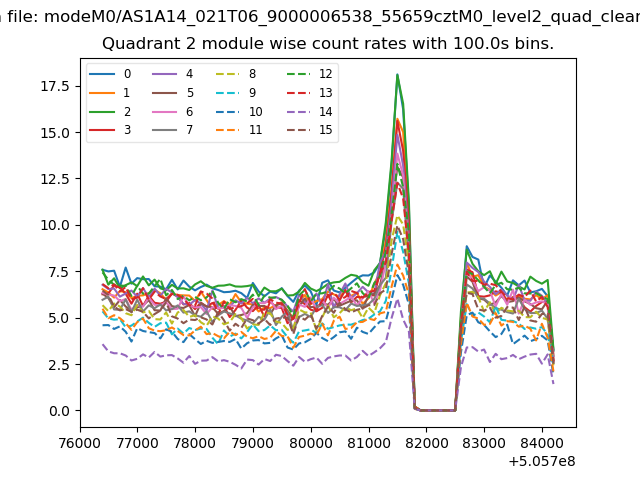
| Module-wise count rates for Quadrant B Data is divided into 100 sec bins |
 |
 |
| Module-wise count rates for Quadrant C Data is divided into 100 sec bins |
 |
 |
| Module-wise count rates for Quadrant D Data is divided into 100 sec bins |
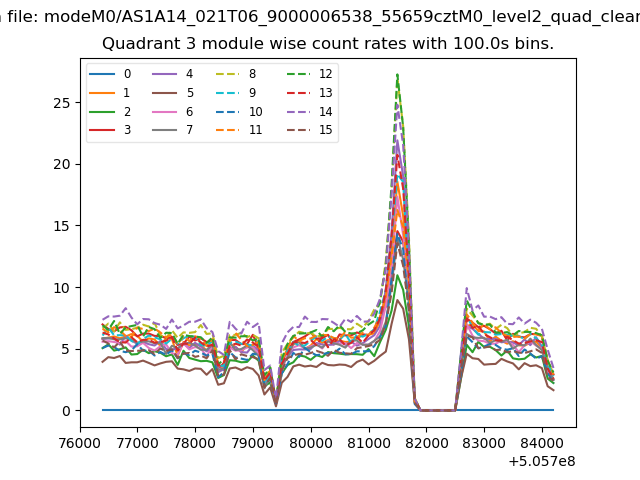 |
 |
| Parameter | Plot |
|---|---|
| CZT HV Monitor | 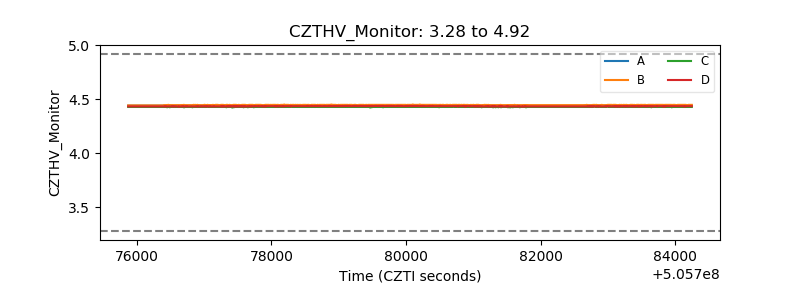 |
| D_VDD | 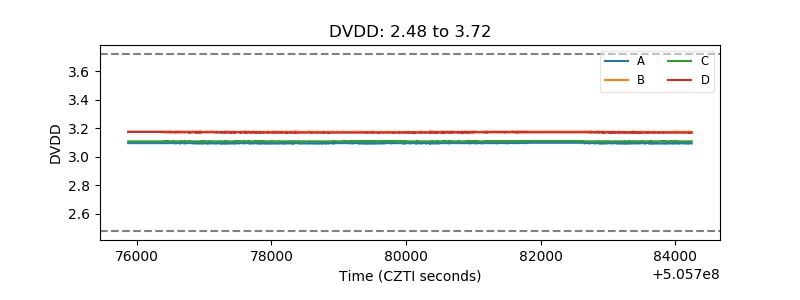 |
| Temperature 1 | 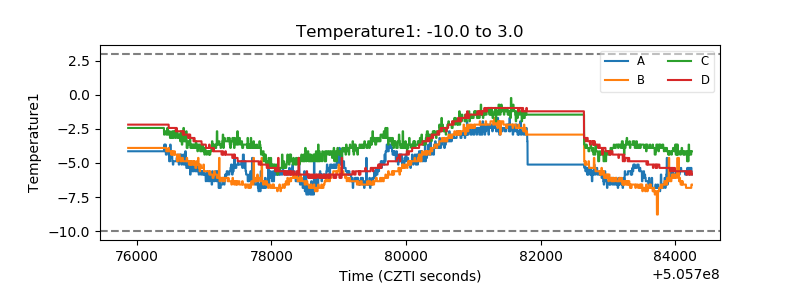 |
| Veto HV Monitor | 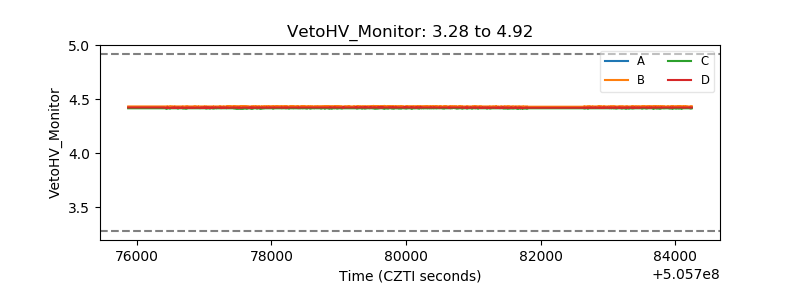 |
| Veto LLD | 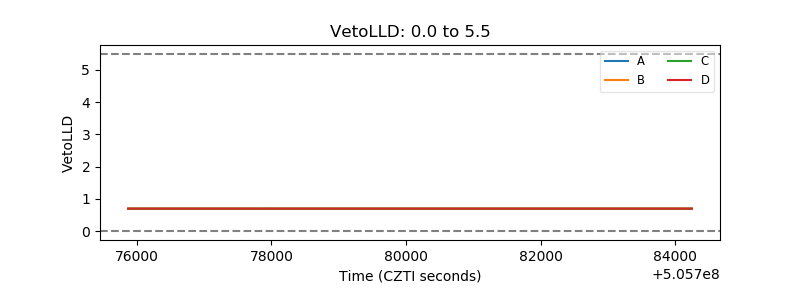 |
| Alpha Counter | 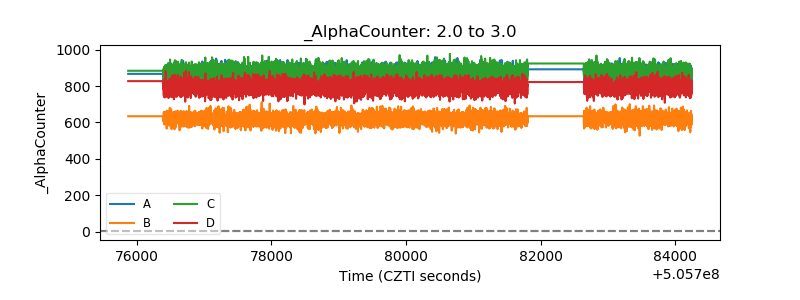 |
| _CPM_Rate | 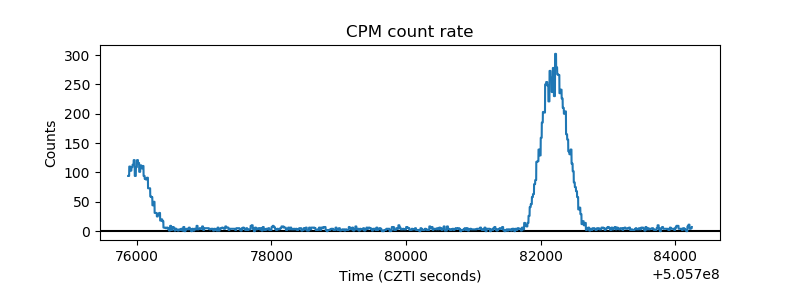 |
| CZT Counter | 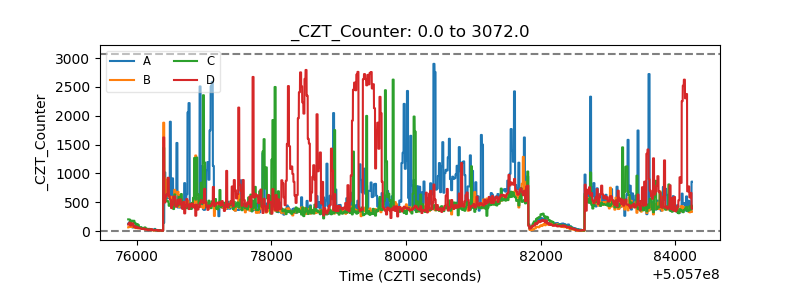 |
| +2.5 Volts monitor |  |
| +5 Volts monitor |  |
| _ROLL_ROT | 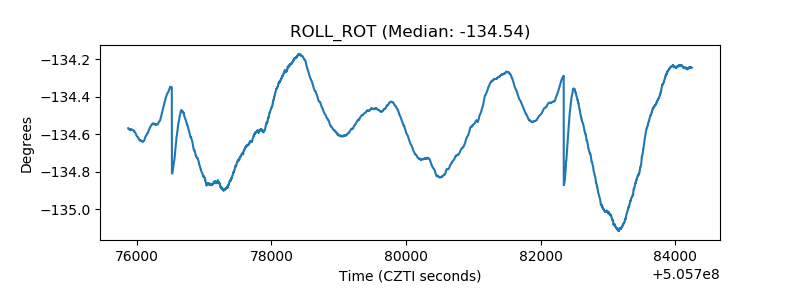 |
| _Roll_DEC | 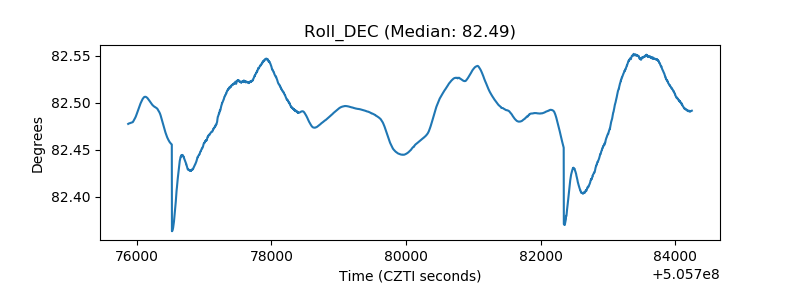 |
| _Roll_RA | 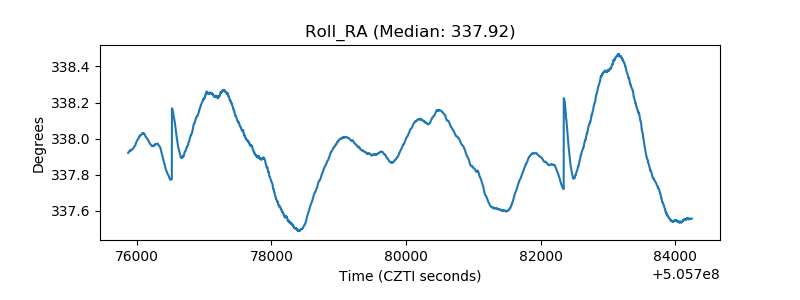 |
| Veto Counter | 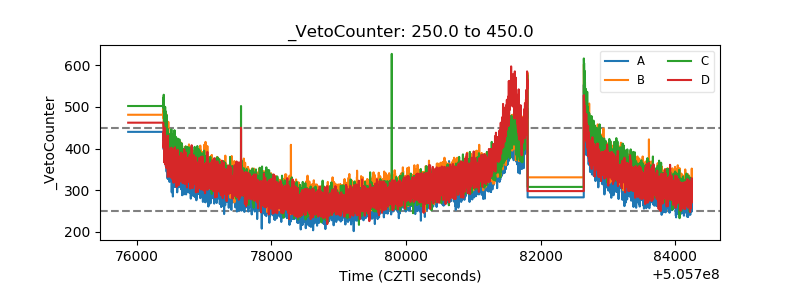 |