| Param | Original file | Final file |
|---|---|---|
| Filename | modeM0/AS1A14_021T06_9000006538_55662cztM0_level2.fits | modeM0/AS1A14_021T06_9000006538_55662cztM0_level2_quad_clean.evt |
| Size (bytes) | 410,806,080 | 104,734,080 |
| Size | 391.8 MB | 99.9 MB |
| Events in quadrant A | 4,483,308 | 650,965 |
| Events in quadrant B | 2,963,307 | 735,005 |
| Events in quadrant C | 3,480,636 | 673,127 |
| Events in quadrant D | 3,760,085 | 647,535 |
| Mode M9 | |||
|---|---|---|---|
| Quadrant | BADHDUFLAG | Total packets | Discarded packets |
| A | 0 | 12 | 0 |
| B | 0 | 13 | 0 |
| C | 0 | 13 | 0 |
| D | 0 | 13 | 0 |
| Mode M0 | |||
|---|---|---|---|
| Quadrant | BADHDUFLAG | Total packets | Discarded packets |
| A | 0 | 18233 | 2 |
| B | 0 | 14047 | 2 |
| C | 0 | 15511 | 2 |
| D | 0 | 16268 | 2 |
| Mode SS | |||
|---|---|---|---|
| Quadrant | BADHDUFLAG | Total packets | Discarded packets |
| A | 0 | 134 | 0 |
| B | 0 | 134 | 0 |
| C | 0 | 134 | 0 |
| D | 0 | 134 | 0 |
| Quadrant | Total seconds | Saturated seconds | Saturation percentage |
|---|---|---|---|
| A | 6675 | 393 | 5.887640% |
| B | 6675 | 37 | 0.554307% |
| C | 6675 | 100 | 1.498127% |
| D | 6675 | 67 | 1.003745% |
Noise dominated data is calculated using 1-second bins in cleaned event files. If a bin has >2000 counts, and if more than 50% of those come from <1% of pixels, then it is considered to be noise-dominated and hence unusable.
| Quadrant | # 1 sec bins | Bins with >0 counts | Bins with >2000 counts | High rate bins dominated by noise | Noise dominated (total time) | Noise dominated (detector-on time) | Marked lightcurve |
|---|---|---|---|---|---|---|---|
| A | 7755 | 6676 | 352 | 352 | 4.54% | 5.27% | 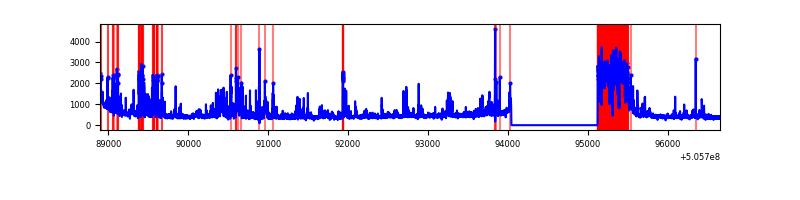 |
| B | 7755 | 6676 | 14 | 14 | 0.18% | 0.21% | 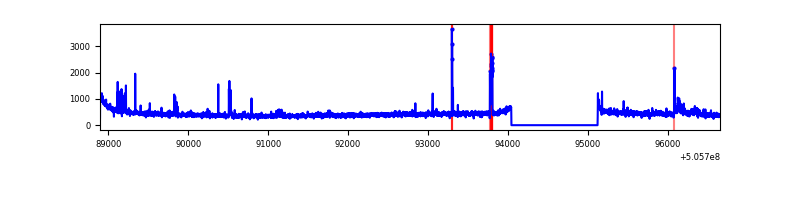 |
| C | 7755 | 6676 | 86 | 86 | 1.11% | 1.29% | 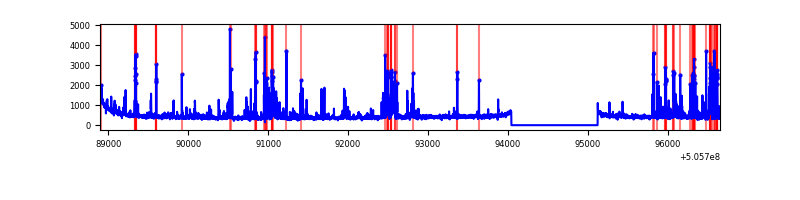 |
| D | 7755 | 6676 | 66 | 66 | 0.85% | 0.99% | 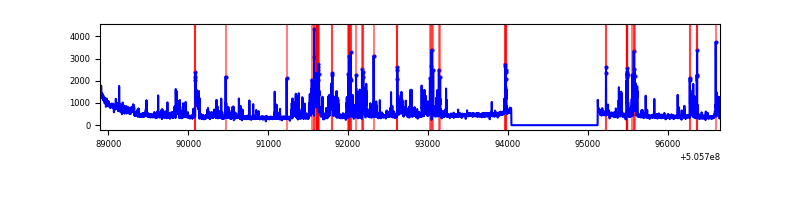 |
Top three noisy pixels from each quadrant. If the there are fewer than three noisy pixels in the level2.evt file, extra rows are filled as -1
| Pixel properties | Quadrant properties | ||||||
|---|---|---|---|---|---|---|---|
| Quadrant | DetID | PixID | Counts | Sigma | Mean | Median | Sigma |
| A | 12 | 115 | 811153 | 4627.05 | 686 | 668 | 175.2 |
| A | 0 | 8 | 412350 | 2350.29 | 686 | 668 | 175.2 |
| A | 15 | 32 | 306697 | 1747.11 | 686 | 668 | 175.2 |
| B | 5 | 172 | 68826 | 456.46 | 696 | 672 | 149.3 |
| B | 7 | 252 | 48379 | 319.52 | 696 | 672 | 149.3 |
| B | 9 | 251 | 47957 | 316.69 | 696 | 672 | 149.3 |
| C | 13 | 3 | 437841 | 2231.7 | 691 | 683 | 195.9 |
| C | 10 | 19 | 110559 | 560.92 | 691 | 683 | 195.9 |
| C | 12 | 252 | 81461 | 412.37 | 691 | 683 | 195.9 |
| D | 8 | 245 | 726218 | 3619.41 | 689 | 658 | 200.5 |
| D | 3 | 12 | 117808 | 584.4 | 689 | 658 | 200.5 |
| D | 2 | 252 | 87834 | 434.87 | 689 | 658 | 200.5 |
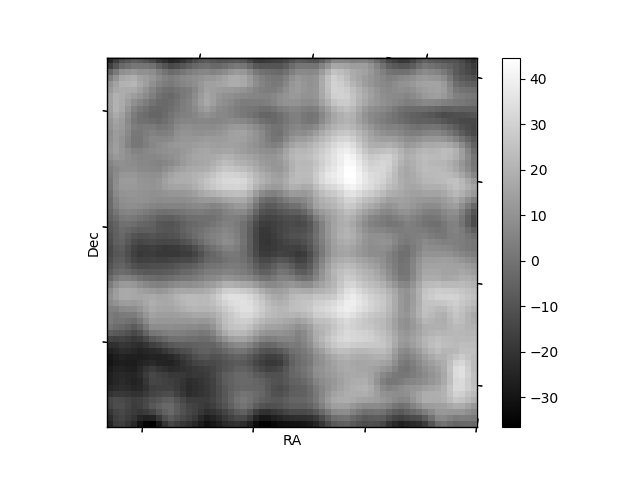
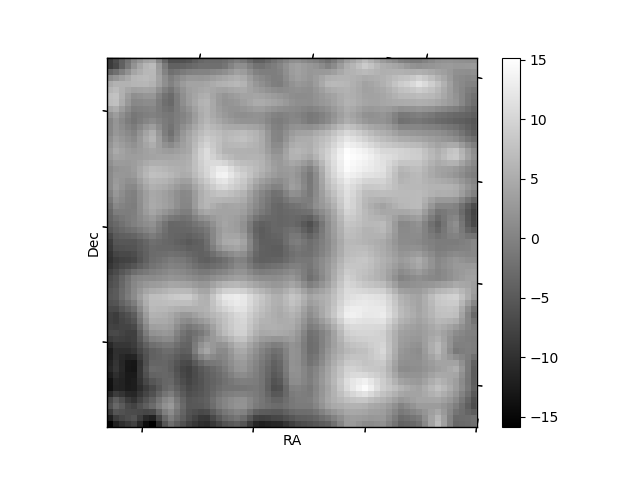
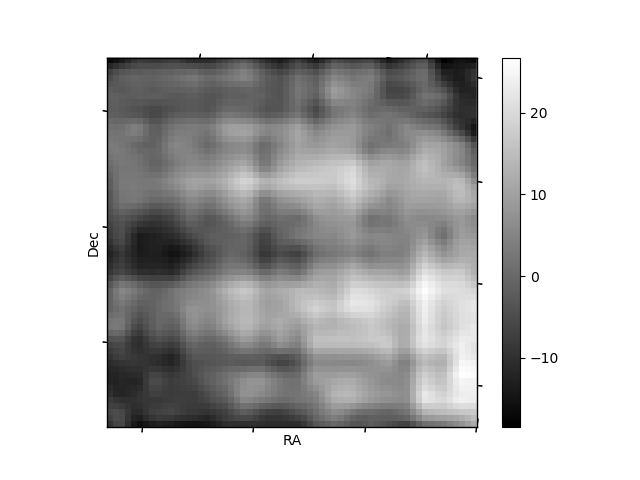
Histogram calculated using DETX and DETY for each event in the final _common_clean file
| Quadrant A | 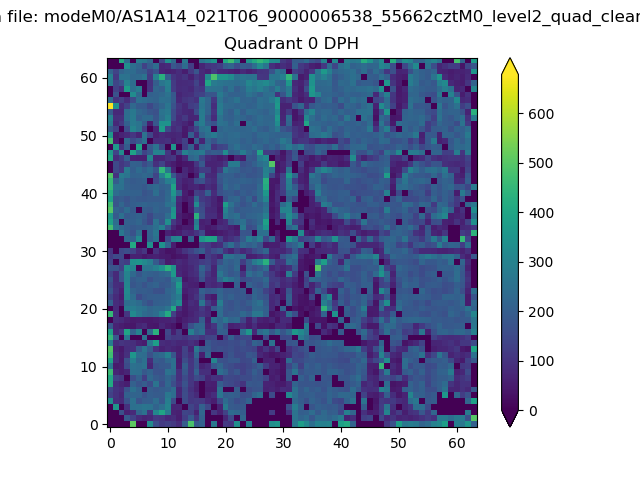 |
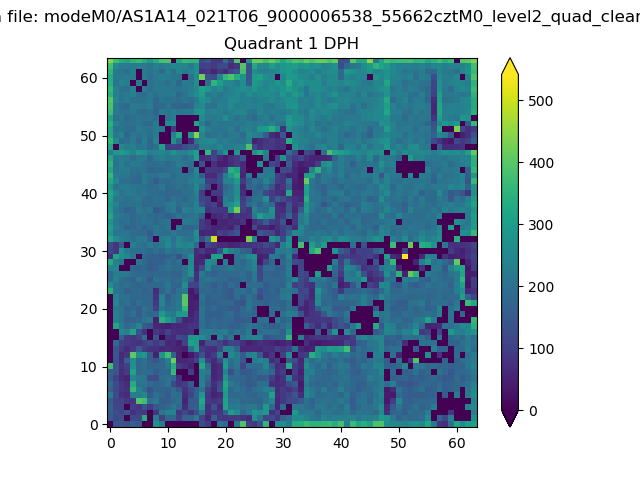 |
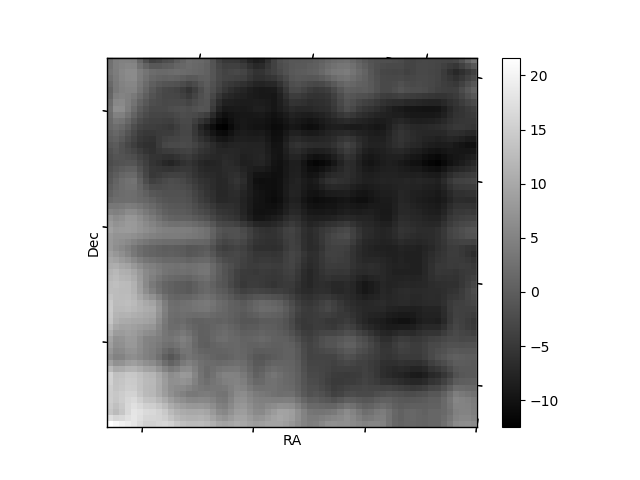
Quadrant B |
|---|---|---|---|
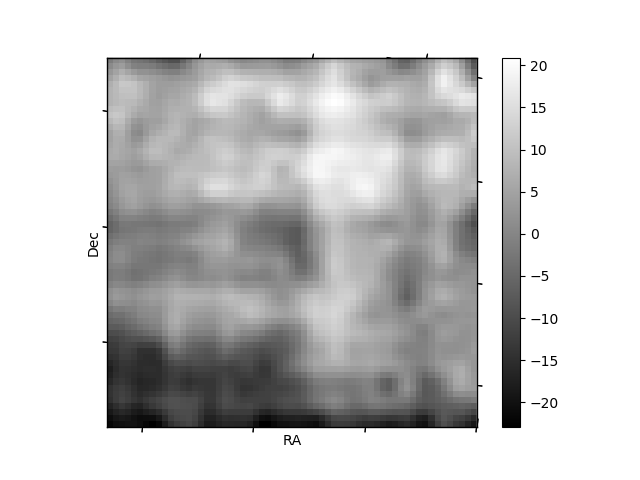
| Quadrant D | 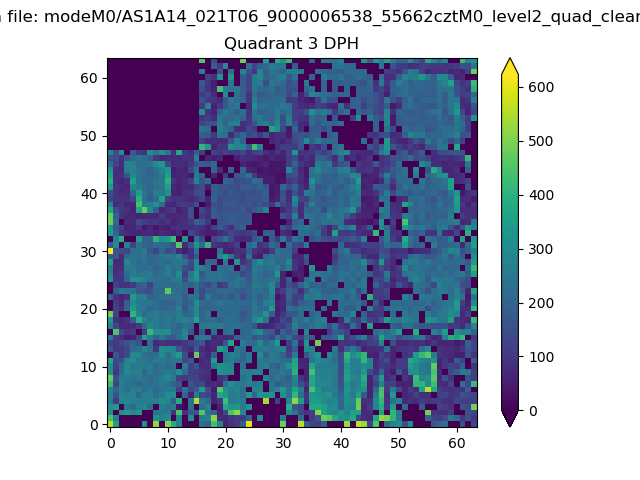 |
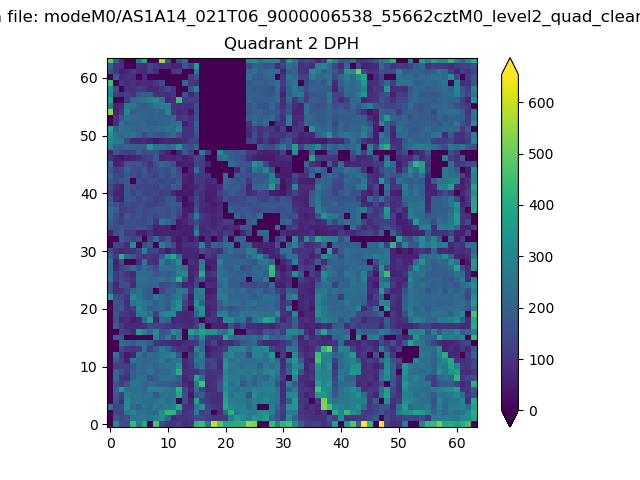 |
Quadrant C |
| Plot type | Count rate plots | Images |
|---|---|---|
| Comparison with Poisson distribution Blue bars denote a histogram of data divided into 1 sec bins. Red curve is a Poisson curve with rate = median count rate of data. |
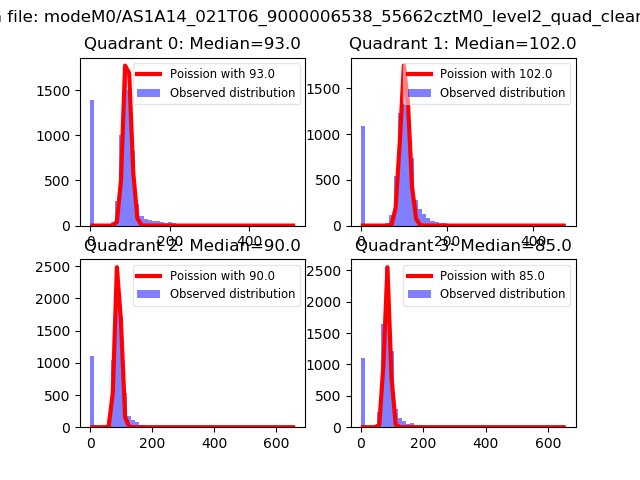 |
 |
| Quadrant-wise count rates Data is divided into 100 sec bins |
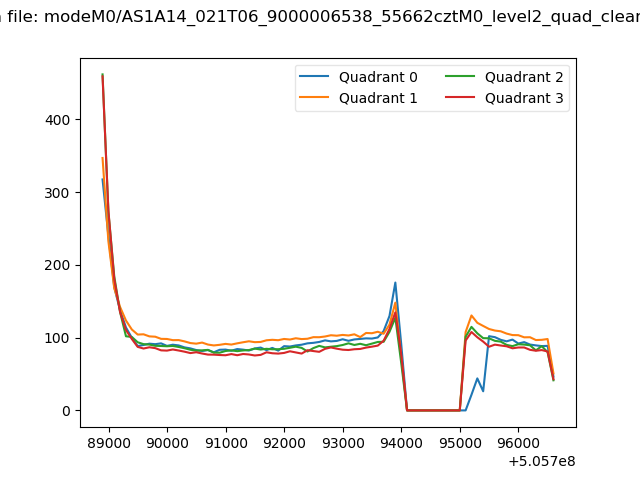 |
|
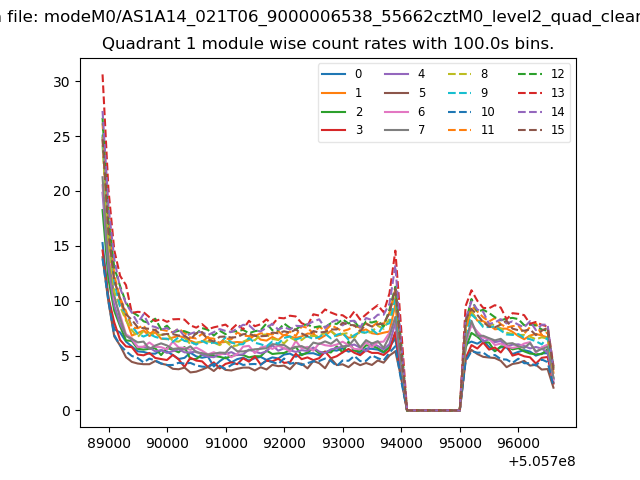
| Module-wise count rates for Quadrant A Data is divided into 100 sec bins |
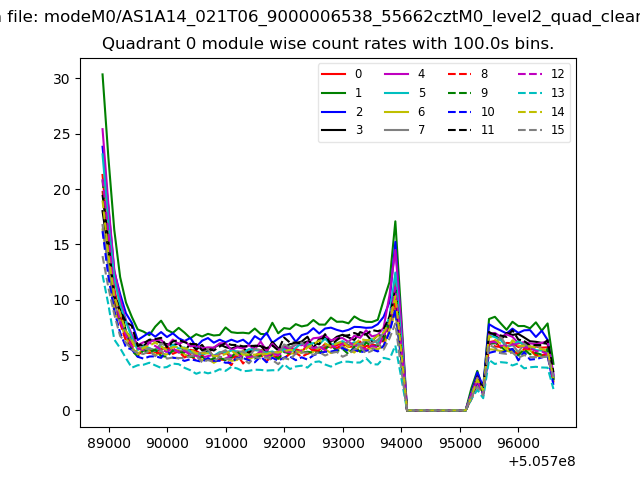 |
 |
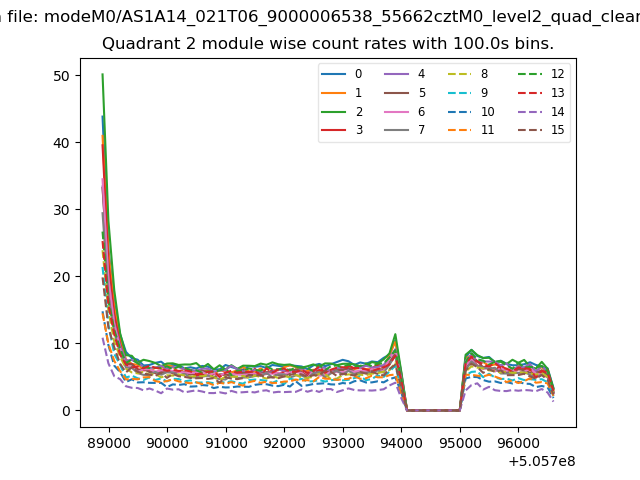
| Module-wise count rates for Quadrant B Data is divided into 100 sec bins |
 |
 |
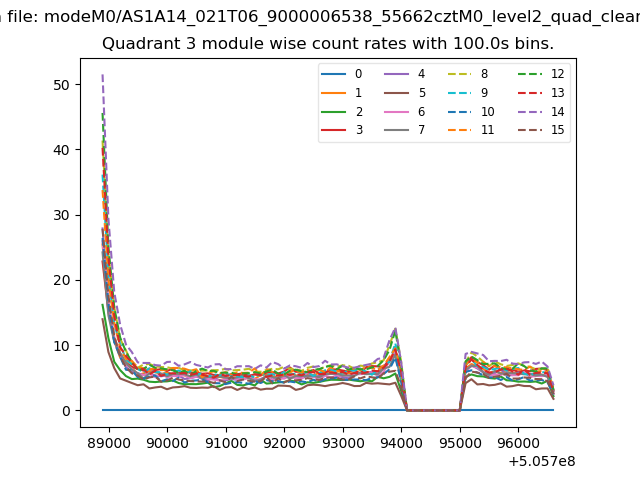
| Module-wise count rates for Quadrant C Data is divided into 100 sec bins |
 |
 |
| Module-wise count rates for Quadrant D Data is divided into 100 sec bins |
 |
 |
| Parameter | Plot |
|---|---|
| CZT HV Monitor | 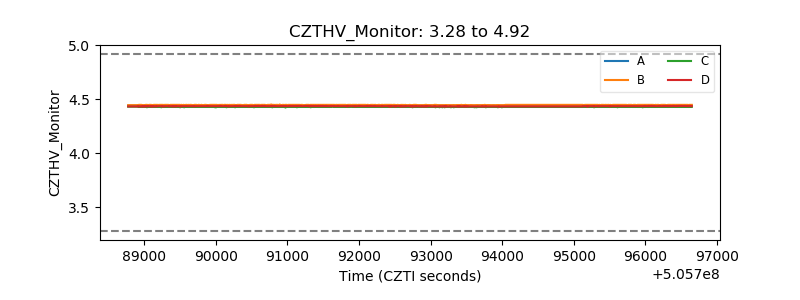 |
| D_VDD | 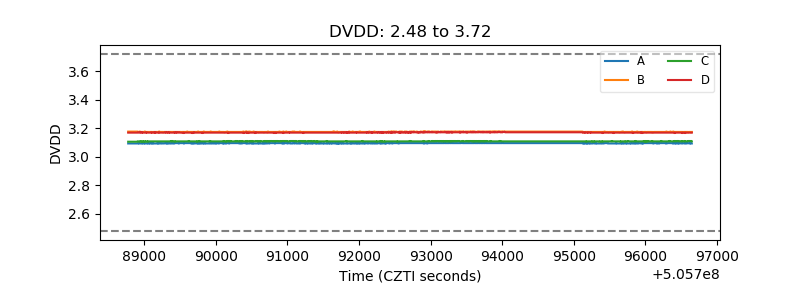 |
| Temperature 1 | 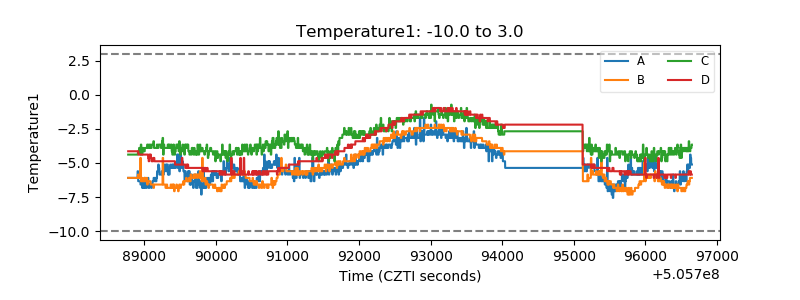 |
| Veto HV Monitor | 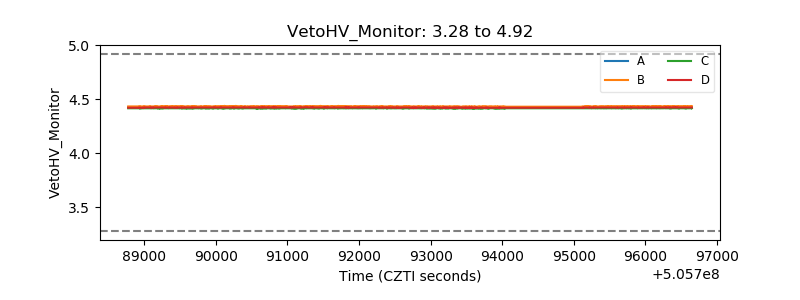 |
| Veto LLD | 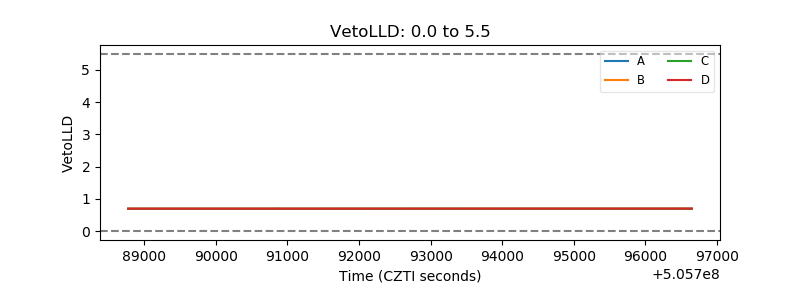 |
| Alpha Counter | 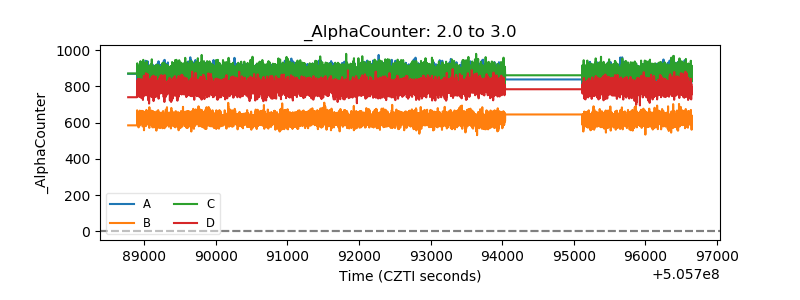 |
| _CPM_Rate | 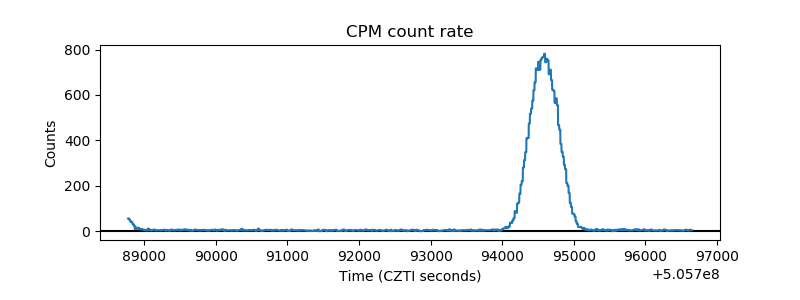 |
| CZT Counter | 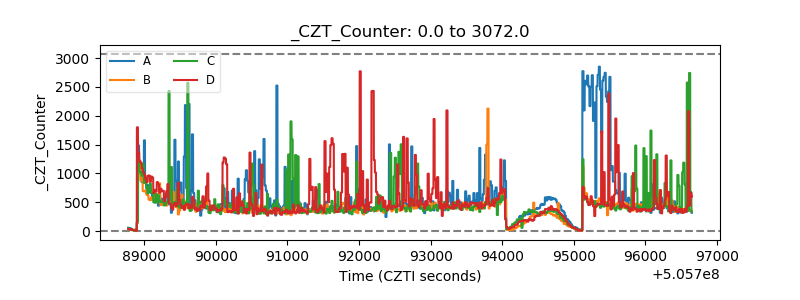 |
| +2.5 Volts monitor | 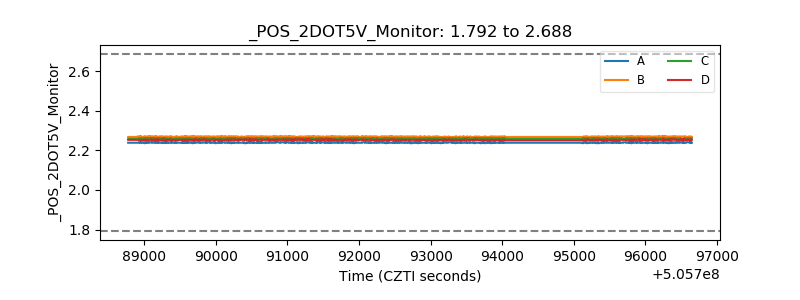 |
| +5 Volts monitor | 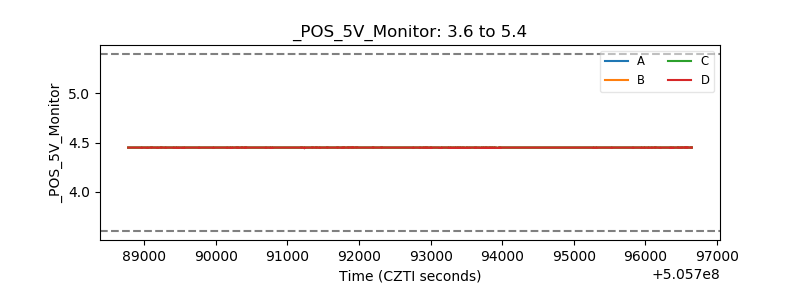 |
| _ROLL_ROT | 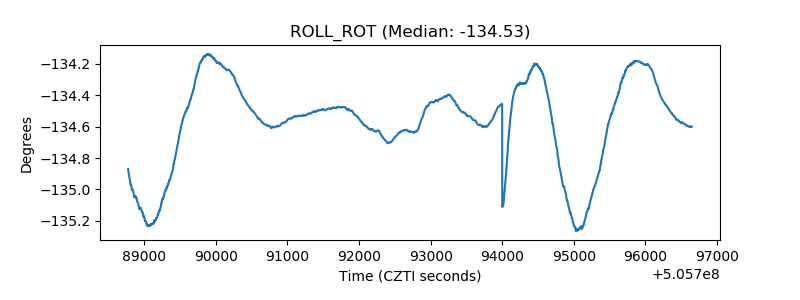 |
| _Roll_DEC | 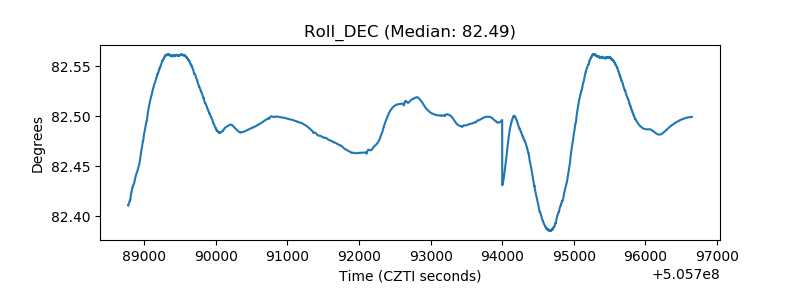 |
| _Roll_RA | 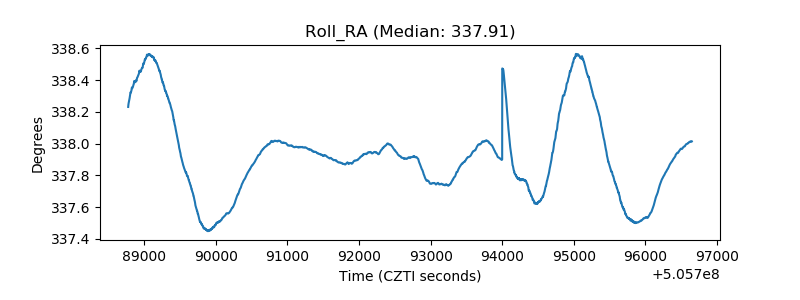 |
| Veto Counter | 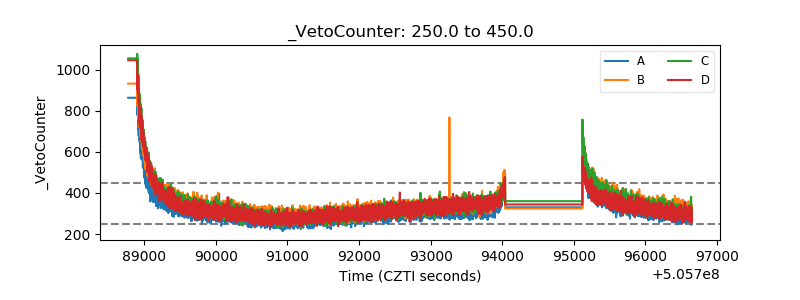 |