| Param | Original file | Final file |
|---|---|---|
| Filename | modeM0/AS1A14_021T06_9000006538_55667cztM0_level2.fits | modeM0/AS1A14_021T06_9000006538_55667cztM0_level2_quad_clean.evt |
| Size (bytes) | 449,000,640 | 101,793,600 |
| Size | 428.2 MB | 97.1 MB |
| Events in quadrant A | 5,672,381 | 622,156 |
| Events in quadrant B | 3,156,153 | 719,295 |
| Events in quadrant C | 3,423,642 | 633,601 |
| Events in quadrant D | 3,795,727 | 594,746 |
| Mode M9 | |||
|---|---|---|---|
| Quadrant | BADHDUFLAG | Total packets | Discarded packets |
| A | 0 | 4 | 0 |
| B | 0 | 4 | 0 |
| C | 0 | 4 | 0 |
| D | 0 | 4 | 0 |
| Mode M0 | |||
|---|---|---|---|
| Quadrant | BADHDUFLAG | Total packets | Discarded packets |
| A | 0 | 22061 | 2 |
| B | 0 | 15365 | 2 |
| C | 0 | 16144 | 2 |
| D | 0 | 16674 | 2 |
| Mode SS | |||
|---|---|---|---|
| Quadrant | BADHDUFLAG | Total packets | Discarded packets |
| A | 0 | 152 | 0 |
| B | 0 | 152 | 0 |
| C | 0 | 152 | 0 |
| D | 0 | 152 | 0 |
| Quadrant | Total seconds | Saturated seconds | Saturation percentage |
|---|---|---|---|
| A | 7358 | 684 | 9.296004% |
| B | 7359 | 134 | 1.820900% |
| C | 7359 | 142 | 1.929610% |
| D | 7359 | 142 | 1.929610% |
Noise dominated data is calculated using 1-second bins in cleaned event files. If a bin has >2000 counts, and if more than 50% of those come from <1% of pixels, then it is considered to be noise-dominated and hence unusable.
| Quadrant | # 1 sec bins | Bins with >0 counts | Bins with >2000 counts | High rate bins dominated by noise | Noise dominated (total time) | Noise dominated (detector-on time) | Marked lightcurve |
|---|---|---|---|---|---|---|---|
| A | 7728 | 7361 | 404 | 404 | 5.23% | 5.49% | 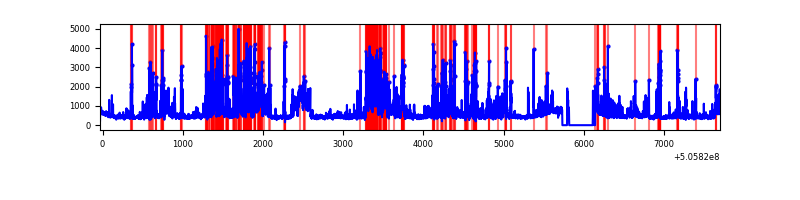 |
| B | 7729 | 7362 | 8 | 8 | 0.10% | 0.11% | 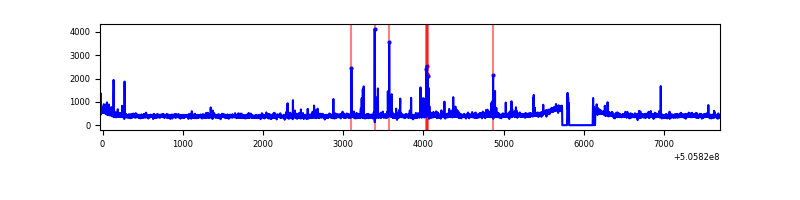 |
| C | 7729 | 7362 | 52 | 52 | 0.67% | 0.71% | 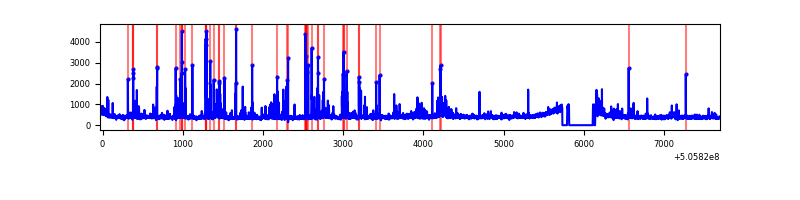 |
| D | 7729 | 7362 | 27 | 27 | 0.35% | 0.37% | 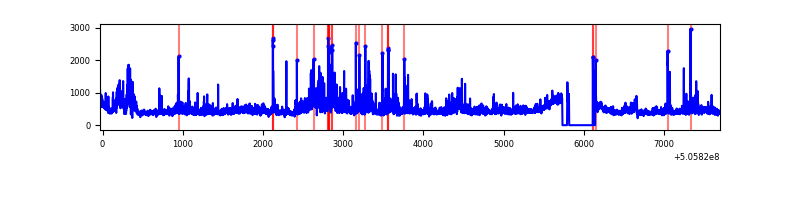 |
Top three noisy pixels from each quadrant. If the there are fewer than three noisy pixels in the level2.evt file, extra rows are filled as -1
| Pixel properties | Quadrant properties | ||||||
|---|---|---|---|---|---|---|---|
| Quadrant | DetID | PixID | Counts | Sigma | Mean | Median | Sigma |
| A | 7 | 64 | 1550378 | 8551.24 | 736 | 718 | 181.2 |
| A | 12 | 115 | 604459 | 3331.53 | 736 | 718 | 181.2 |
| A | 0 | 8 | 319644 | 1759.88 | 736 | 718 | 181.2 |
| B | 7 | 252 | 82143 | 504.75 | 746 | 717 | 161.3 |
| B | 0 | 171 | 39847 | 242.56 | 746 | 717 | 161.3 |
| B | 12 | 111 | 19308 | 115.24 | 746 | 717 | 161.3 |
| C | 6 | 9 | 113837 | 571.92 | 726 | 717 | 197.8 |
| C | 6 | 223 | 110952 | 557.34 | 726 | 717 | 197.8 |
| C | 13 | 3 | 108806 | 546.49 | 726 | 717 | 197.8 |
| D | 11 | 129 | 354653 | 1717.23 | 733 | 699 | 206.1 |
| D | 8 | 245 | 207557 | 1003.58 | 733 | 699 | 206.1 |
| D | 7 | 129 | 127956 | 617.39 | 733 | 699 | 206.1 |
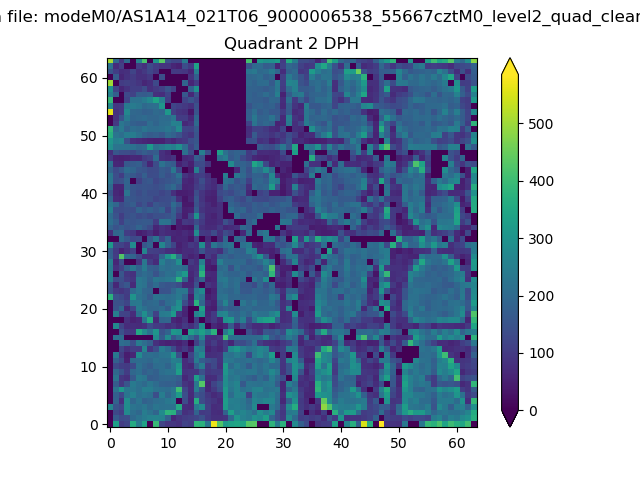
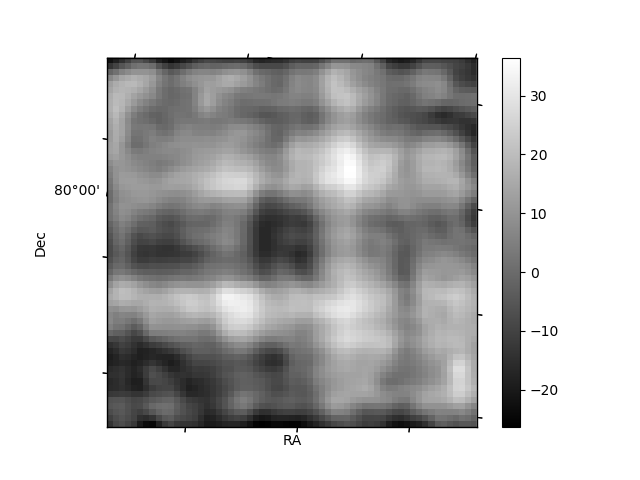
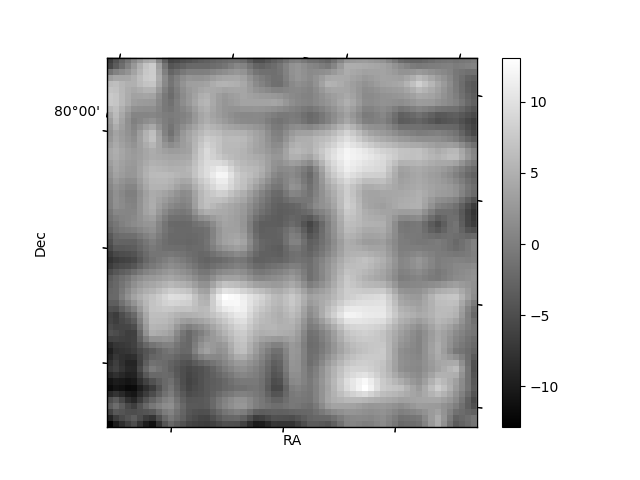
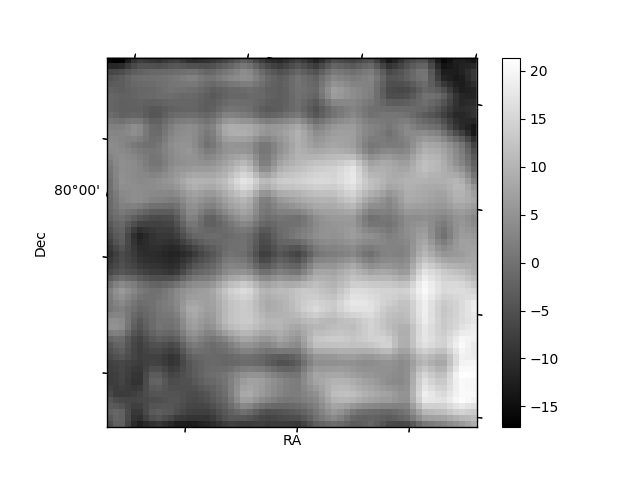
Histogram calculated using DETX and DETY for each event in the final _common_clean file
| Quadrant A | 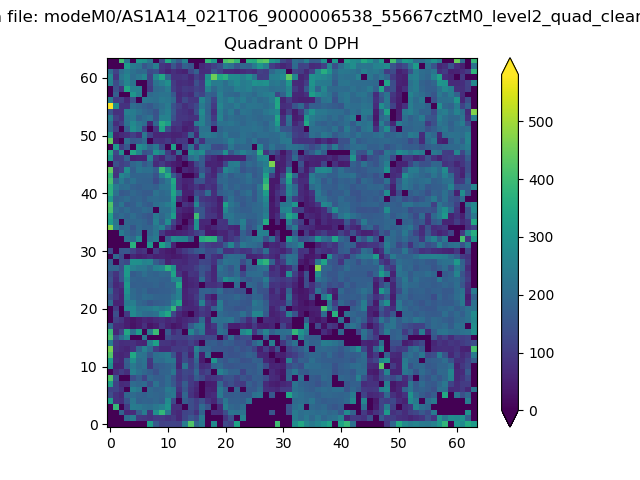 |
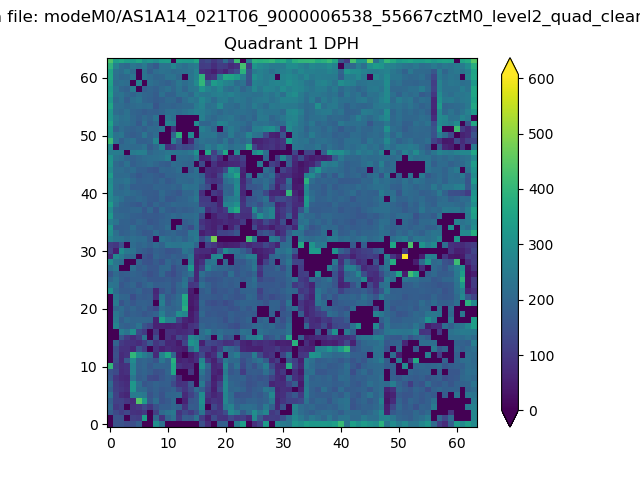 |
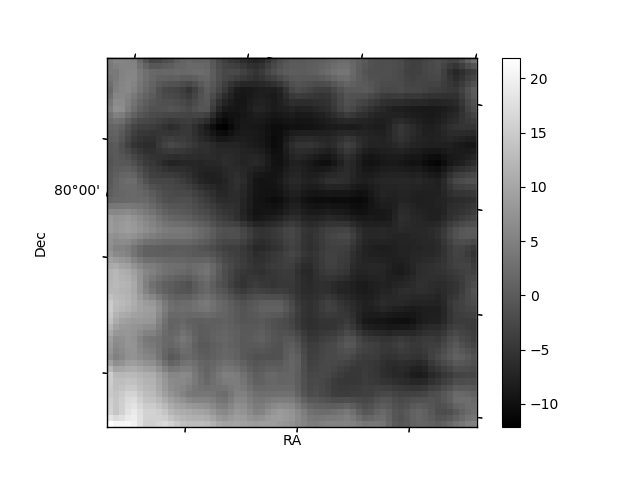
Quadrant B |
|---|---|---|---|
| Quadrant D | 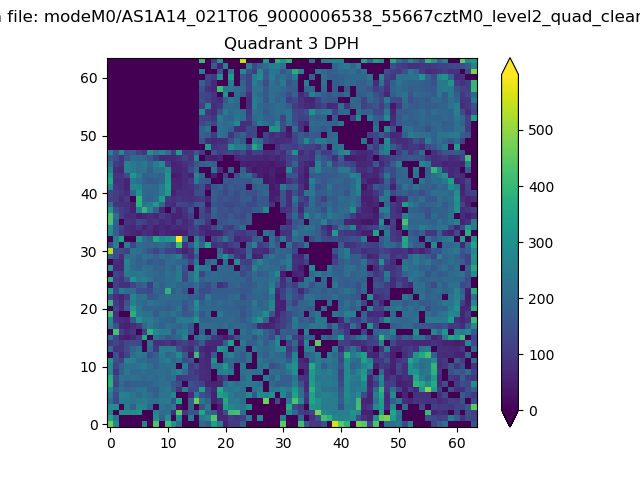 |
 |
Quadrant C |
| Plot type | Count rate plots | Images |
|---|---|---|
| Comparison with Poisson distribution Blue bars denote a histogram of data divided into 1 sec bins. Red curve is a Poisson curve with rate = median count rate of data. |
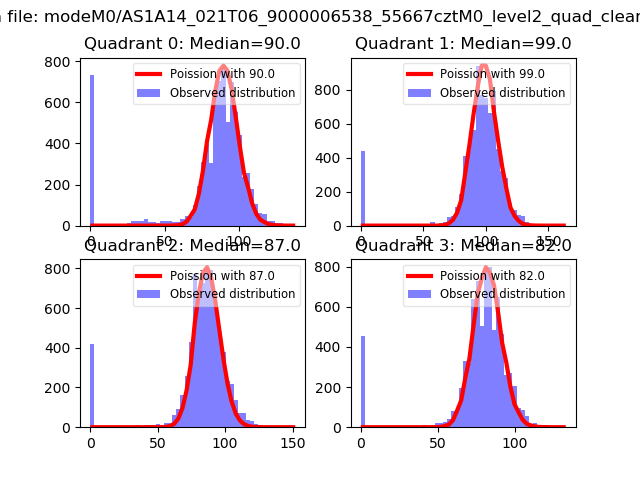 |
 |
| Quadrant-wise count rates Data is divided into 100 sec bins |
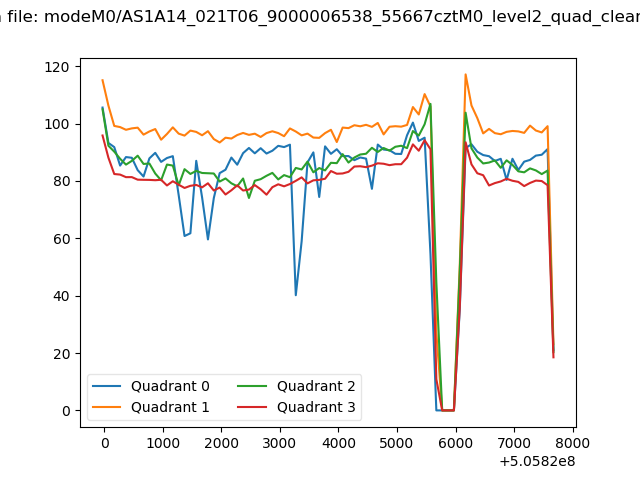 |
|
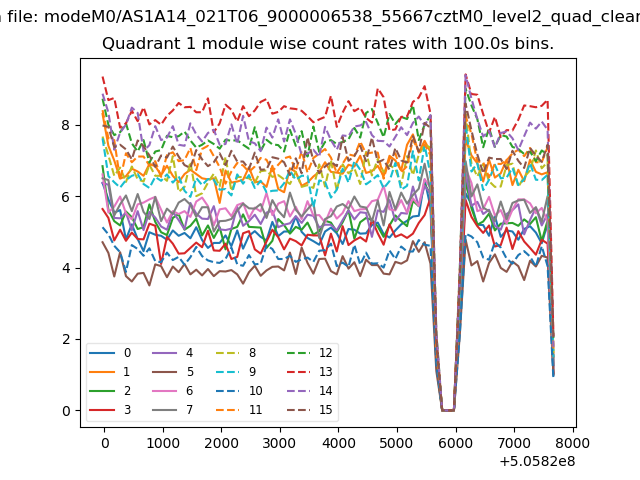
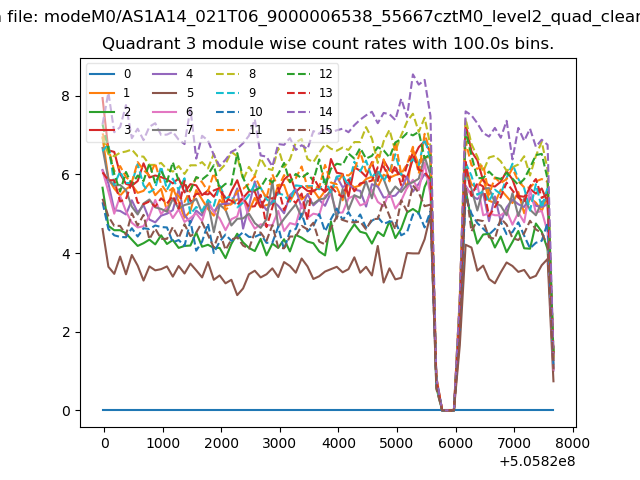
| Module-wise count rates for Quadrant A Data is divided into 100 sec bins |
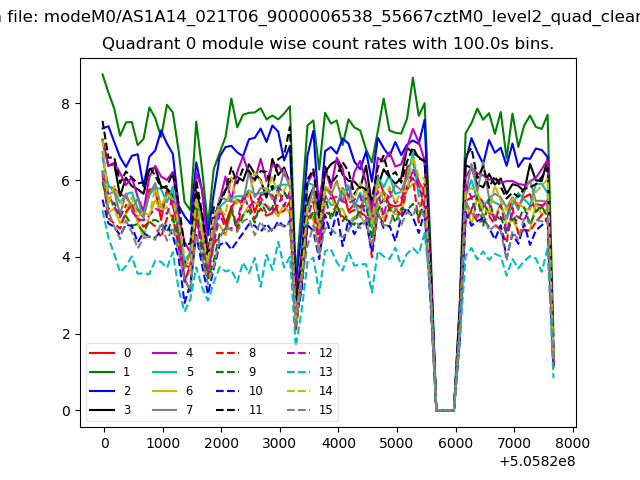 |
 |
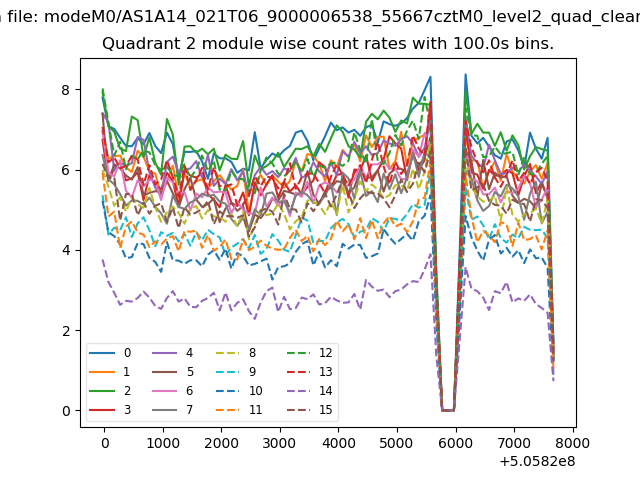
| Module-wise count rates for Quadrant B Data is divided into 100 sec bins |
 |
 |
| Module-wise count rates for Quadrant C Data is divided into 100 sec bins |
 |
 |
| Module-wise count rates for Quadrant D Data is divided into 100 sec bins |
 |
 |
| Parameter | Plot |
|---|---|
| CZT HV Monitor | 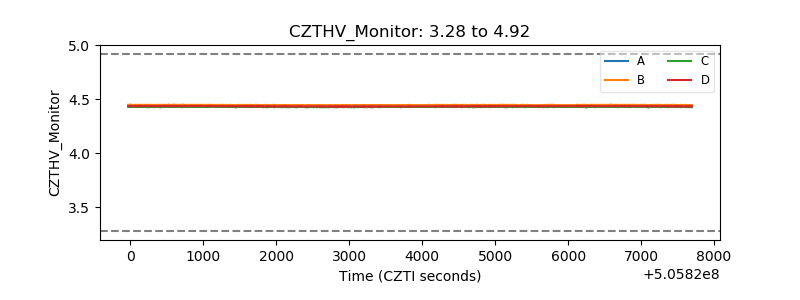 |
| D_VDD | 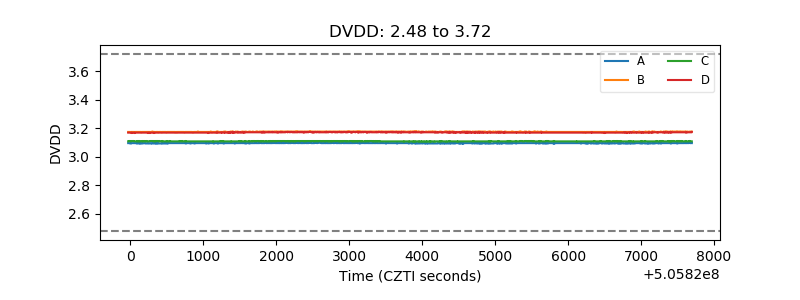 |
| Temperature 1 | 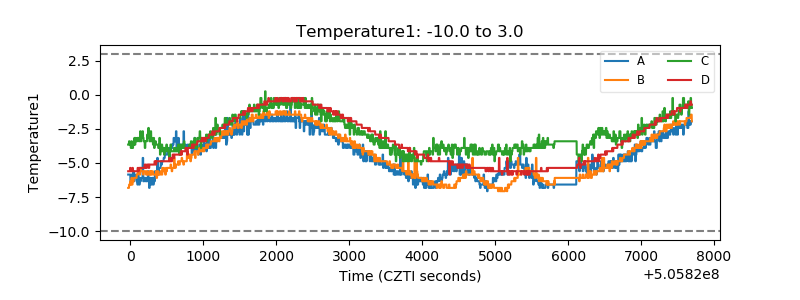 |
| Veto HV Monitor | 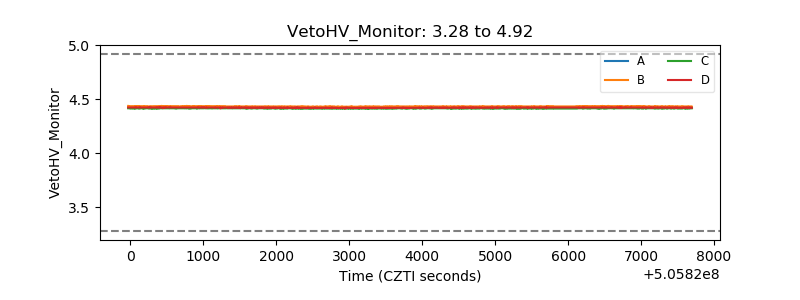 |
| Veto LLD | 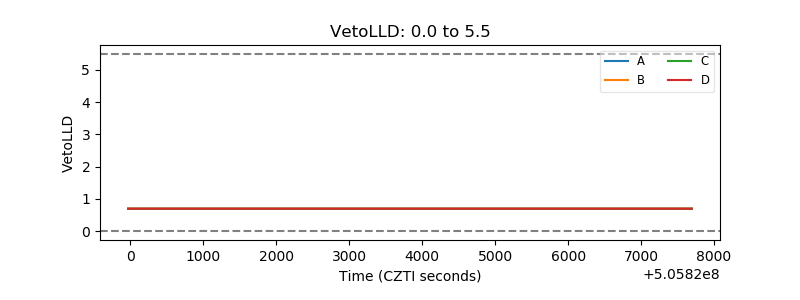 |
| Alpha Counter | 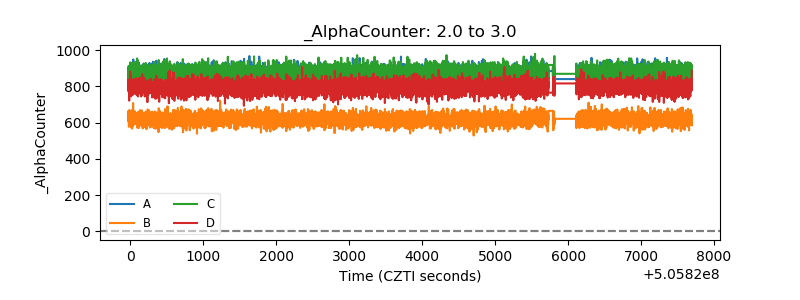 |
| _CPM_Rate | 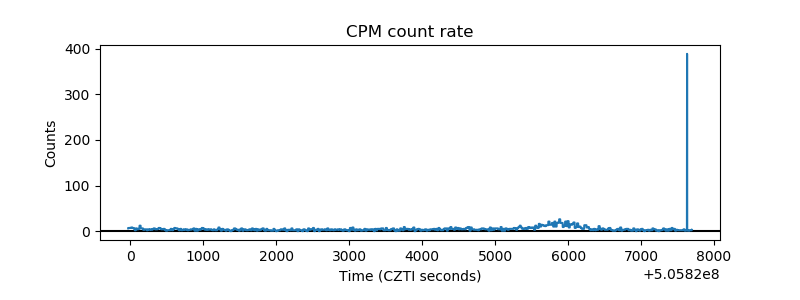 |
| CZT Counter | 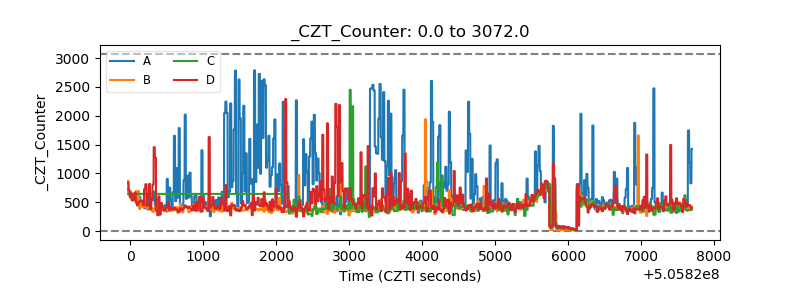 |
| +2.5 Volts monitor | 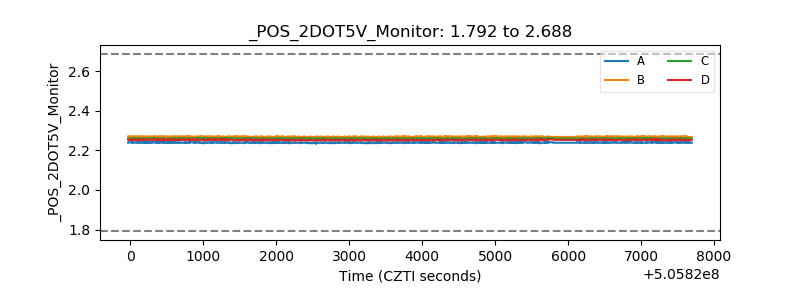 |
| +5 Volts monitor | 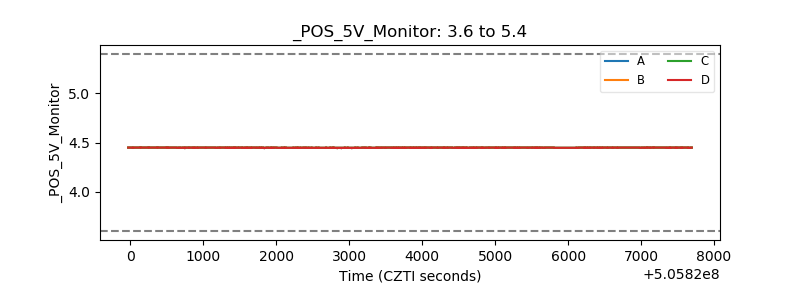 |
| _ROLL_ROT | 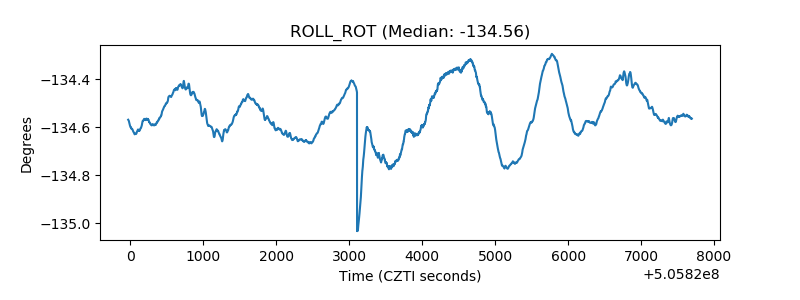 |
| _Roll_DEC | 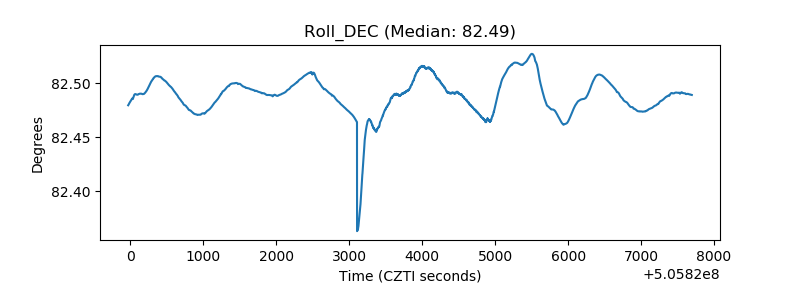 |
| _Roll_RA | 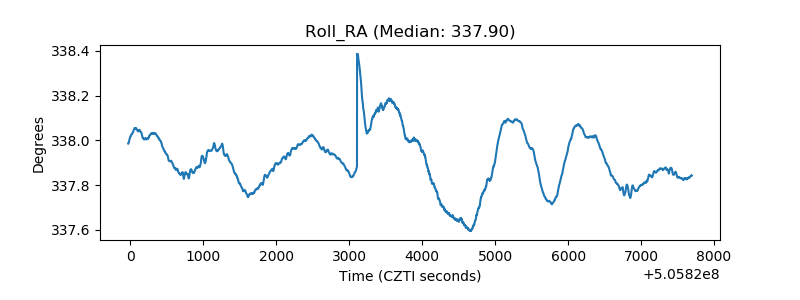 |
| Veto Counter | 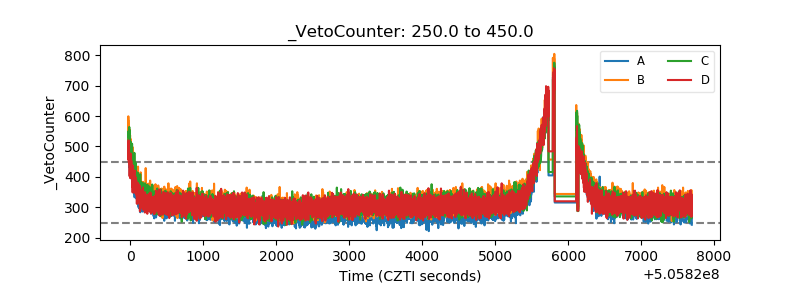 |