| Param | Original file | Final file |
|---|---|---|
| Filename | modeM0/AS1A14_021T06_9000006538_55669cztM0_level2.fits | modeM0/AS1A14_021T06_9000006538_55669cztM0_level2_quad_clean.evt |
| Size (bytes) | 512,369,280 | 101,335,680 |
| Size | 488.6 MB | 96.6 MB |
| Events in quadrant A | 6,256,727 | 635,351 |
| Events in quadrant B | 3,010,749 | 722,495 |
| Events in quadrant C | 3,445,710 | 627,933 |
| Events in quadrant D | 5,680,148 | 568,929 |
| Mode M0 | |||
|---|---|---|---|
| Quadrant | BADHDUFLAG | Total packets | Discarded packets |
| A | 0 | 23800 | 7 |
| B | 0 | 14900 | 0 |
| C | 0 | 16042 | 0 |
| D | 0 | 22001 | 0 |
| Mode SS | |||
|---|---|---|---|
| Quadrant | BADHDUFLAG | Total packets | Discarded packets |
| A | 0 | 148 | 0 |
| B | 0 | 148 | 0 |
| C | 0 | 148 | 0 |
| D | 0 | 148 | 0 |
| Quadrant | Total seconds | Saturated seconds | Saturation percentage |
|---|---|---|---|
| A | 7376 | 555 | 7.524403% |
| B | 7376 | 8 | 0.108460% |
| C | 7377 | 73 | 0.989562% |
| D | 7377 | 510 | 6.913379% |
Noise dominated data is calculated using 1-second bins in cleaned event files. If a bin has >2000 counts, and if more than 50% of those come from <1% of pixels, then it is considered to be noise-dominated and hence unusable.
| Quadrant | # 1 sec bins | Bins with >0 counts | Bins with >2000 counts | High rate bins dominated by noise | Noise dominated (total time) | Noise dominated (detector-on time) | Marked lightcurve |
|---|---|---|---|---|---|---|---|
| A | 7376 | 7376 | 518 | 518 | 7.02% | 7.02% | 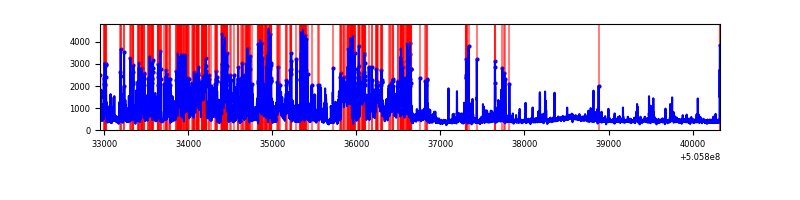 |
| B | 7376 | 7376 | 2 | 2 | 0.03% | 0.03% | 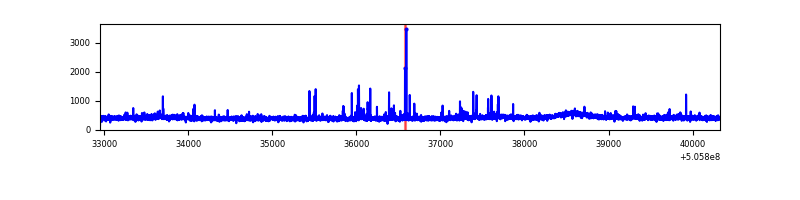 |
| C | 7377 | 7377 | 61 | 61 | 0.83% | 0.83% | 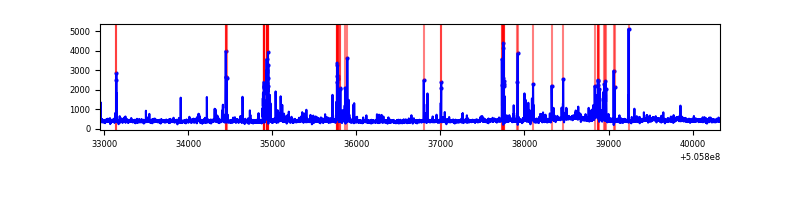 |
| D | 7377 | 7377 | 497 | 497 | 6.74% | 6.74% | 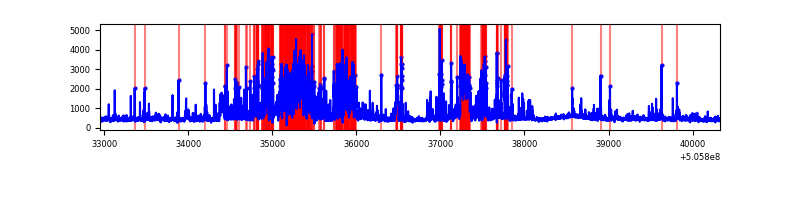 |
Top three noisy pixels from each quadrant. If the there are fewer than three noisy pixels in the level2.evt file, extra rows are filled as -1
| Pixel properties | Quadrant properties | ||||||
|---|---|---|---|---|---|---|---|
| Quadrant | DetID | PixID | Counts | Sigma | Mean | Median | Sigma |
| A | 7 | 64 | 1422989 | 7952.73 | 720 | 700 | 178.8 |
| A | 12 | 115 | 1244898 | 6956.93 | 720 | 700 | 178.8 |
| A | 0 | 8 | 356138 | 1987.43 | 720 | 700 | 178.8 |
| B | 7 | 252 | 40682 | 255.02 | 733 | 707 | 156.8 |
| B | 12 | 111 | 18697 | 114.77 | 733 | 707 | 156.8 |
| B | 10 | 247 | 18502 | 113.52 | 733 | 707 | 156.8 |
| C | 10 | 19 | 229093 | 1180.71 | 713 | 704 | 193.4 |
| C | 6 | 223 | 133778 | 687.95 | 713 | 704 | 193.4 |
| C | 9 | 38 | 81556 | 417.98 | 713 | 704 | 193.4 |
| D | 11 | 129 | 1433380 | 7202.64 | 700 | 666 | 198.9 |
| D | 8 | 245 | 961729 | 4831.52 | 700 | 666 | 198.9 |
| D | 7 | 70 | 145513 | 728.18 | 700 | 666 | 198.9 |
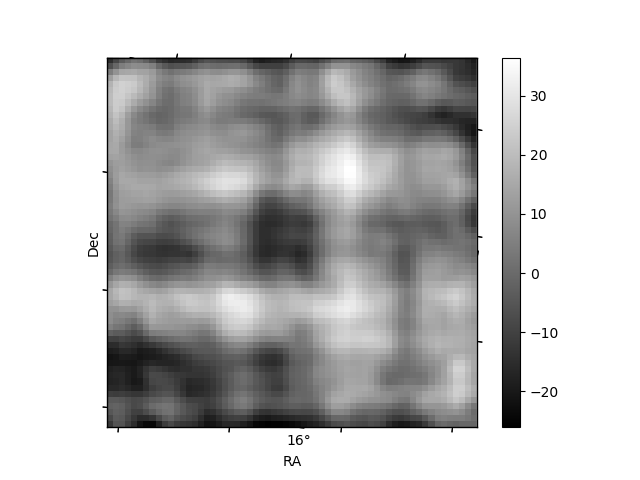
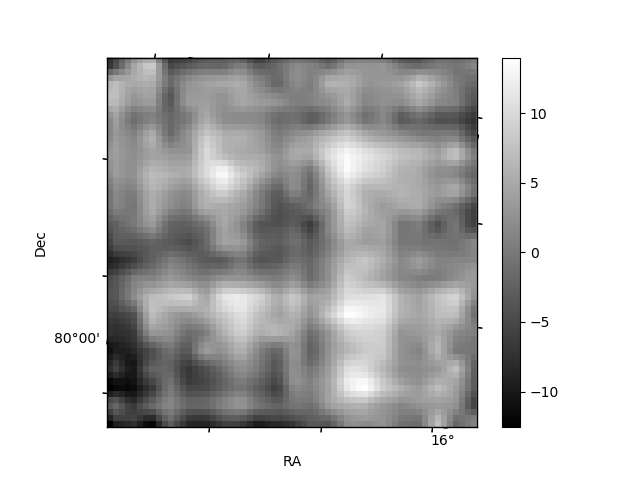
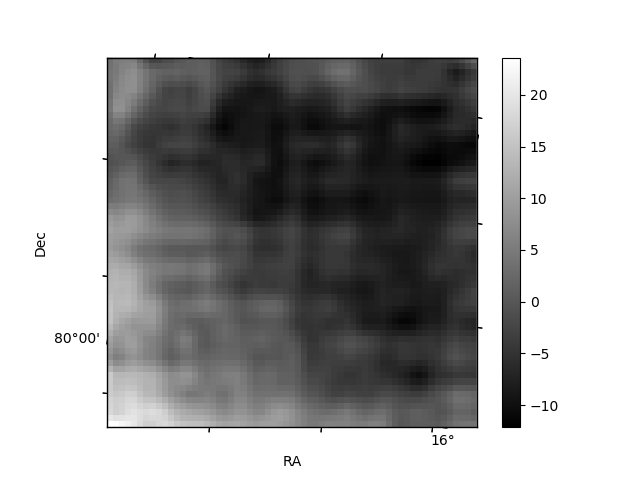
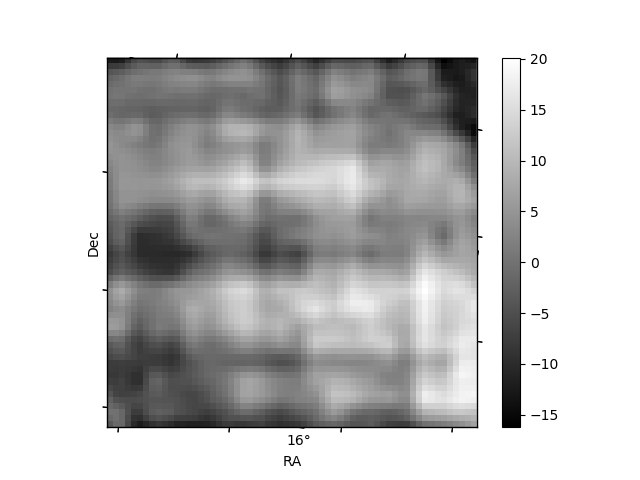
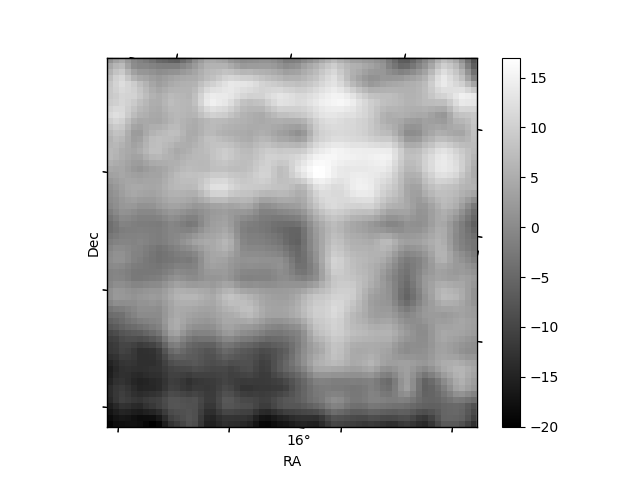
Histogram calculated using DETX and DETY for each event in the final _common_clean file
| Quadrant A | 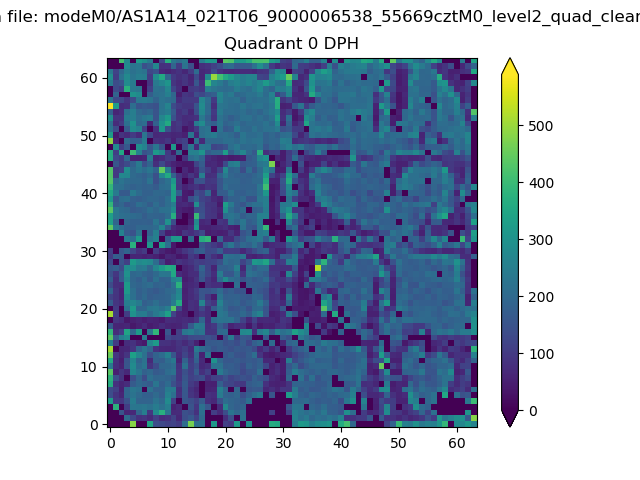 |
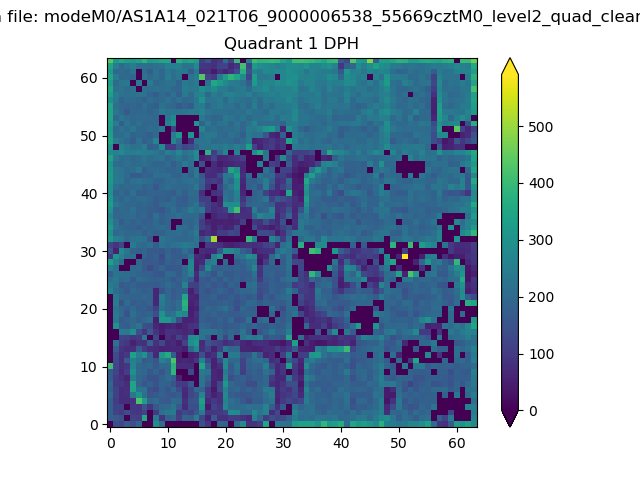 |
Quadrant B |
|---|---|---|---|
| Quadrant D | 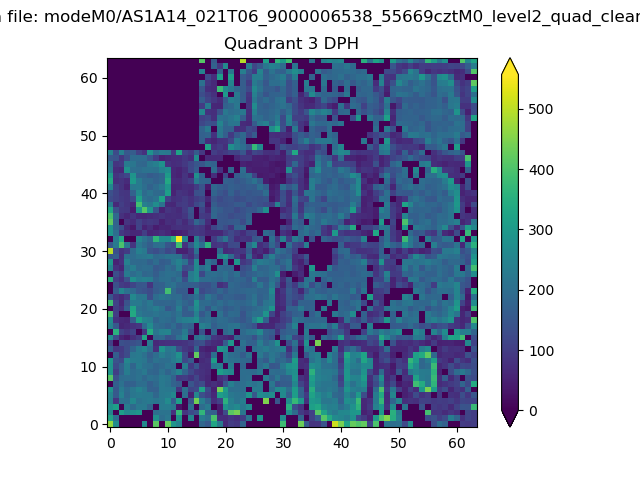 |
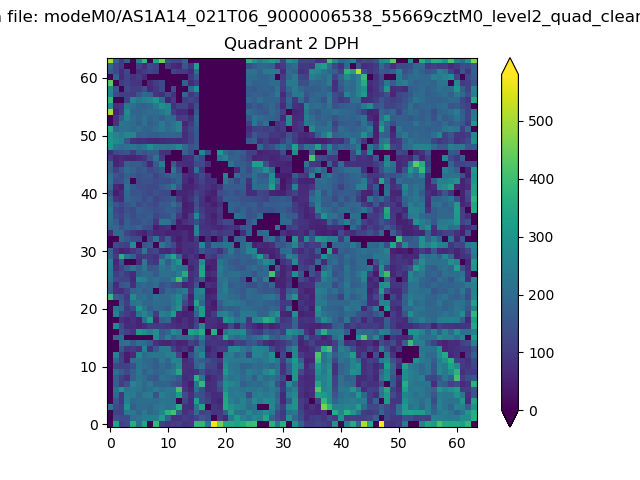 |
Quadrant C |
| Plot type | Count rate plots | Images |
|---|---|---|
| Comparison with Poisson distribution Blue bars denote a histogram of data divided into 1 sec bins. Red curve is a Poisson curve with rate = median count rate of data. |
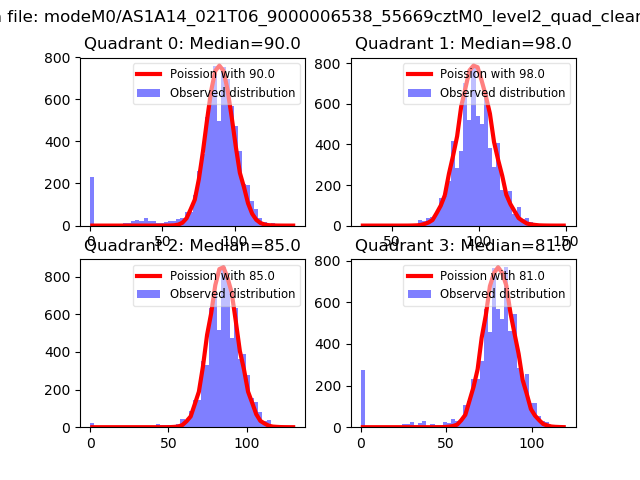 |
 |
| Quadrant-wise count rates Data is divided into 100 sec bins |
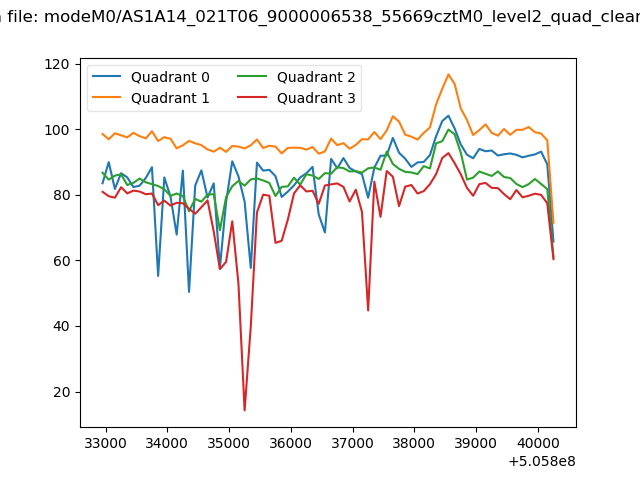 |
|
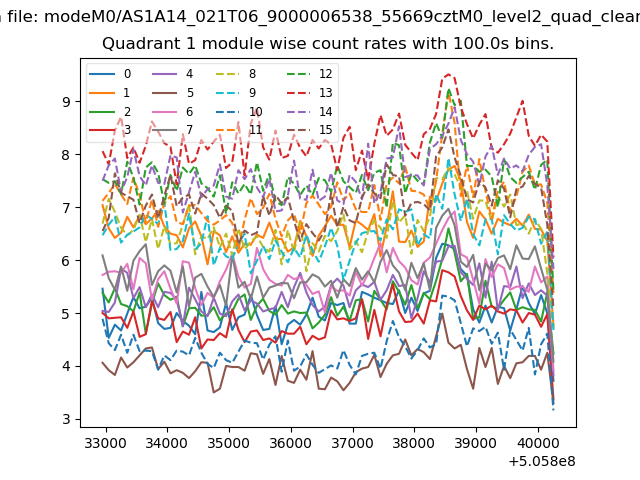
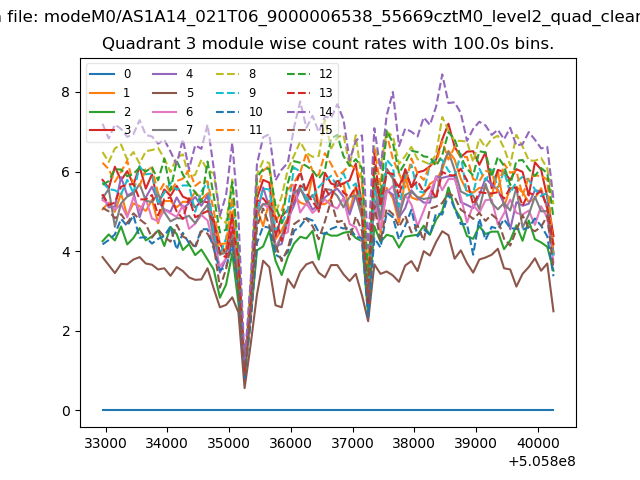
| Module-wise count rates for Quadrant A Data is divided into 100 sec bins |
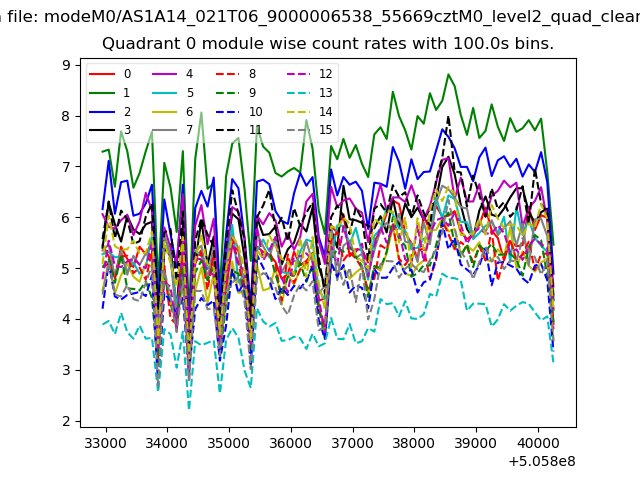 |
 |
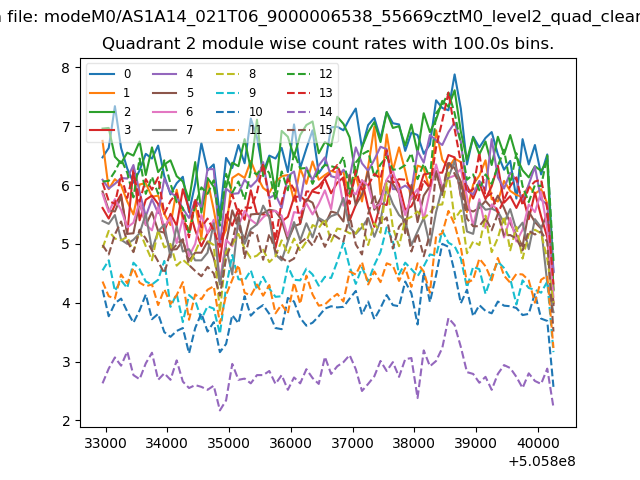
| Module-wise count rates for Quadrant B Data is divided into 100 sec bins |
 |
 |
| Module-wise count rates for Quadrant C Data is divided into 100 sec bins |
 |
 |
| Module-wise count rates for Quadrant D Data is divided into 100 sec bins |
 |
 |
| Parameter | Plot |
|---|---|
| CZT HV Monitor | 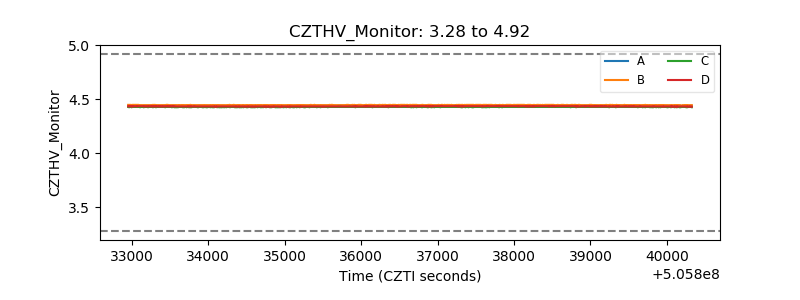 |
| D_VDD | 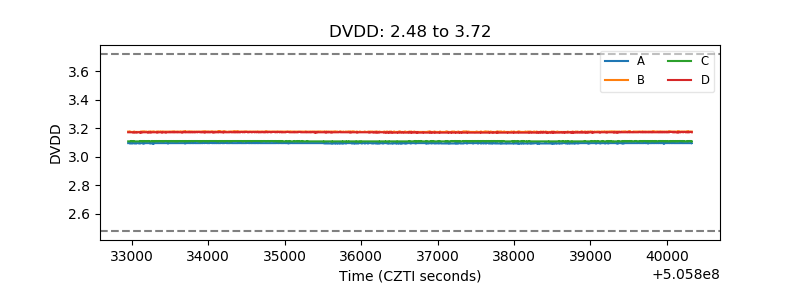 |
| Temperature 1 | 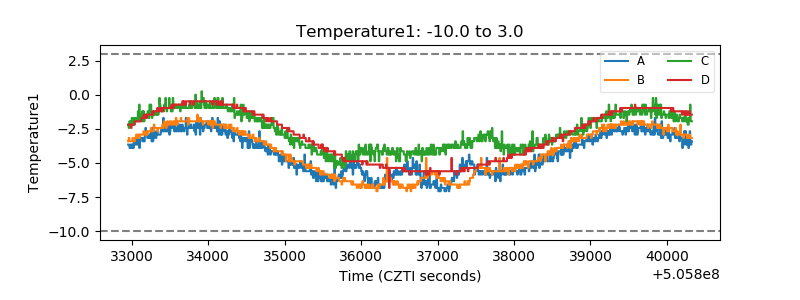 |
| Veto HV Monitor | 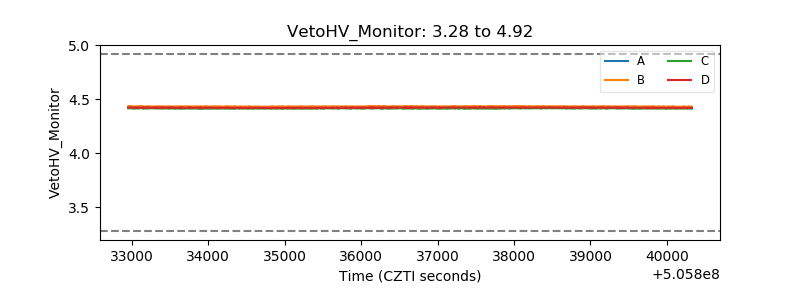 |
| Veto LLD | 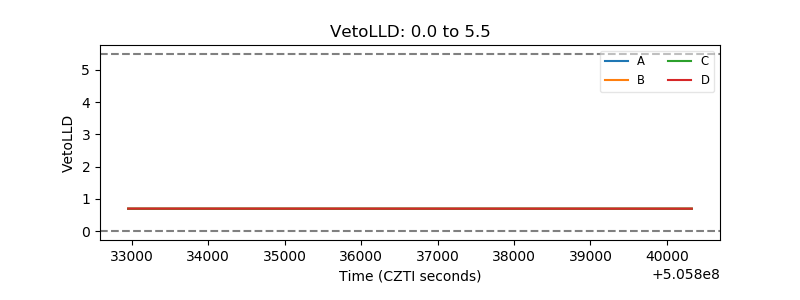 |
| Alpha Counter | 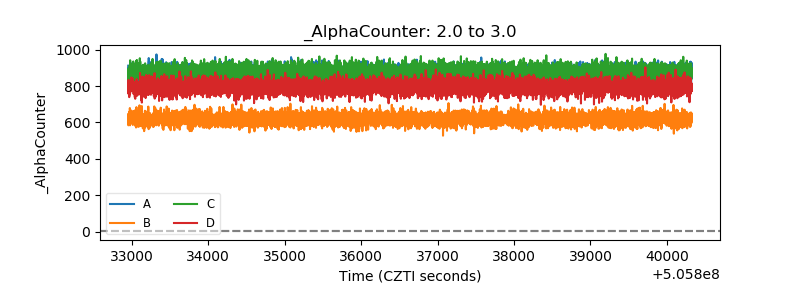 |
| _CPM_Rate | 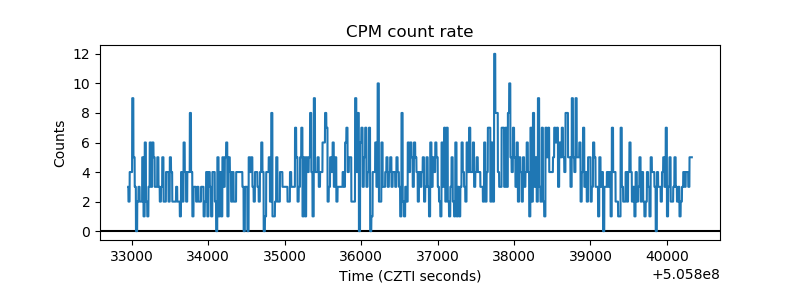 |
| CZT Counter | 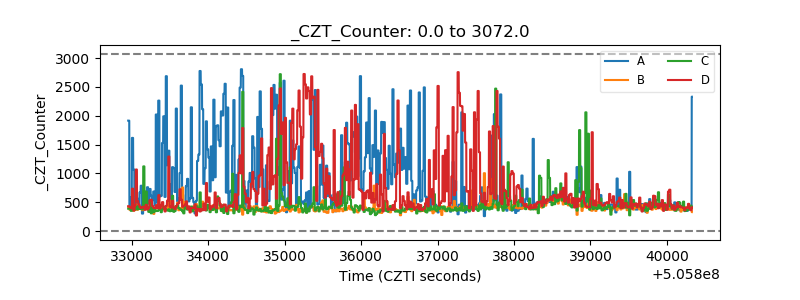 |
| +2.5 Volts monitor | 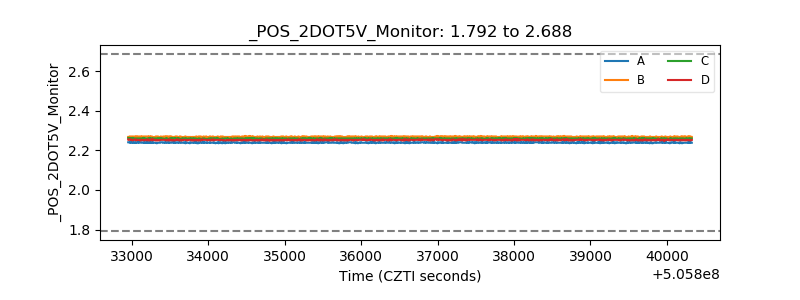 |
| +5 Volts monitor | 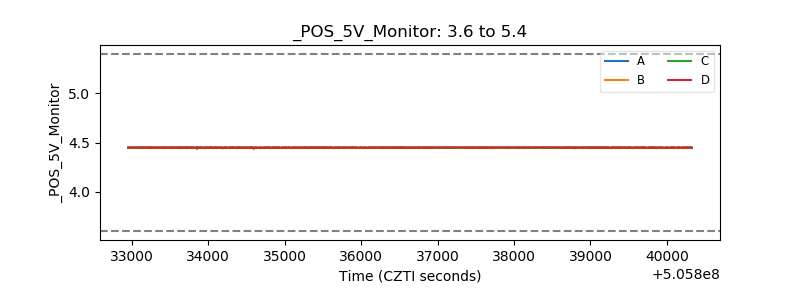 |
| _ROLL_ROT | 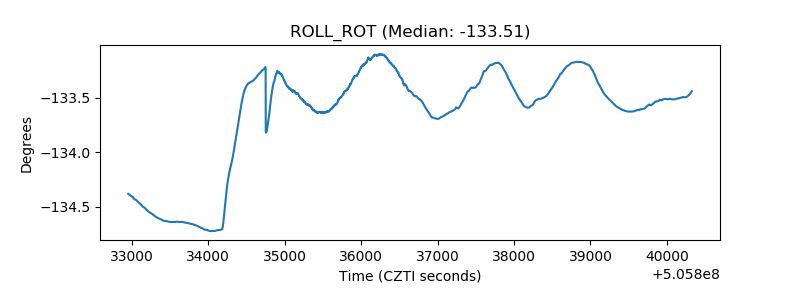 |
| _Roll_DEC | 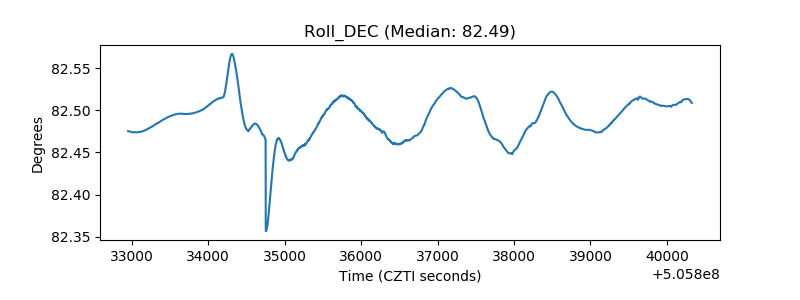 |
| _Roll_RA | 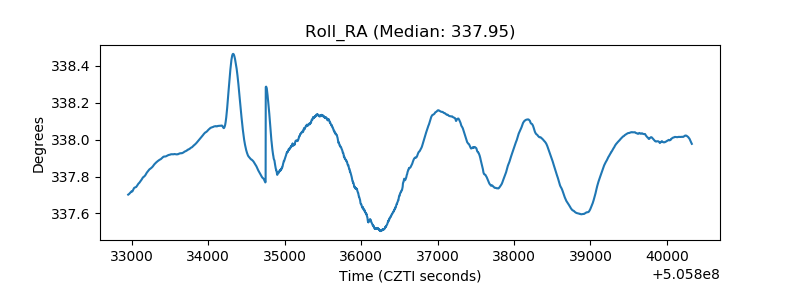 |
| Veto Counter | 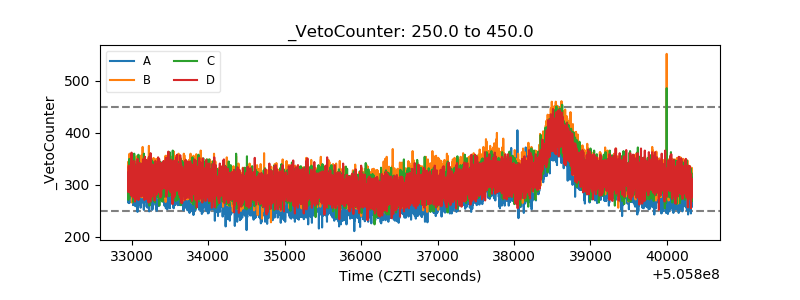 |