| Param | Original file | Final file |
|---|---|---|
| Filename | modeM0/AS1A14_021T06_9000006538_55674cztM0_level2.fits | modeM0/AS1A14_021T06_9000006538_55674cztM0_level2_quad_clean.evt |
| Size (bytes) | 391,245,120 | 101,422,080 |
| Size | 373.1 MB | 96.7 MB |
| Events in quadrant A | 4,166,498 | 652,938 |
| Events in quadrant B | 2,986,051 | 701,713 |
| Events in quadrant C | 3,501,323 | 622,087 |
| Events in quadrant D | 3,278,221 | 602,020 |
| Mode M9 | |||
|---|---|---|---|
| Quadrant | BADHDUFLAG | Total packets | Discarded packets |
| A | 0 | 17 | 0 |
| B | 0 | 17 | 0 |
| C | 0 | 17 | 0 |
| D | 0 | 17 | 0 |
| Mode M0 | |||
|---|---|---|---|
| Quadrant | BADHDUFLAG | Total packets | Discarded packets |
| A | 0 | 17361 | 3 |
| B | 0 | 14596 | 2 |
| C | 0 | 15979 | 2 |
| D | 0 | 15242 | 2 |
| Mode SS | |||
|---|---|---|---|
| Quadrant | BADHDUFLAG | Total packets | Discarded packets |
| A | 0 | 144 | 0 |
| B | 0 | 144 | 0 |
| C | 0 | 144 | 0 |
| D | 0 | 144 | 0 |
| Quadrant | Total seconds | Saturated seconds | Saturation percentage |
|---|---|---|---|
| A | 7071 | 119 | 1.682930% |
| B | 7071 | 50 | 0.707114% |
| C | 7071 | 123 | 1.739499% |
| D | 7071 | 32 | 0.452553% |
Noise dominated data is calculated using 1-second bins in cleaned event files. If a bin has >2000 counts, and if more than 50% of those come from <1% of pixels, then it is considered to be noise-dominated and hence unusable.
| Quadrant | # 1 sec bins | Bins with >0 counts | Bins with >2000 counts | High rate bins dominated by noise | Noise dominated (total time) | Noise dominated (detector-on time) | Marked lightcurve |
|---|---|---|---|---|---|---|---|
| A | 8726 | 7073 | 100 | 100 | 1.15% | 1.41% | 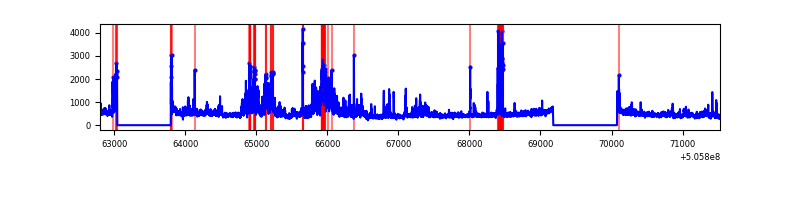 |
| B | 8726 | 7073 | 7 | 7 | 0.08% | 0.10% | 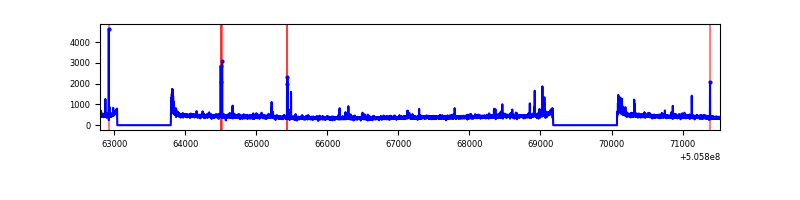 |
| C | 8726 | 7073 | 79 | 79 | 0.91% | 1.12% | 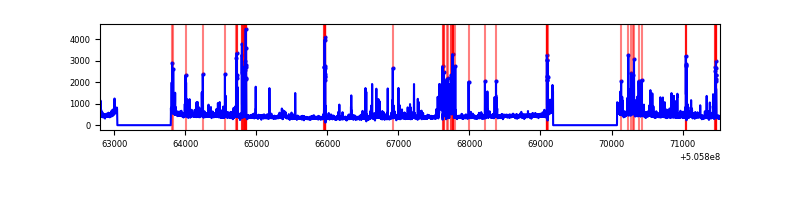 |
| D | 8726 | 7073 | 15 | 15 | 0.17% | 0.21% | 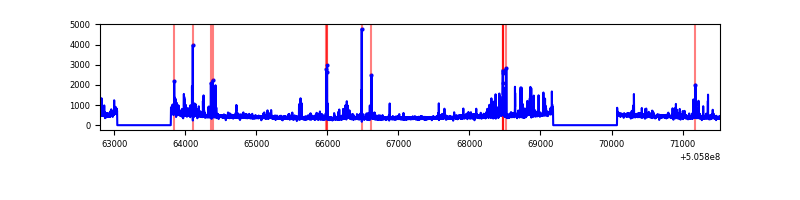 |
Top three noisy pixels from each quadrant. If the there are fewer than three noisy pixels in the level2.evt file, extra rows are filled as -1
| Pixel properties | Quadrant properties | ||||||
|---|---|---|---|---|---|---|---|
| Quadrant | DetID | PixID | Counts | Sigma | Mean | Median | Sigma |
| A | 12 | 115 | 857323 | 4781.04 | 715 | 696 | 179.2 |
| A | 0 | 8 | 188324 | 1047.2 | 715 | 696 | 179.2 |
| A | 7 | 243 | 114850 | 637.12 | 715 | 696 | 179.2 |
| B | 7 | 0 | 53667 | 342.81 | 714 | 688 | 154.5 |
| B | 10 | 247 | 29118 | 183.96 | 714 | 688 | 154.5 |
| B | 0 | 171 | 24767 | 155.81 | 714 | 688 | 154.5 |
| C | 6 | 223 | 248240 | 1273.7 | 702 | 696 | 194.4 |
| C | 13 | 3 | 112482 | 575.18 | 702 | 696 | 194.4 |
| C | 9 | 38 | 102304 | 522.81 | 702 | 696 | 194.4 |
| D | 3 | 12 | 171093 | 842.54 | 704 | 670 | 202.3 |
| D | 7 | 129 | 90057 | 441.91 | 704 | 670 | 202.3 |
| D | 11 | 129 | 67459 | 330.19 | 704 | 670 | 202.3 |
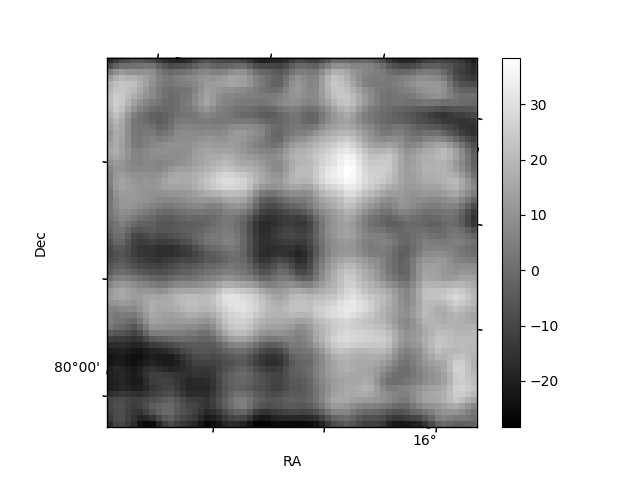
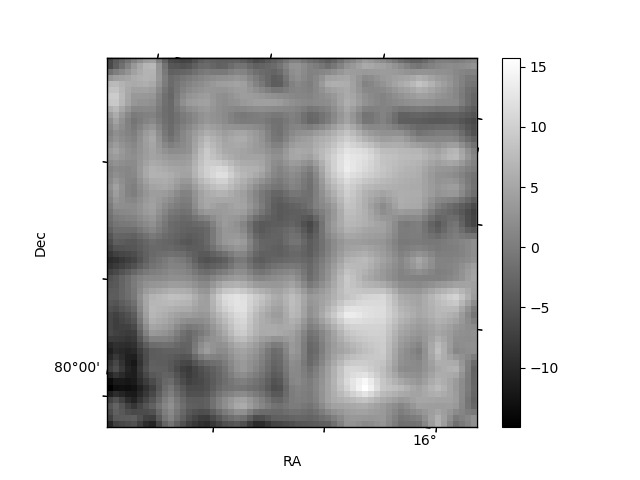
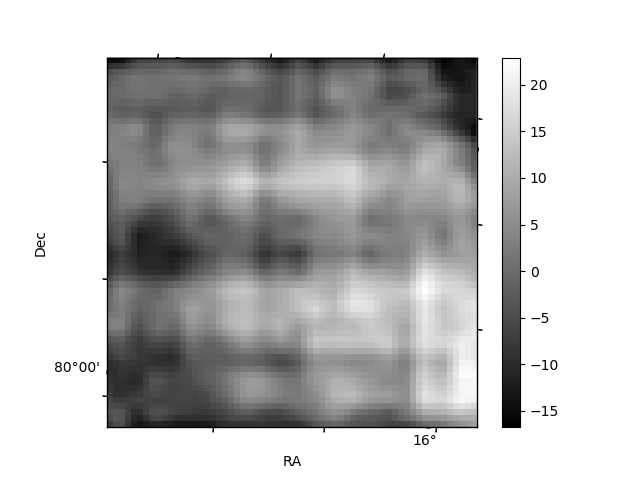
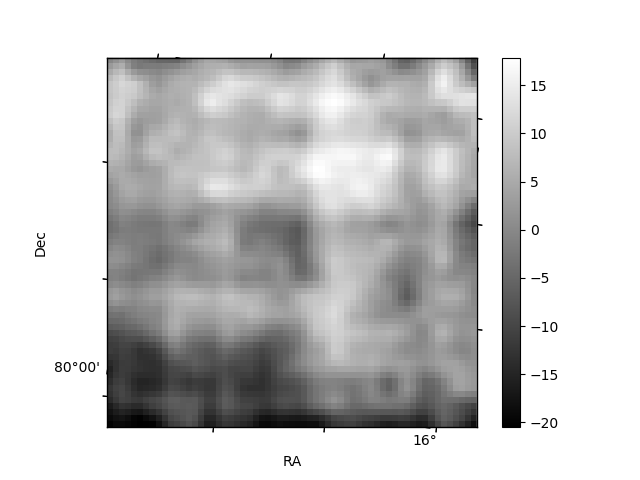
Histogram calculated using DETX and DETY for each event in the final _common_clean file
| Quadrant A | 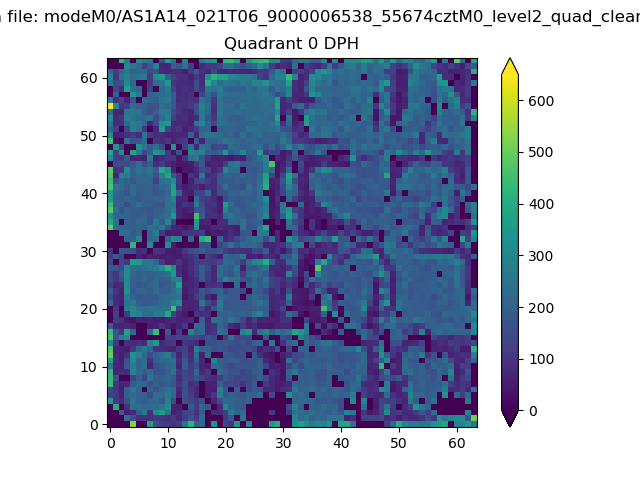 |
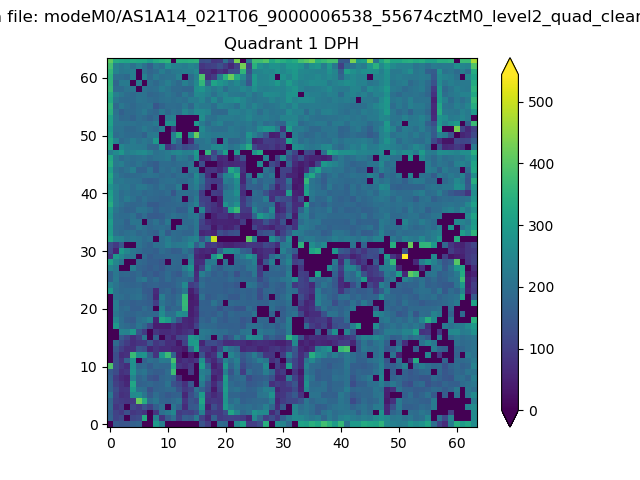 |
Quadrant B |
|---|---|---|---|
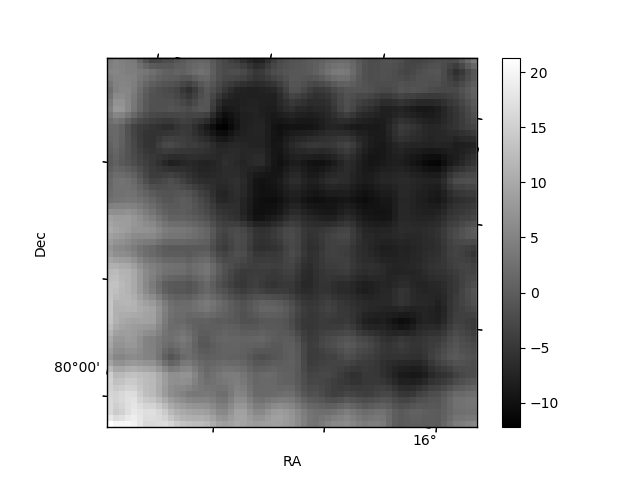
| Quadrant D | 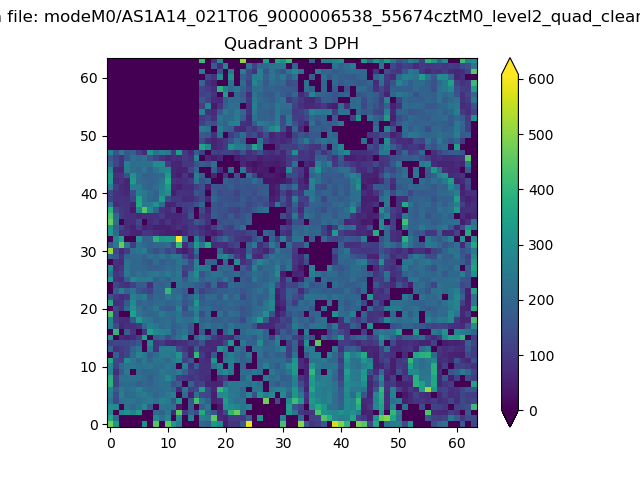 |
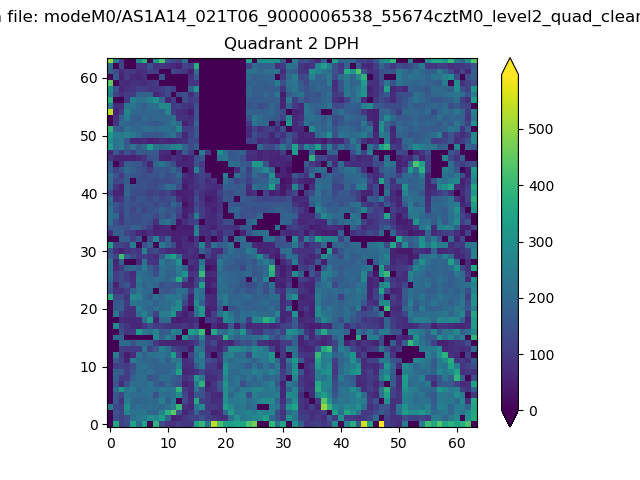 |
Quadrant C |
| Plot type | Count rate plots | Images |
|---|---|---|
| Comparison with Poisson distribution Blue bars denote a histogram of data divided into 1 sec bins. Red curve is a Poisson curve with rate = median count rate of data. |
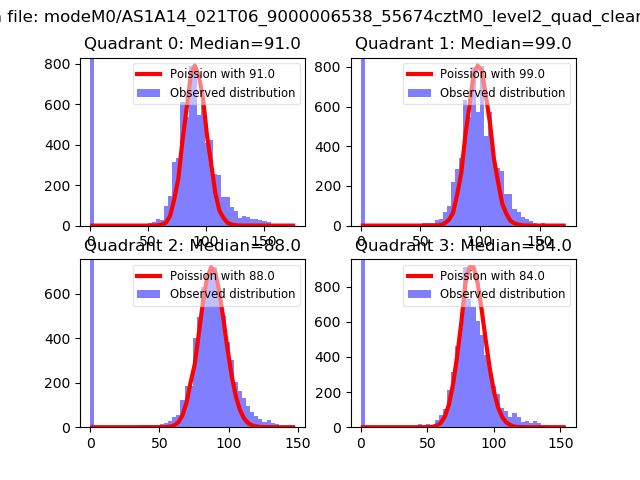 |
 |
| Quadrant-wise count rates Data is divided into 100 sec bins |
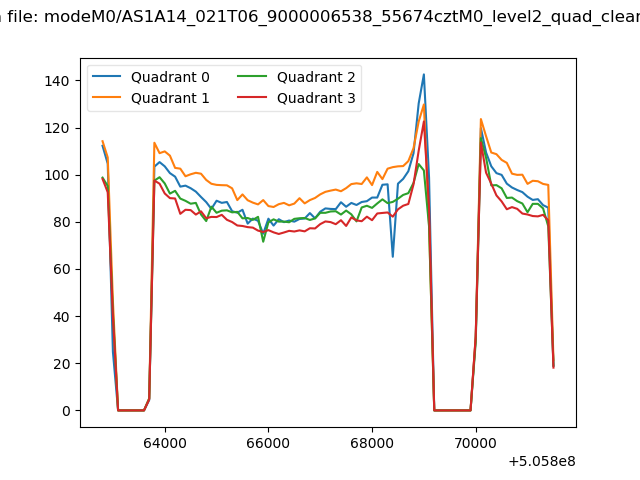 |
|
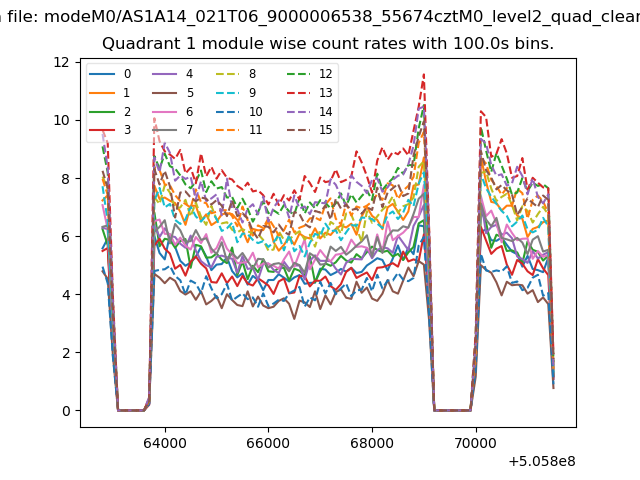
| Module-wise count rates for Quadrant A Data is divided into 100 sec bins |
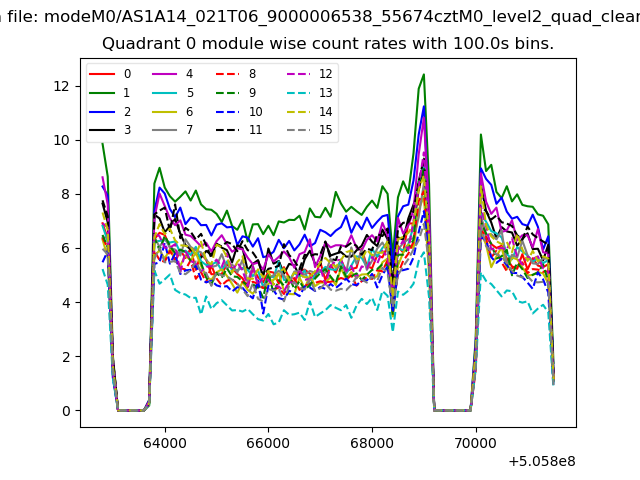 |
 |
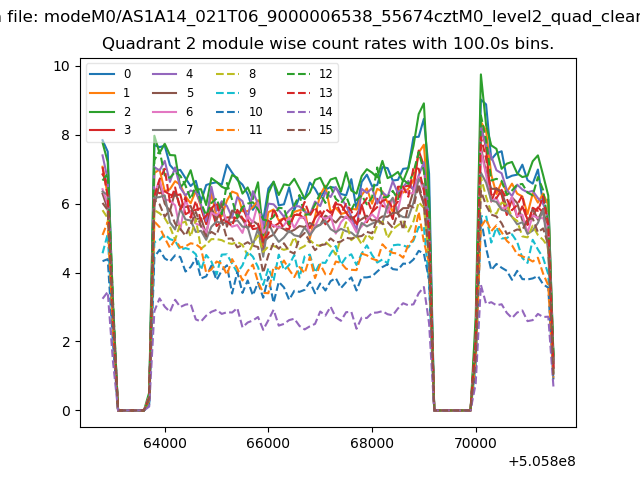
| Module-wise count rates for Quadrant B Data is divided into 100 sec bins |
 |
 |
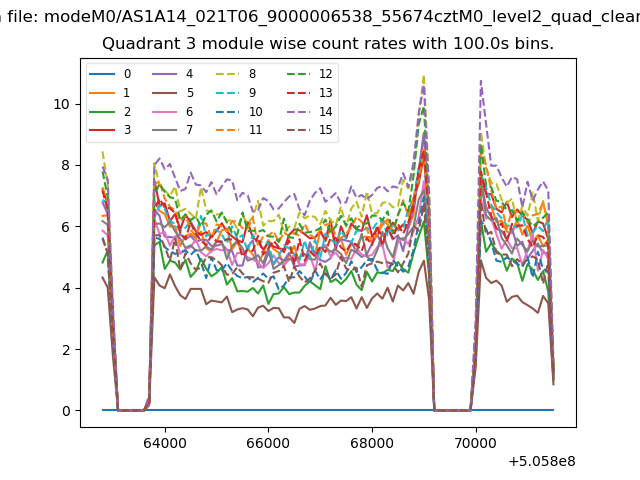
| Module-wise count rates for Quadrant C Data is divided into 100 sec bins |
 |
 |
| Module-wise count rates for Quadrant D Data is divided into 100 sec bins |
 |
 |
| Parameter | Plot |
|---|---|
| CZT HV Monitor | 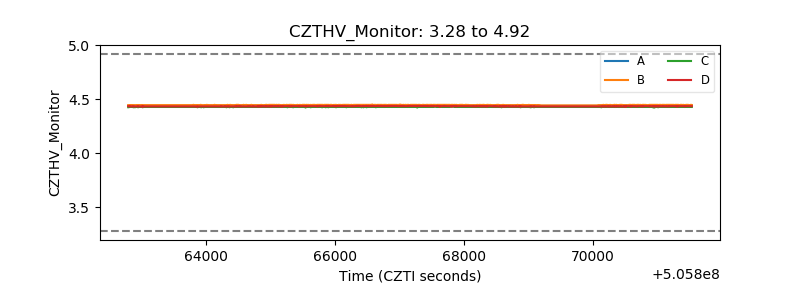 |
| D_VDD | 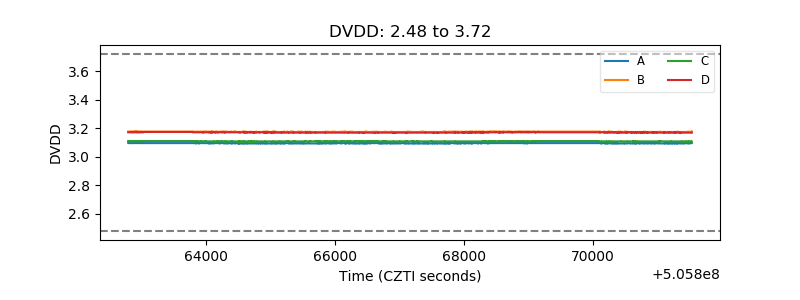 |
| Temperature 1 | 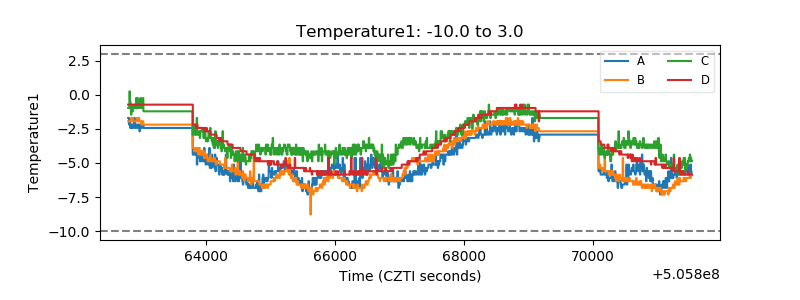 |
| Veto HV Monitor | 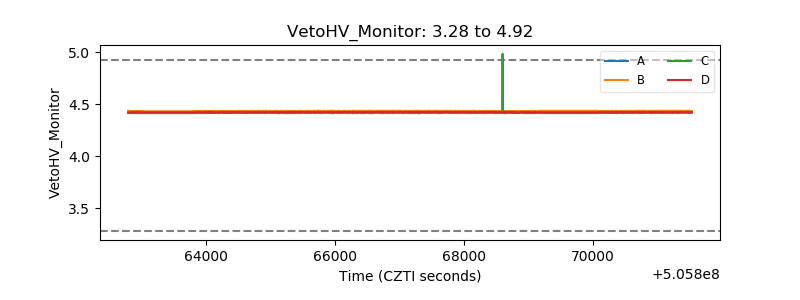 |
| Veto LLD | 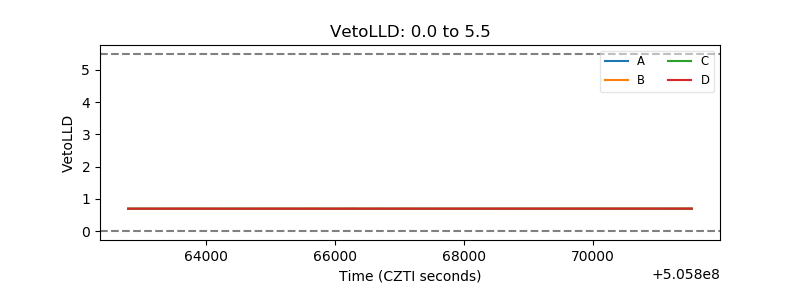 |
| Alpha Counter | 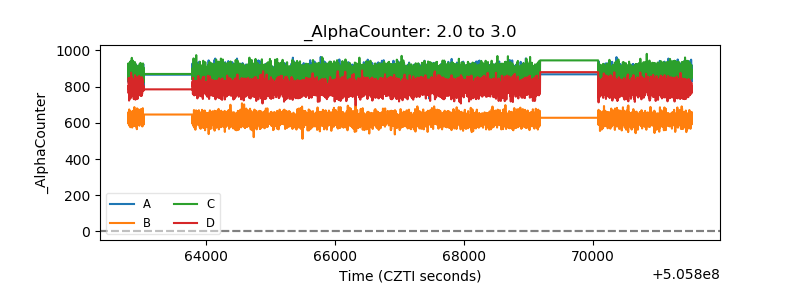 |
| _CPM_Rate | 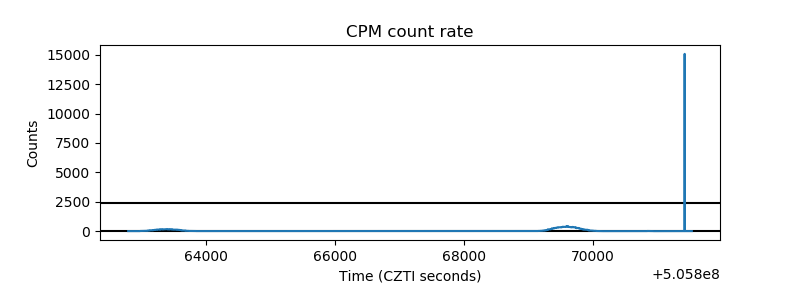 |
| CZT Counter | 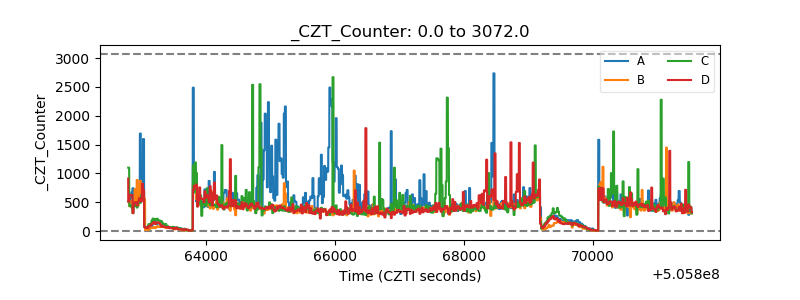 |
| +2.5 Volts monitor | 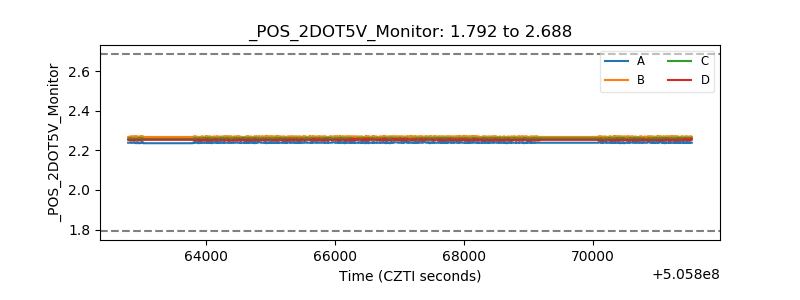 |
| +5 Volts monitor | 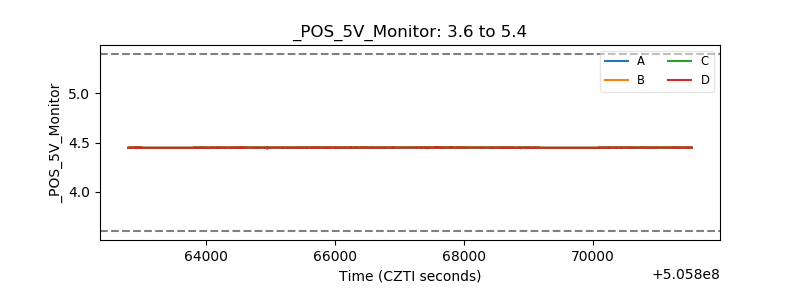 |
| _ROLL_ROT | 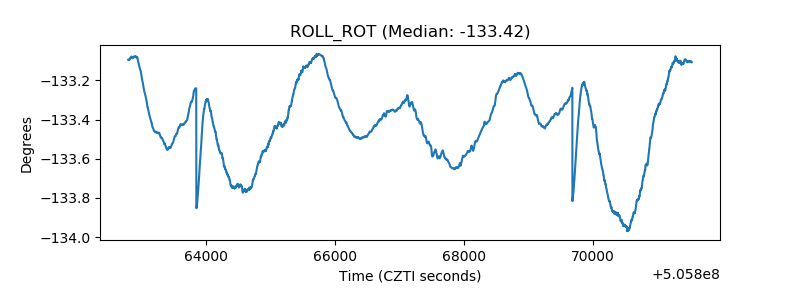 |
| _Roll_DEC | 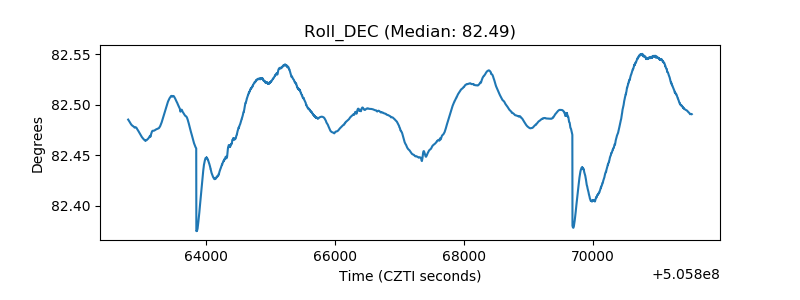 |
| _Roll_RA | 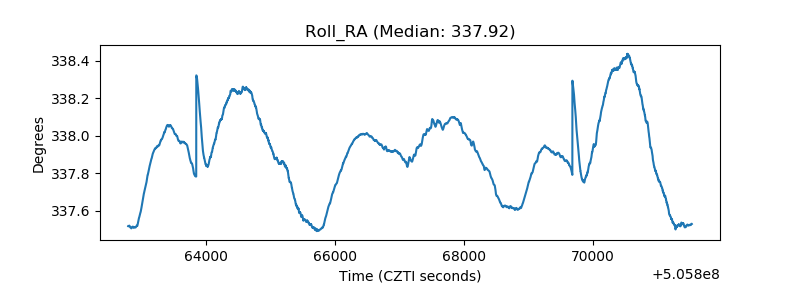 |
| Veto Counter | 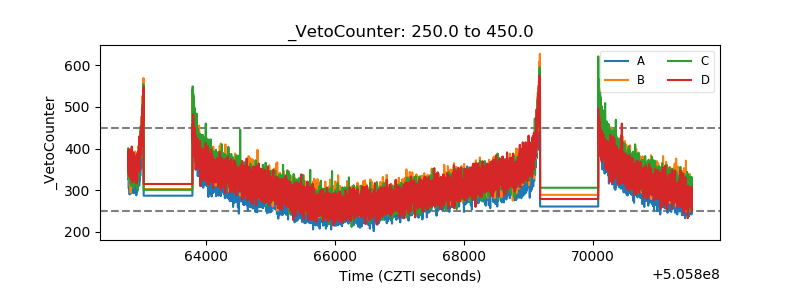 |