| Param | Original file | Final file |
|---|---|---|
| Filename | modeM0/AS1A14_021T06_9000006538_55676cztM0_level2.fits | modeM0/AS1A14_021T06_9000006538_55676cztM0_level2_quad_clean.evt |
| Size (bytes) | 380,583,360 | 99,192,960 |
| Size | 363.0 MB | 94.6 MB |
| Events in quadrant A | 4,181,952 | 618,590 |
| Events in quadrant B | 2,892,394 | 692,151 |
| Events in quadrant C | 3,149,695 | 620,685 |
| Events in quadrant D | 3,327,022 | 591,767 |
| Mode M9 | |||
|---|---|---|---|
| Quadrant | BADHDUFLAG | Total packets | Discarded packets |
| A | 0 | 19 | 0 |
| B | 0 | 19 | 0 |
| C | 0 | 19 | 0 |
| D | 0 | 19 | 0 |
| Mode M0 | |||
|---|---|---|---|
| Quadrant | BADHDUFLAG | Total packets | Discarded packets |
| A | 0 | 17325 | 2 |
| B | 0 | 14217 | 2 |
| C | 0 | 14922 | 2 |
| D | 0 | 15187 | 2 |
| Mode SS | |||
|---|---|---|---|
| Quadrant | BADHDUFLAG | Total packets | Discarded packets |
| A | 0 | 142 | 0 |
| B | 0 | 142 | 0 |
| C | 0 | 142 | 0 |
| D | 0 | 142 | 0 |
| Quadrant | Total seconds | Saturated seconds | Saturation percentage |
|---|---|---|---|
| A | 6892 | 319 | 4.628555% |
| B | 6893 | 54 | 0.783403% |
| C | 6893 | 75 | 1.088060% |
| D | 6893 | 48 | 0.696359% |
Noise dominated data is calculated using 1-second bins in cleaned event files. If a bin has >2000 counts, and if more than 50% of those come from <1% of pixels, then it is considered to be noise-dominated and hence unusable.
| Quadrant | # 1 sec bins | Bins with >0 counts | Bins with >2000 counts | High rate bins dominated by noise | Noise dominated (total time) | Noise dominated (detector-on time) | Marked lightcurve |
|---|---|---|---|---|---|---|---|
| A | 8812 | 6894 | 276 | 276 | 3.13% | 4.00% | 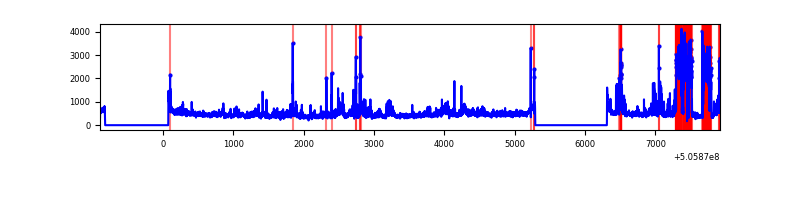 |
| B | 8813 | 6895 | 7 | 7 | 0.08% | 0.10% | 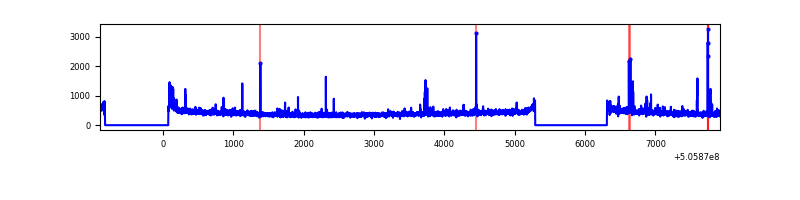 |
| C | 8813 | 6895 | 37 | 37 | 0.42% | 0.54% | 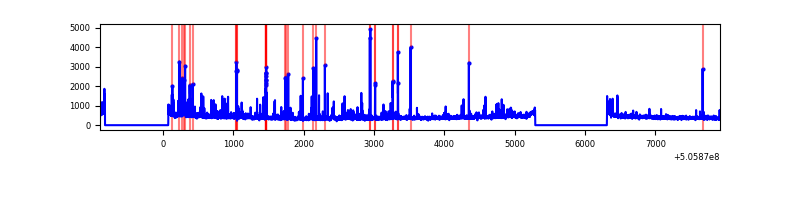 |
| D | 8813 | 6895 | 26 | 26 | 0.30% | 0.38% | 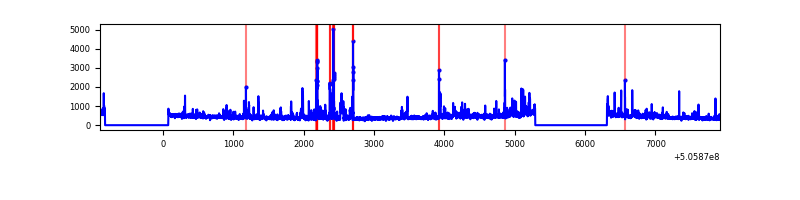 |
Top three noisy pixels from each quadrant. If the there are fewer than three noisy pixels in the level2.evt file, extra rows are filled as -1
| Pixel properties | Quadrant properties | ||||||
|---|---|---|---|---|---|---|---|
| Quadrant | DetID | PixID | Counts | Sigma | Mean | Median | Sigma |
| A | 12 | 115 | 910305 | 5319.32 | 685 | 667 | 171.0 |
| A | 15 | 32 | 307903 | 1796.63 | 685 | 667 | 171.0 |
| A | 7 | 243 | 131520 | 765.19 | 685 | 667 | 171.0 |
| B | 10 | 247 | 48756 | 324.82 | 691 | 665 | 148.1 |
| B | 7 | 252 | 46788 | 311.53 | 691 | 665 | 148.1 |
| B | 7 | 0 | 33340 | 220.7 | 691 | 665 | 148.1 |
| C | 12 | 252 | 166984 | 886.63 | 681 | 673 | 187.6 |
| C | 13 | 3 | 90702 | 479.96 | 681 | 673 | 187.6 |
| C | 6 | 223 | 62856 | 331.5 | 681 | 673 | 187.6 |
| D | 8 | 245 | 156451 | 806.09 | 676 | 645 | 193.3 |
| D | 3 | 12 | 123485 | 635.53 | 676 | 645 | 193.3 |
| D | 2 | 249 | 112699 | 579.73 | 676 | 645 | 193.3 |
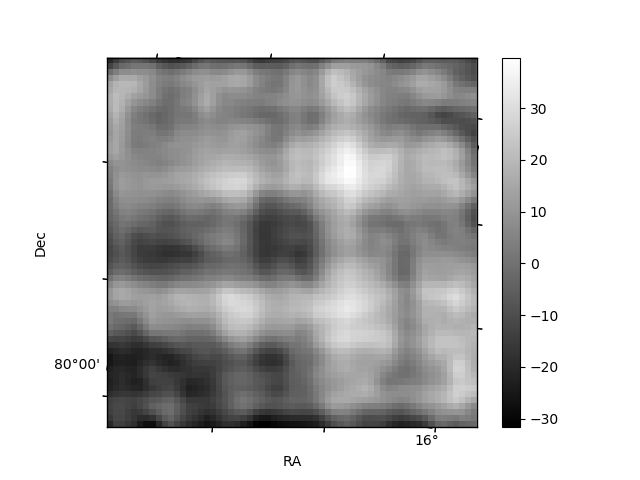
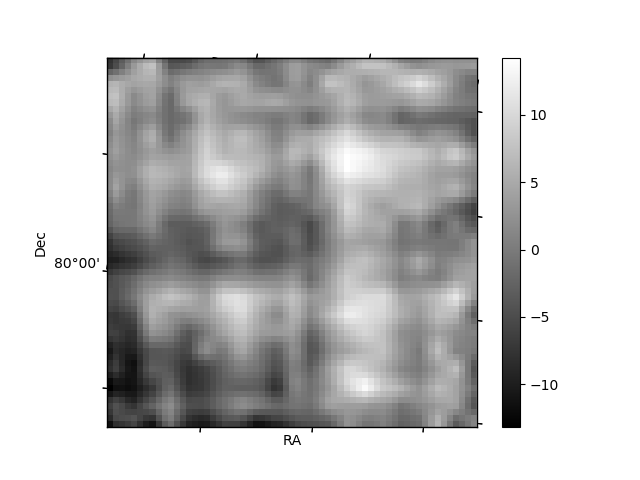
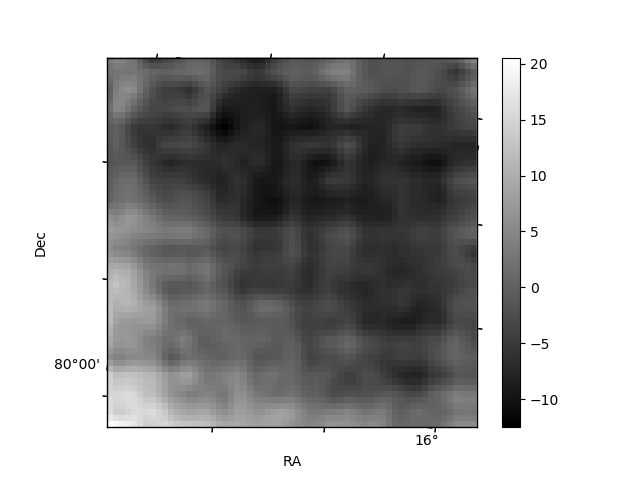
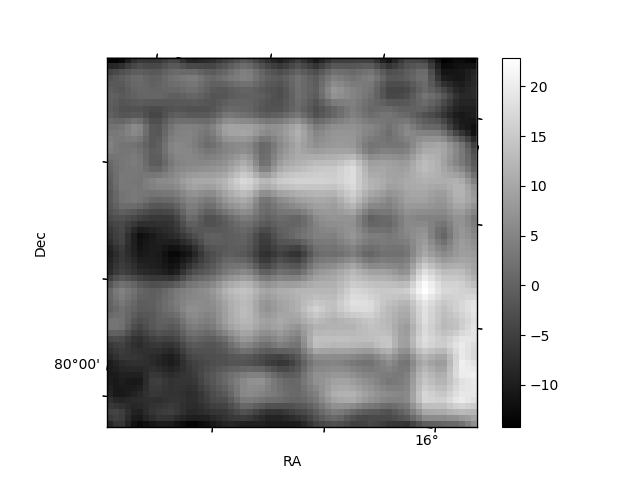
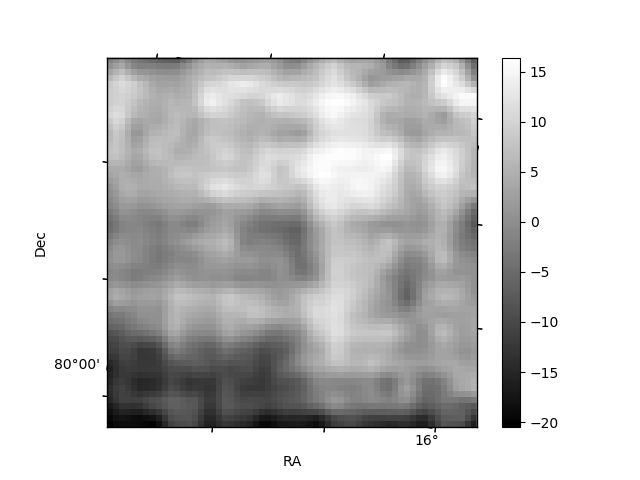
Histogram calculated using DETX and DETY for each event in the final _common_clean file
| Quadrant A | 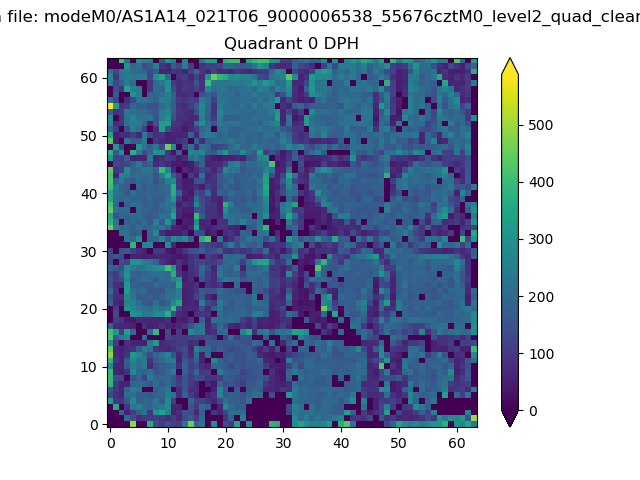 |
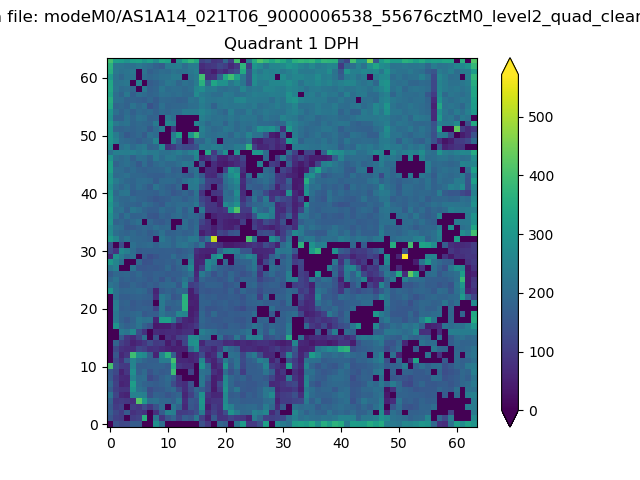 |
Quadrant B |
|---|---|---|---|
| Quadrant D | 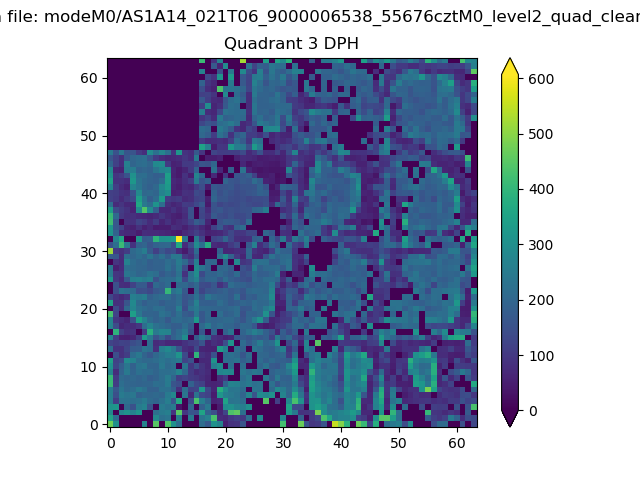 |
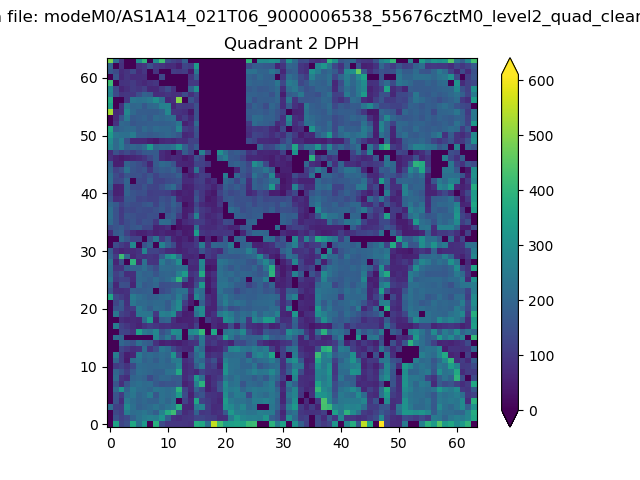 |
Quadrant C |
| Plot type | Count rate plots | Images |
|---|---|---|
| Comparison with Poisson distribution Blue bars denote a histogram of data divided into 1 sec bins. Red curve is a Poisson curve with rate = median count rate of data. |
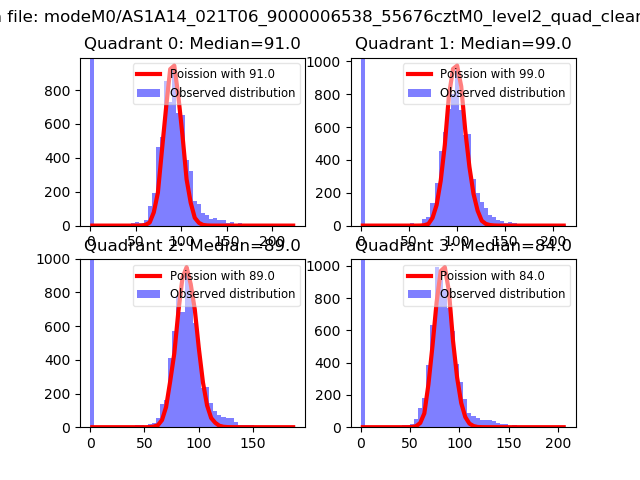 |
 |
| Quadrant-wise count rates Data is divided into 100 sec bins |
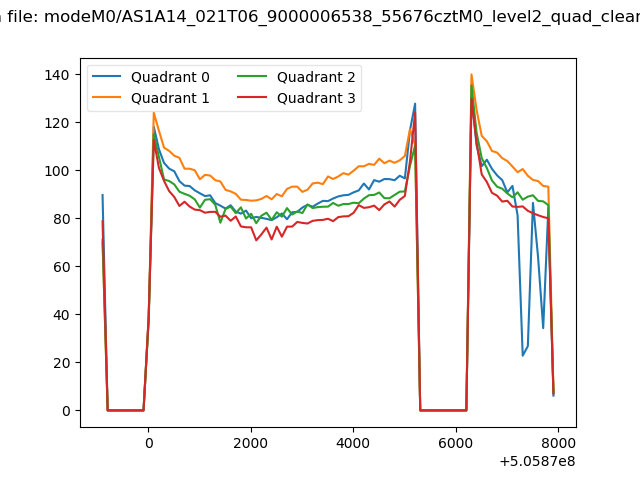 |
|
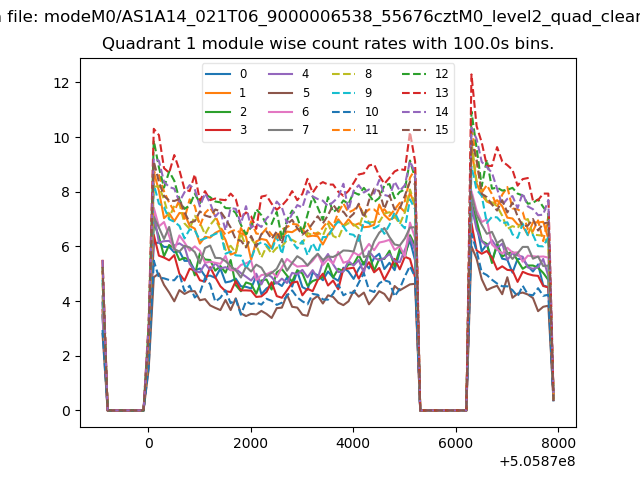
| Module-wise count rates for Quadrant A Data is divided into 100 sec bins |
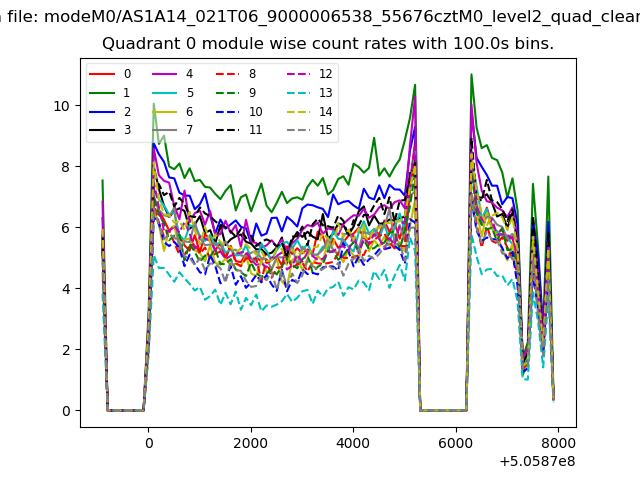 |
 |
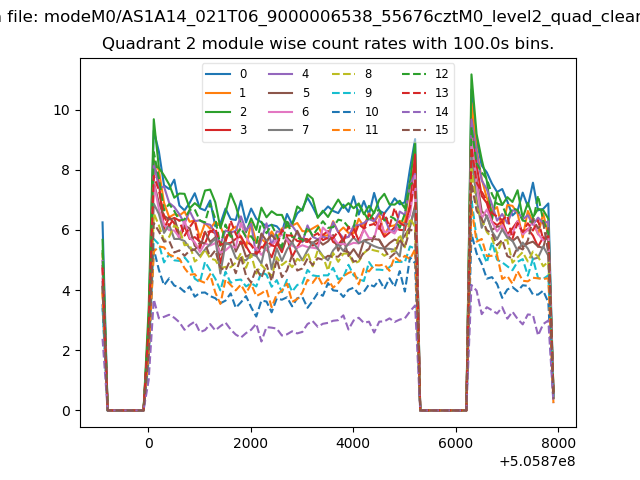
| Module-wise count rates for Quadrant B Data is divided into 100 sec bins |
 |
 |
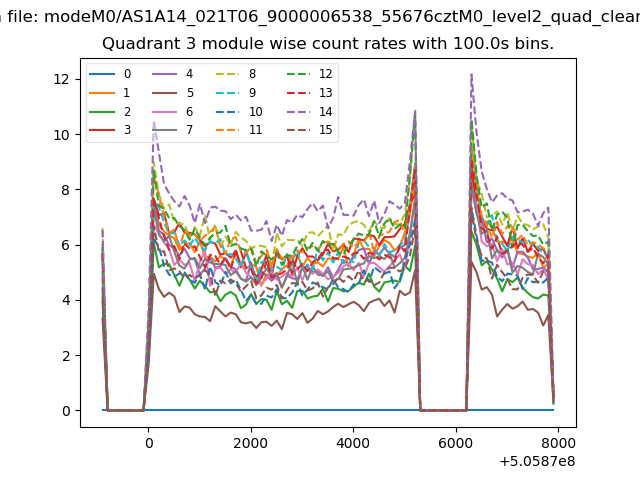
| Module-wise count rates for Quadrant C Data is divided into 100 sec bins |
 |
 |
| Module-wise count rates for Quadrant D Data is divided into 100 sec bins |
 |
 |
| Parameter | Plot |
|---|---|
| CZT HV Monitor | 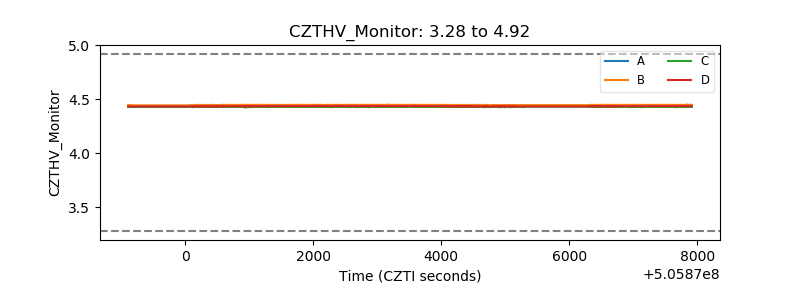 |
| D_VDD | 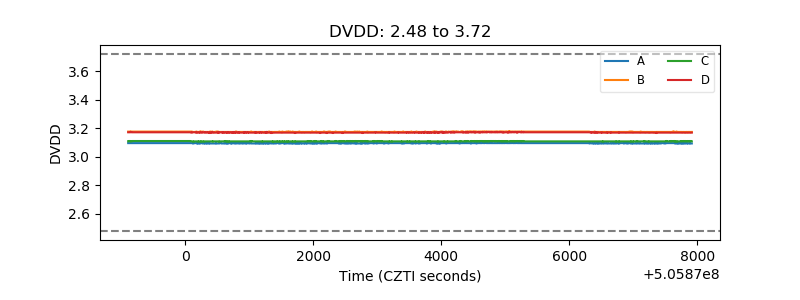 |
| Temperature 1 | 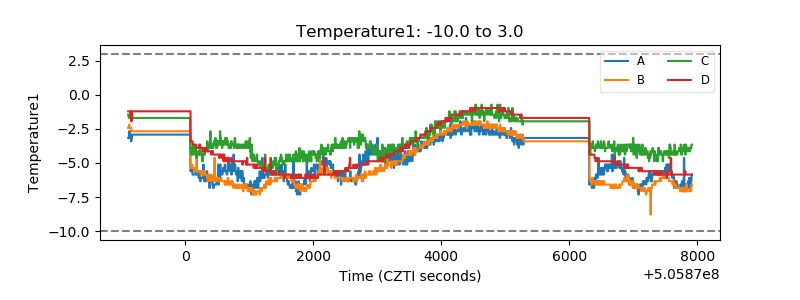 |
| Veto HV Monitor | 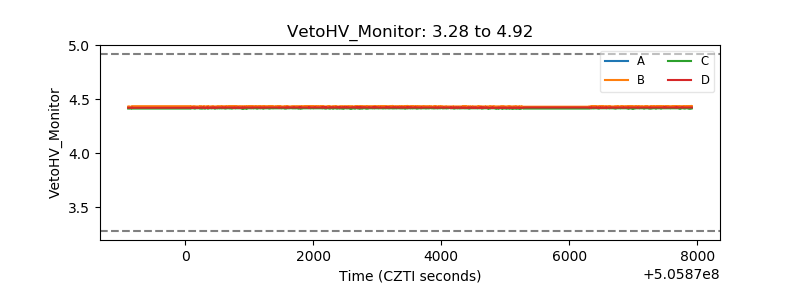 |
| Veto LLD | 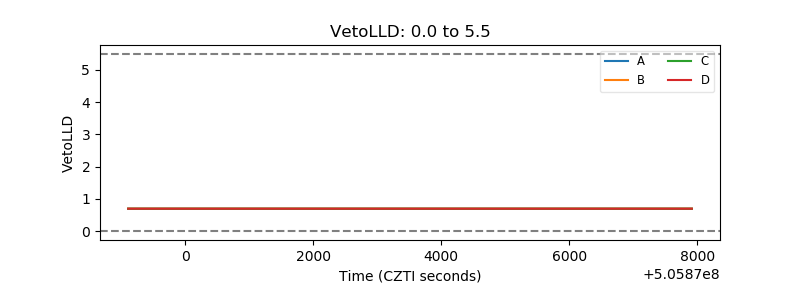 |
| Alpha Counter | 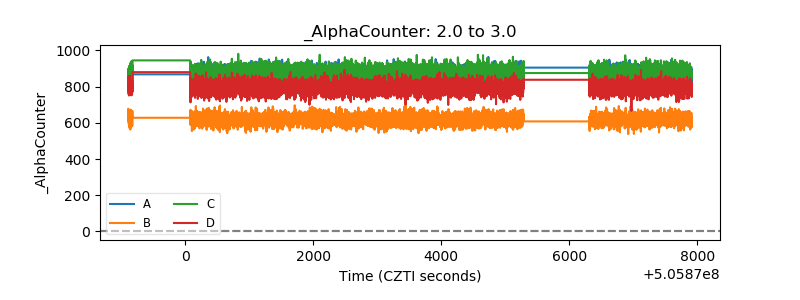 |
| _CPM_Rate | 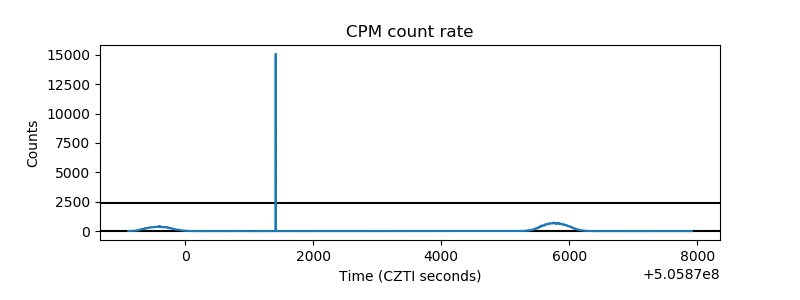 |
| CZT Counter | 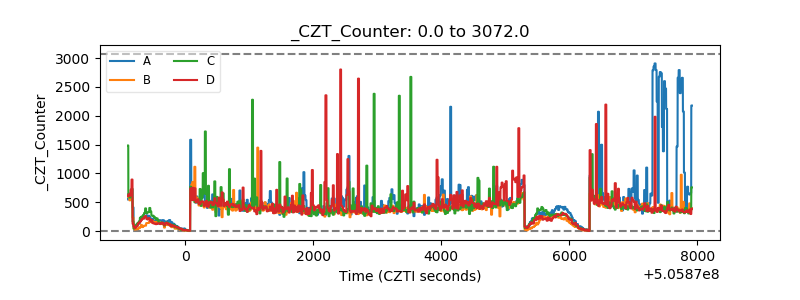 |
| +2.5 Volts monitor |  |
| +5 Volts monitor |  |
| _ROLL_ROT | 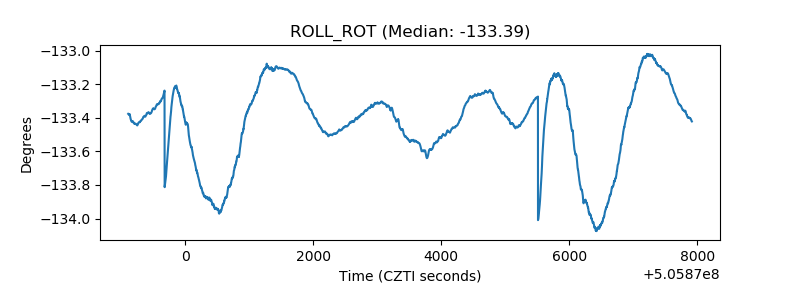 |
| _Roll_DEC | 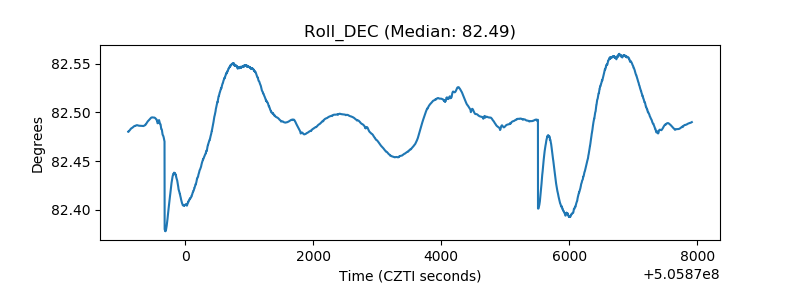 |
| _Roll_RA | 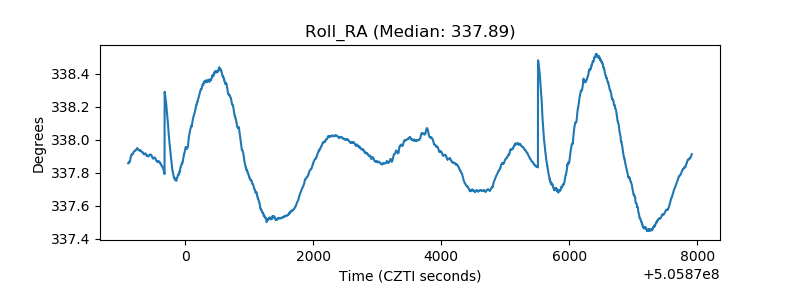 |
| Veto Counter | 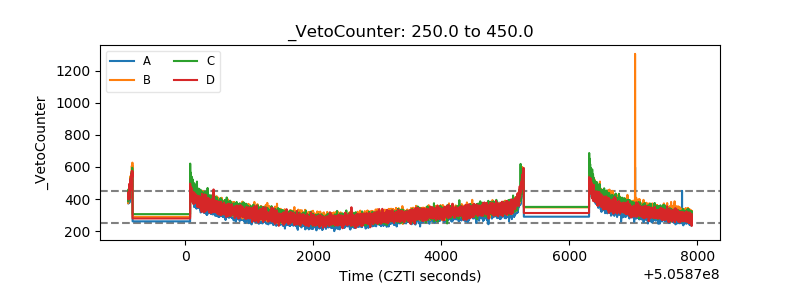 |