| Param | Original file | Final file |
|---|---|---|
| Filename | modeM0/AS1A14_099T04_9000006540cztM0_level2.fits | modeM0/AS1A14_099T04_9000006540cztM0_level2_quad_clean.evt |
| Size (bytes) | 4,240,992,960 | 1,455,632,640 |
| Size | 3.9 GB | 1.4 GB |
| Events in quadrant A | 22,683,472 | 1,400,657 |
| Events in quadrant B | 24,509,448 | 2,437,114 |
| Events in quadrant C | 24,493,662 | 2,011,378 |
| Events in quadrant D | 20,006,236 | 1,603,478 |
| Mode M0 | |||
|---|---|---|---|
| Quadrant | BADHDUFLAG | Total packets | Discarded packets |
| A | 0 | 2338040 | 0 |
| B | 0 | 1339334 | 0 |
| C | 0 | 1512279 | 0 |
| D | 0 | 2046267 | 0 |
| Mode M9 | |||
|---|---|---|---|
| Quadrant | BADHDUFLAG | Total packets | Discarded packets |
| A | 0 | 637 | 0 |
| B | 0 | 637 | 0 |
| C | 0 | 637 | 0 |
| D | 0 | 637 | 0 |
| Mode SS | |||
|---|---|---|---|
| Quadrant | BADHDUFLAG | Total packets | Discarded packets |
| A | 0 | 10836 | 0 |
| B | 0 | 10836 | 0 |
| C | 0 | 10836 | 0 |
| D | 0 | 10836 | 0 |
| Quadrant | Total seconds | Saturated seconds | Saturation percentage |
|---|---|---|---|
| A | 534324 | 141090 | 26.405327% |
| B | 534316 | 32155 | 6.017974% |
| C | 534329 | 50762 | 9.500139% |
| D | 534311 | 104682 | 19.591960% |
Noise dominated data is calculated using 1-second bins in cleaned event files. If a bin has >2000 counts, and if more than 50% of those come from <1% of pixels, then it is considered to be noise-dominated and hence unusable.
| Quadrant | # 1 sec bins | Bins with >0 counts | Bins with >2000 counts | High rate bins dominated by noise | Noise dominated (total time) | Noise dominated (detector-on time) | Marked lightcurve |
|---|---|---|---|---|---|---|---|
| A | 603066 | 529510 | 0 | 0 | 0.00% | 0.00% | 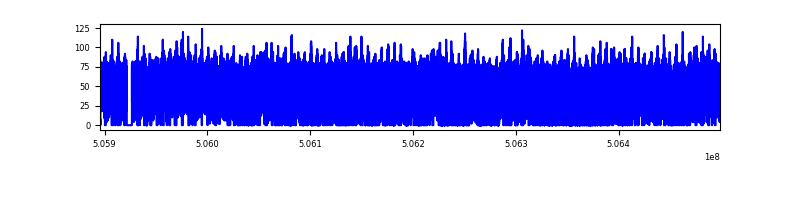 |
| B | 603067 | 534004 | 0 | 0 | 0.00% | 0.00% | 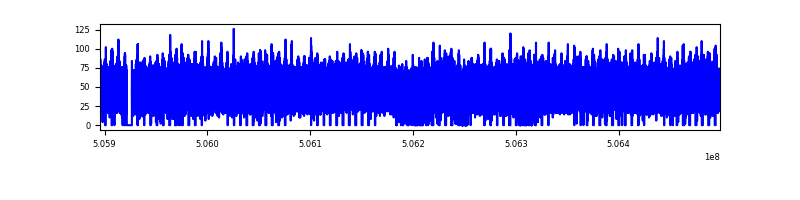 |
| C | 603067 | 528411 | 0 | 0 | 0.00% | 0.00% | 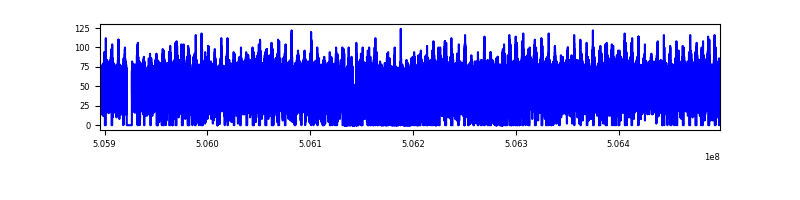 |
| D | 603067 | 528748 | 0 | 0 | 0.00% | 0.00% | 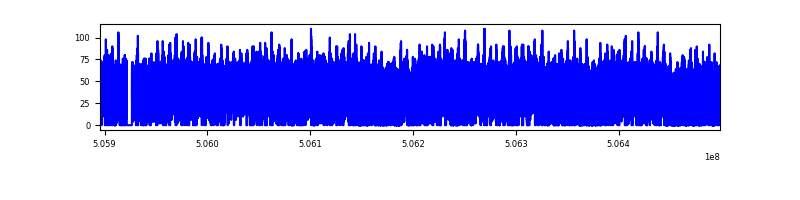 |
Top three noisy pixels from each quadrant. If the there are fewer than three noisy pixels in the level2.evt file, extra rows are filled as -1
| Pixel properties | Quadrant properties | ||||||
|---|---|---|---|---|---|---|---|
| Quadrant | DetID | PixID | Counts | Sigma | Mean | Median | Sigma |
| A | 14 | 188 | 25123 | 9.87 | 5950 | 5476 | 1990.7 |
| A | 9 | 255 | 23038 | 8.82 | 5950 | 5476 | 1990.7 |
| A | 14 | 204 | 20284 | 7.44 | 5950 | 5476 | 1990.7 |
| B | 2 | 9 | 27813 | 14.4 | 6456 | 6094 | 1508.2 |
| B | 2 | 8 | 24887 | 12.46 | 6456 | 6094 | 1508.2 |
| B | 3 | 25 | 20540 | 9.58 | 6456 | 6094 | 1508.2 |
| C | 2 | 31 | 19800 | 6.12 | 6529 | 5920 | 2266.4 |
| C | 7 | 221 | 19470 | 5.98 | 6529 | 5920 | 2266.4 |
| C | 15 | 175 | 19184 | 5.85 | 6529 | 5920 | 2266.4 |
| D | 6 | 218 | 25036 | 10.32 | 5705 | 5050 | 1936.0 |
| D | 15 | 11 | 18820 | 7.11 | 5705 | 5050 | 1936.0 |
| D | 8 | 12 | 18518 | 6.96 | 5705 | 5050 | 1936.0 |
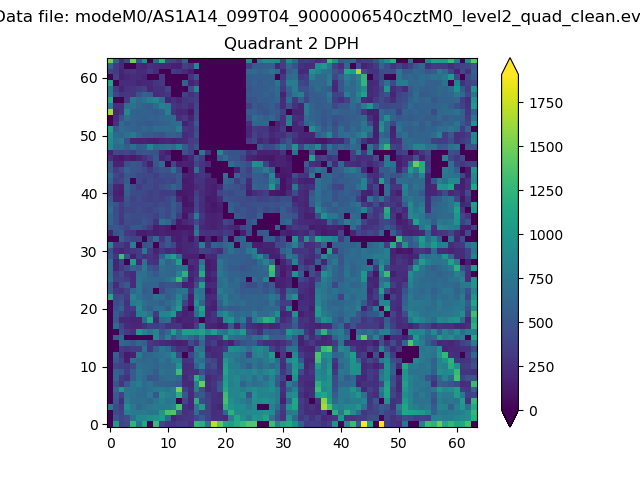
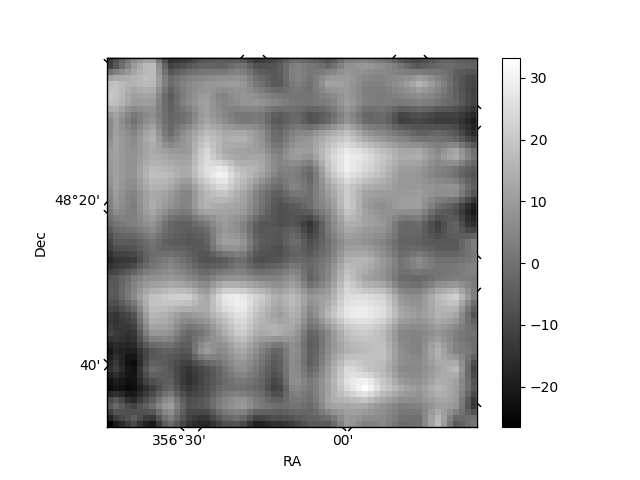
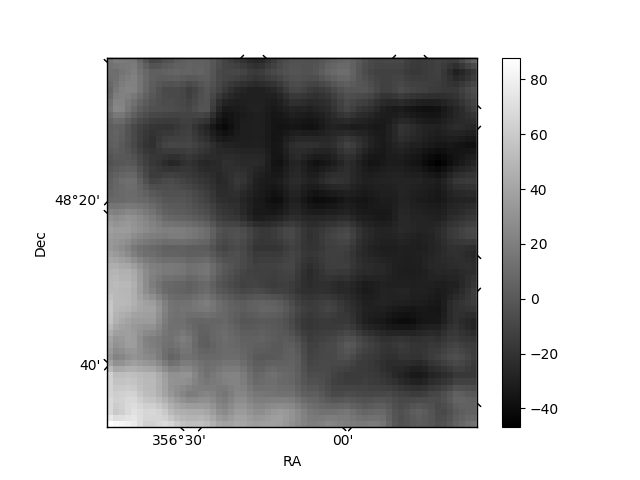
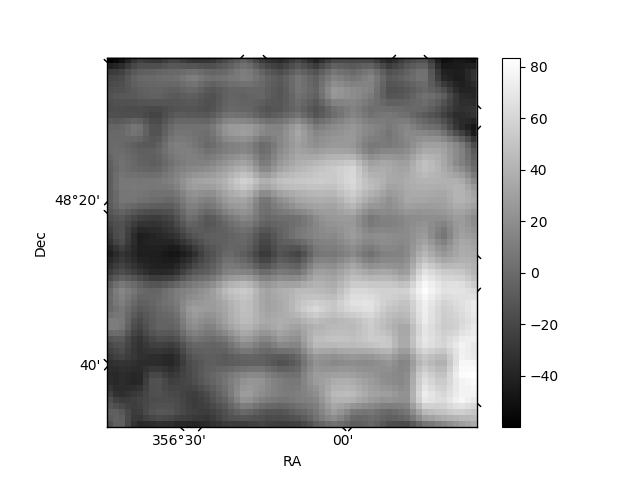
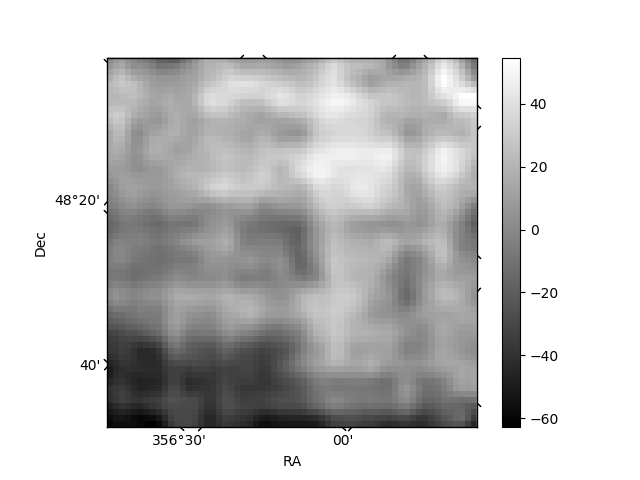
Histogram calculated using DETX and DETY for each event in the final _common_clean file
| Quadrant A | 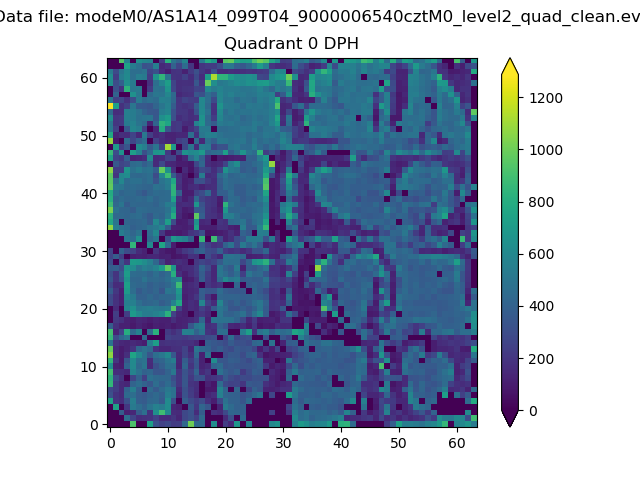 |
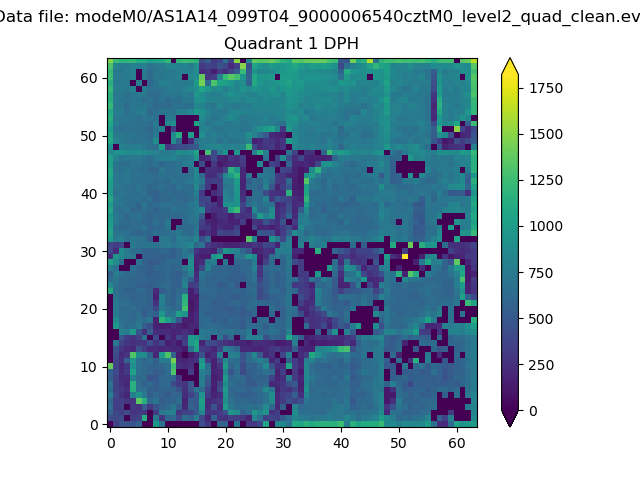 |
Quadrant B |
|---|---|---|---|
| Quadrant D | 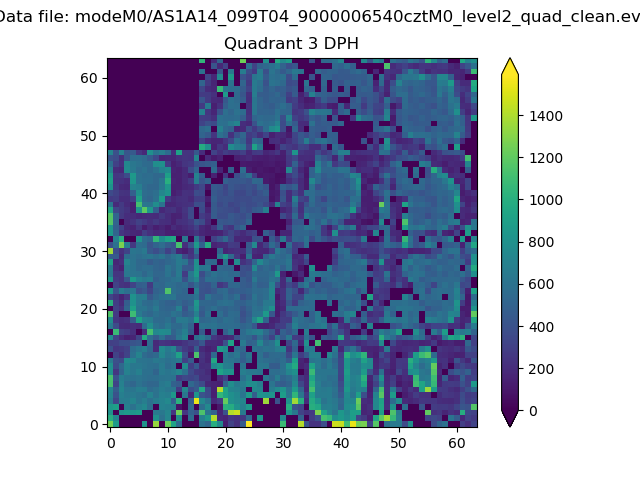 |
 |
Quadrant C |
| Plot type | Count rate plots | Images |
|---|---|---|
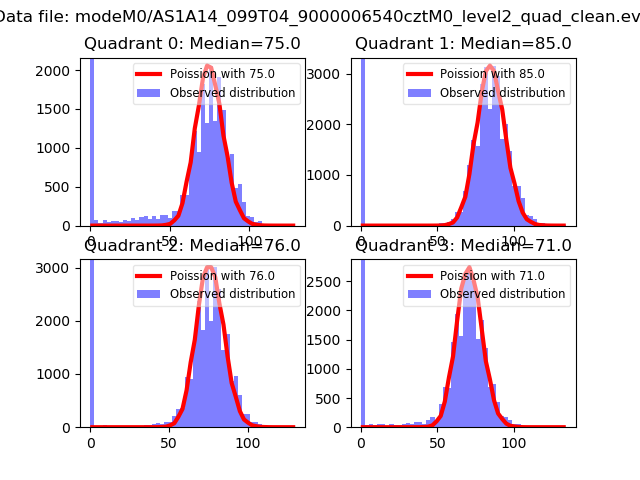
| Comparison with Poisson distribution Blue bars denote a histogram of data divided into 1 sec bins. Red curve is a Poisson curve with rate = median count rate of data. |
 |
 |
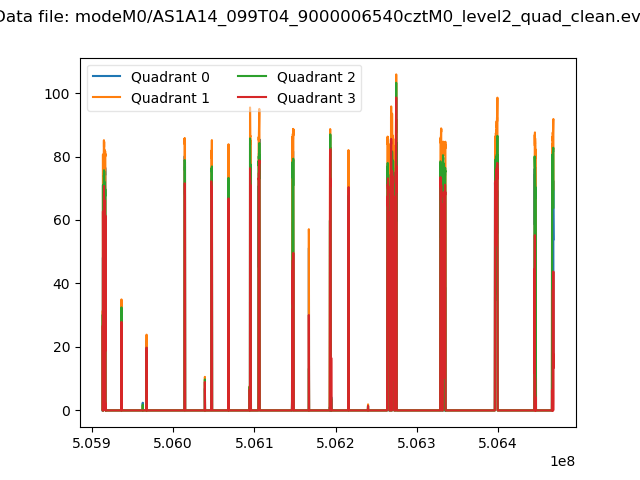
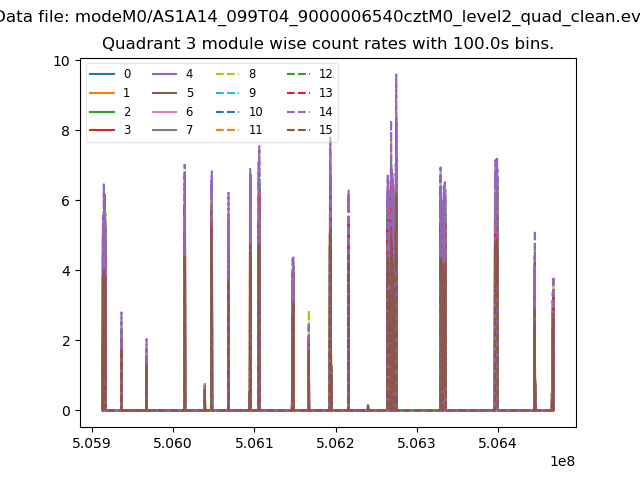
| Quadrant-wise count rates Data is divided into 100 sec bins |
 |
|
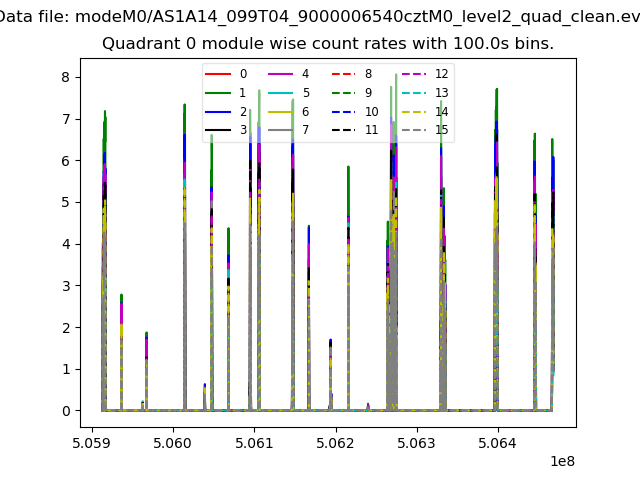
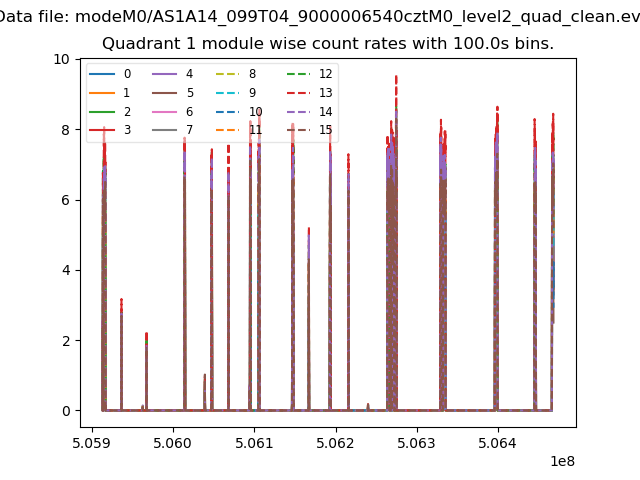
| Module-wise count rates for Quadrant A Data is divided into 100 sec bins |
 |
 |
| Module-wise count rates for Quadrant B Data is divided into 100 sec bins |
 |
 |
| Module-wise count rates for Quadrant C Data is divided into 100 sec bins |
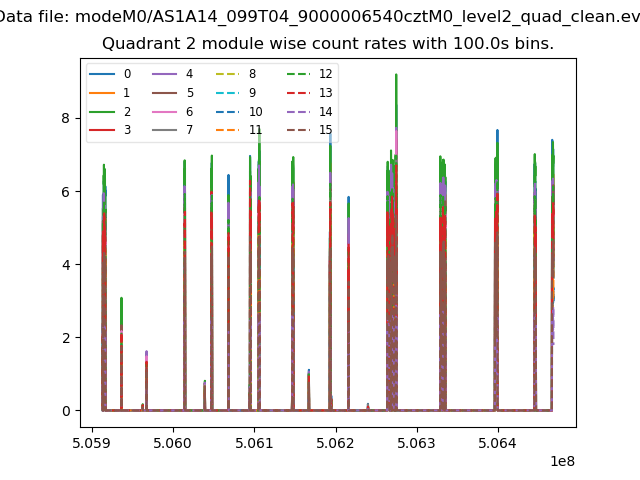 |
 |
| Module-wise count rates for Quadrant D Data is divided into 100 sec bins |
 |
 |
| Parameter | Plot |
|---|---|
| CZT HV Monitor | 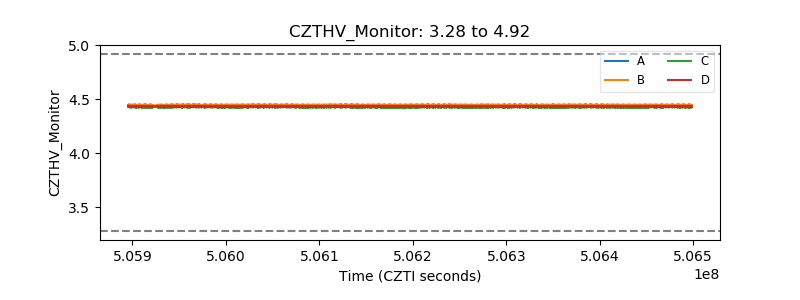 |
| D_VDD | 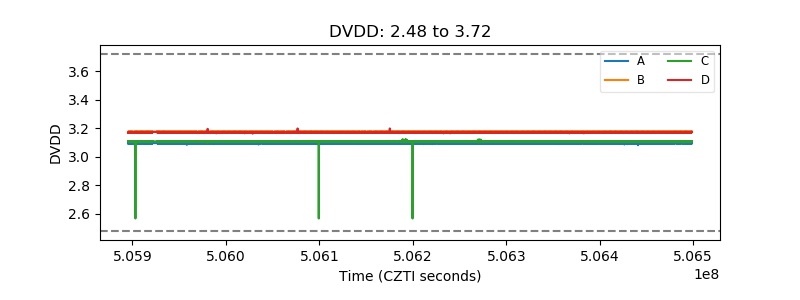 |
| Temperature 1 | 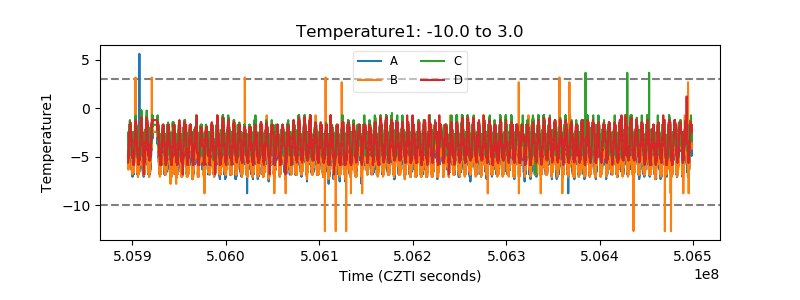 |
| Veto HV Monitor | 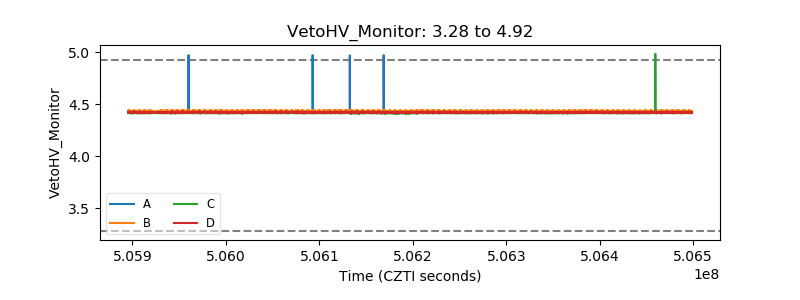 |
| Veto LLD | 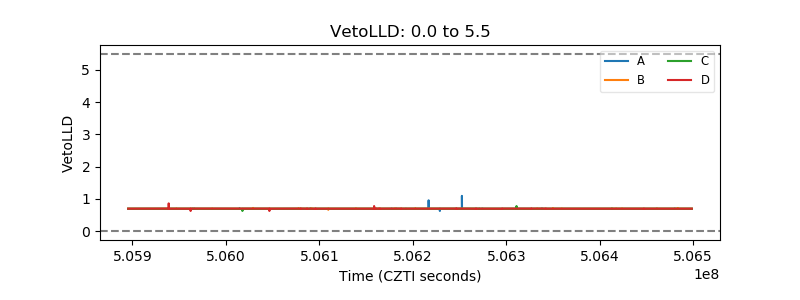 |
| Alpha Counter | 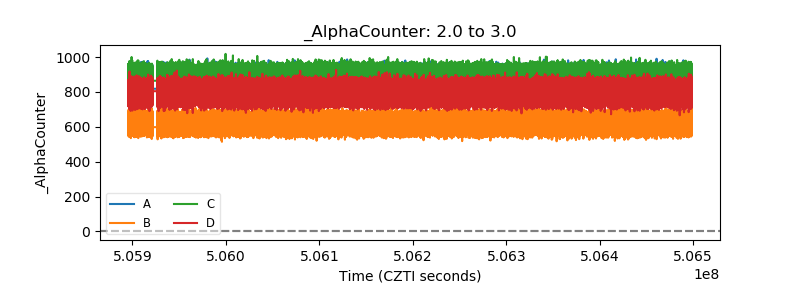 |
| _CPM_Rate | 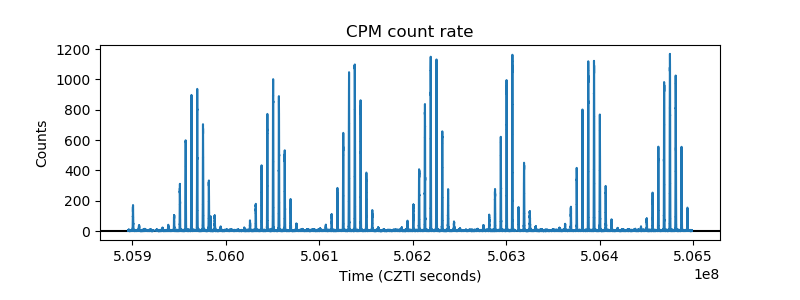 |
| CZT Counter | 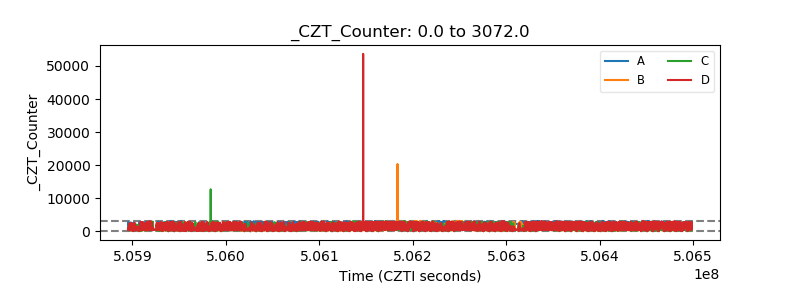 |
| +2.5 Volts monitor | 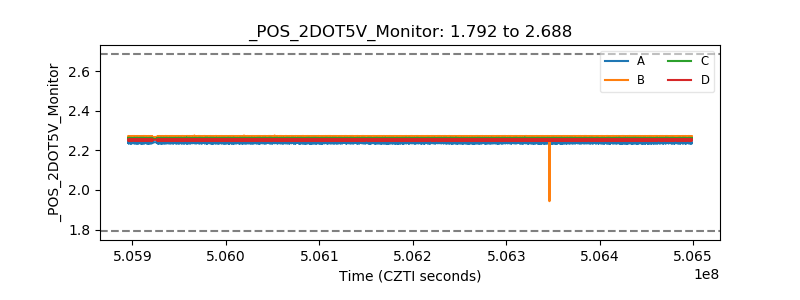 |
| +5 Volts monitor | 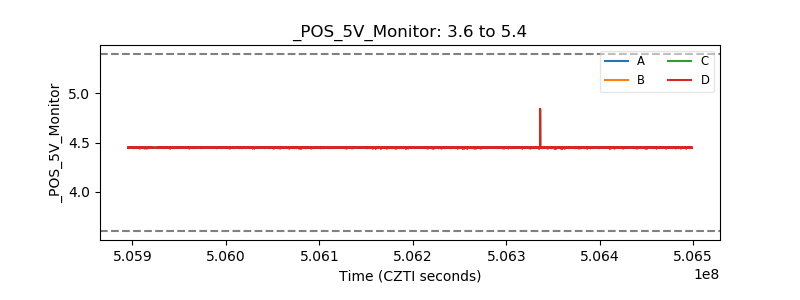 |
| _ROLL_ROT | 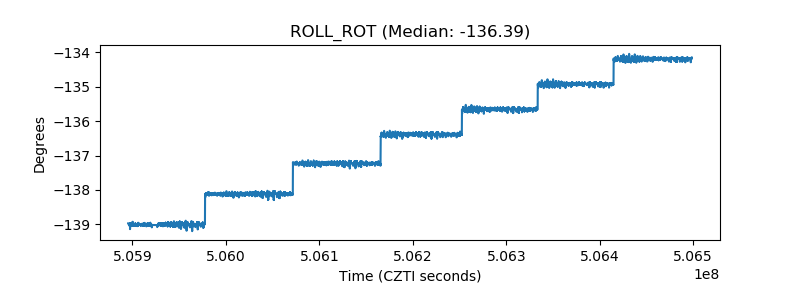 |
| _Roll_DEC | 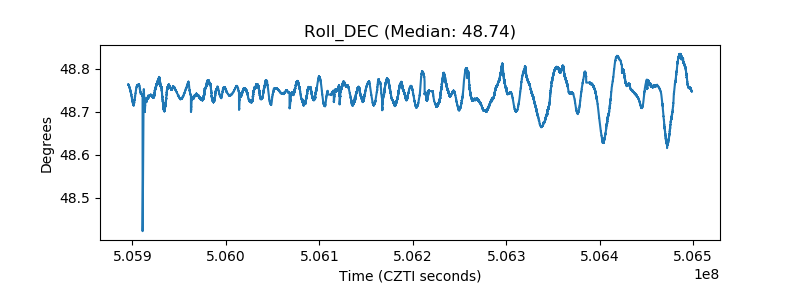 |
| _Roll_RA | 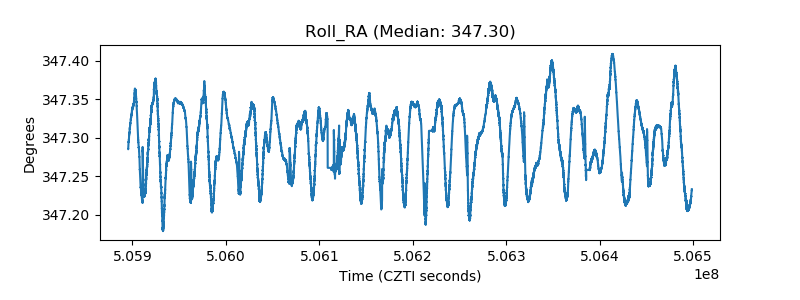 |
| Veto Counter | 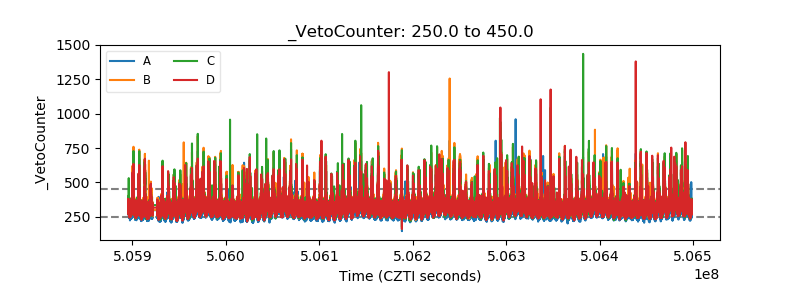 |