| Param | Original file | Final file |
|---|---|---|
| Filename | modeM0/AS1A14_099T04_9000006540_55680cztM0_level2.fits | modeM0/AS1A14_099T04_9000006540_55680cztM0_level2_quad_clean.evt |
| Size (bytes) | 397,056,960 | 88,358,400 |
| Size | 378.7 MB | 84.3 MB |
| Events in quadrant A | 4,815,440 | 538,043 |
| Events in quadrant B | 2,751,117 | 619,524 |
| Events in quadrant C | 2,948,742 | 563,585 |
| Events in quadrant D | 3,697,151 | 519,518 |
| Mode M0 | |||
|---|---|---|---|
| Quadrant | BADHDUFLAG | Total packets | Discarded packets |
| A | 0 | 18804 | 1 |
| B | 0 | 13117 | 1 |
| C | 0 | 13674 | 1 |
| D | 0 | 15446 | 2 |
| Mode M9 | |||
|---|---|---|---|
| Quadrant | BADHDUFLAG | Total packets | Discarded packets |
| A | 0 | 10 | 0 |
| B | 0 | 10 | 0 |
| C | 0 | 10 | 0 |
| D | 0 | 10 | 0 |
| Mode SS | |||
|---|---|---|---|
| Quadrant | BADHDUFLAG | Total packets | Discarded packets |
| A | 0 | 126 | 0 |
| B | 0 | 126 | 0 |
| C | 0 | 126 | 0 |
| D | 0 | 126 | 0 |
| Quadrant | Total seconds | Saturated seconds | Saturation percentage |
|---|---|---|---|
| A | 6232 | 562 | 9.017972% |
| B | 6233 | 133 | 2.133804% |
| C | 6233 | 67 | 1.074924% |
| D | 6232 | 172 | 2.759949% |
Noise dominated data is calculated using 1-second bins in cleaned event files. If a bin has >2000 counts, and if more than 50% of those come from <1% of pixels, then it is considered to be noise-dominated and hence unusable.
| Quadrant | # 1 sec bins | Bins with >0 counts | Bins with >2000 counts | High rate bins dominated by noise | Noise dominated (total time) | Noise dominated (detector-on time) | Marked lightcurve |
|---|---|---|---|---|---|---|---|
| A | 7207 | 6233 | 392 | 392 | 5.44% | 6.29% | 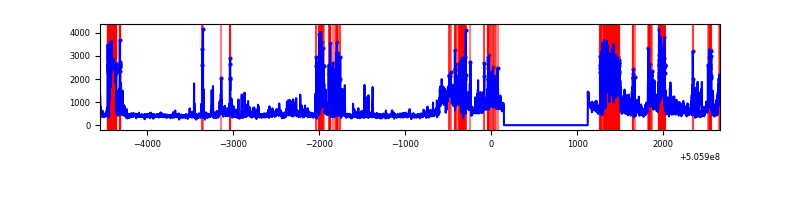 |
| B | 7208 | 6234 | 15 | 15 | 0.21% | 0.24% | 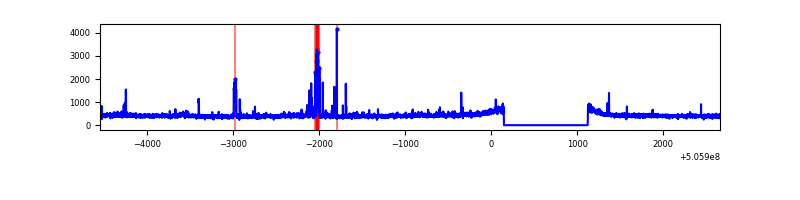 |
| C | 7208 | 6234 | 31 | 31 | 0.43% | 0.50% | 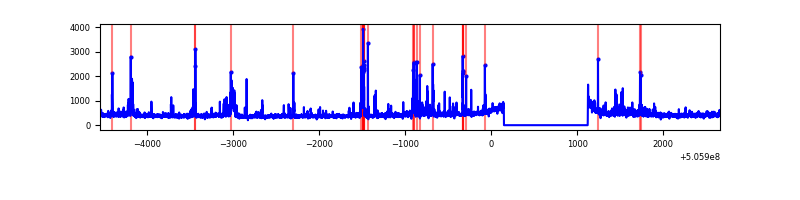 |
| D | 7207 | 6233 | 111 | 111 | 1.54% | 1.78% | 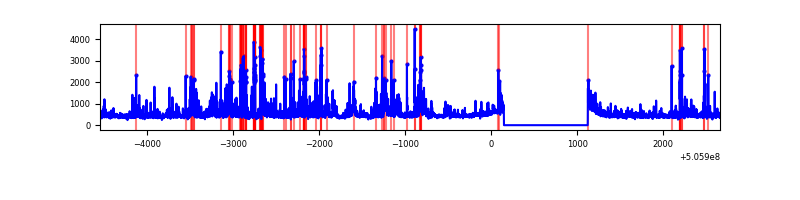 |
Top three noisy pixels from each quadrant. If the there are fewer than three noisy pixels in the level2.evt file, extra rows are filled as -1
| Pixel properties | Quadrant properties | ||||||
|---|---|---|---|---|---|---|---|
| Quadrant | DetID | PixID | Counts | Sigma | Mean | Median | Sigma |
| A | 12 | 115 | 1163741 | 7482.55 | 628 | 612 | 155.4 |
| A | 0 | 8 | 469943 | 3019.26 | 628 | 612 | 155.4 |
| A | 15 | 32 | 340155 | 2184.32 | 628 | 612 | 155.4 |
| B | 0 | 171 | 94609 | 679.3 | 641 | 616 | 138.4 |
| B | 5 | 172 | 88172 | 632.78 | 641 | 616 | 138.4 |
| B | 12 | 111 | 16829 | 117.17 | 641 | 616 | 138.4 |
| C | 10 | 19 | 169032 | 967.67 | 629 | 623 | 174.0 |
| C | 9 | 38 | 136256 | 779.34 | 629 | 623 | 174.0 |
| C | 13 | 3 | 58381 | 331.88 | 629 | 623 | 174.0 |
| D | 11 | 129 | 811766 | 4613.03 | 624 | 598 | 175.8 |
| D | 15 | 234 | 201680 | 1143.53 | 624 | 598 | 175.8 |
| D | 10 | 181 | 135153 | 765.2 | 624 | 598 | 175.8 |
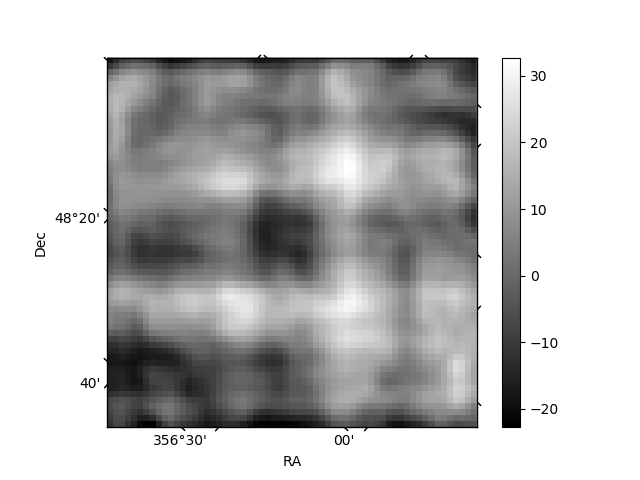
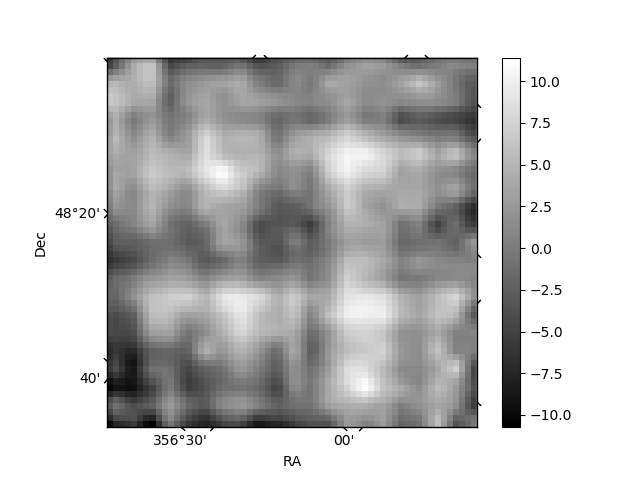
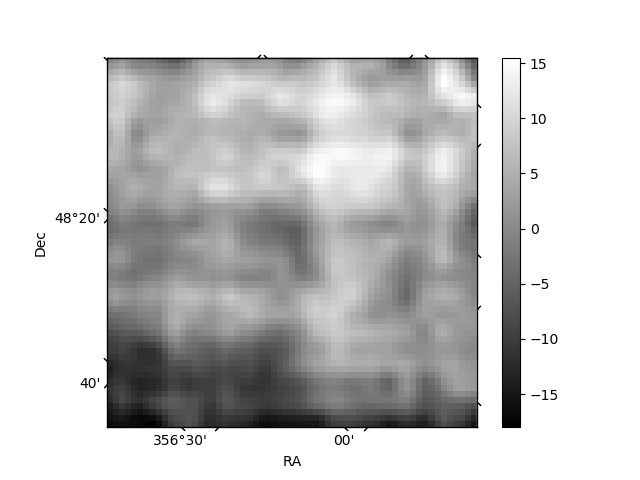
Histogram calculated using DETX and DETY for each event in the final _common_clean file
| Quadrant A | 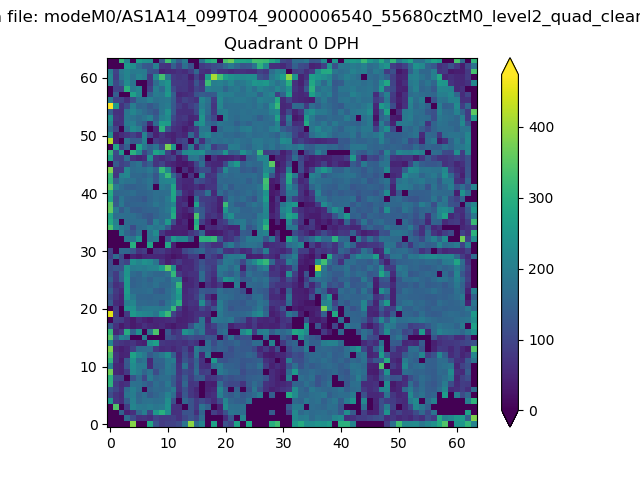 |
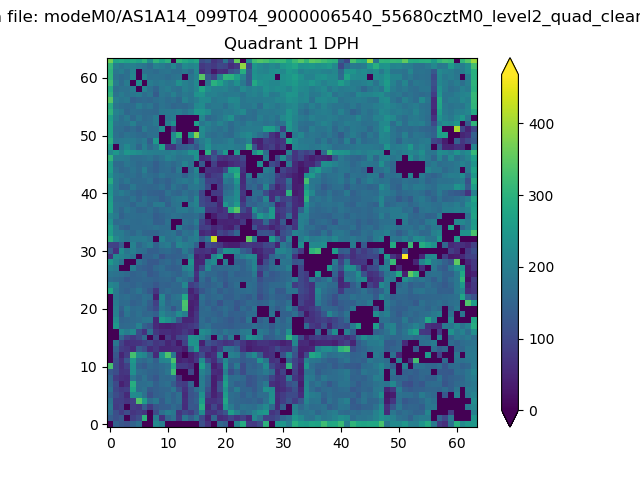 |
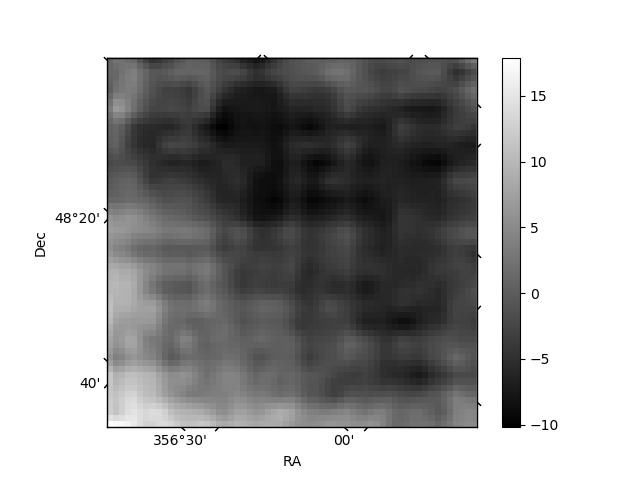
Quadrant B |
|---|---|---|---|
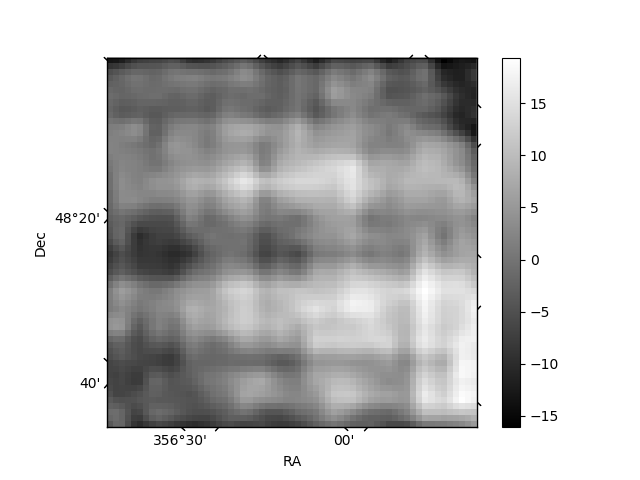
| Quadrant D | 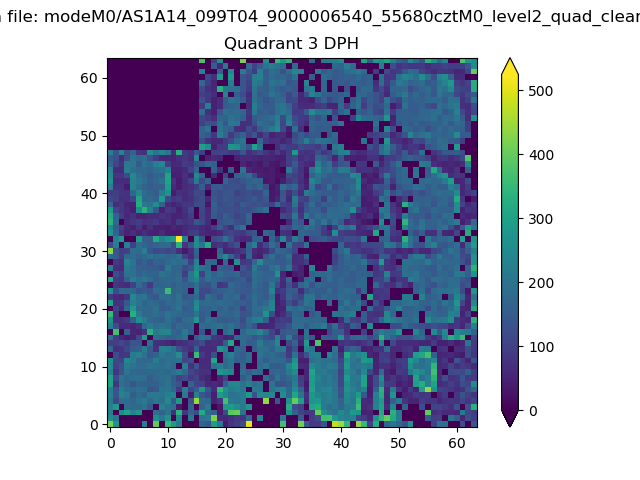 |
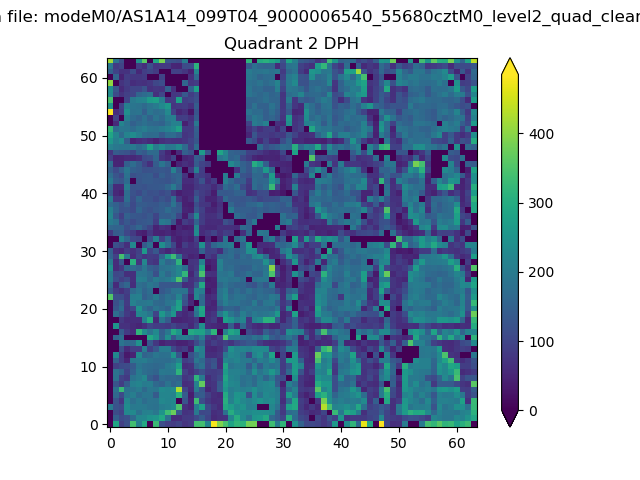 |
Quadrant C |
| Plot type | Count rate plots | Images |
|---|---|---|
| Comparison with Poisson distribution Blue bars denote a histogram of data divided into 1 sec bins. Red curve is a Poisson curve with rate = median count rate of data. |
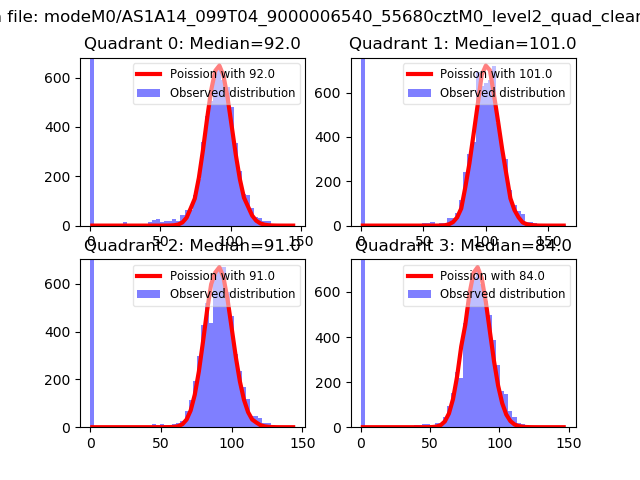 |
 |
| Quadrant-wise count rates Data is divided into 100 sec bins |
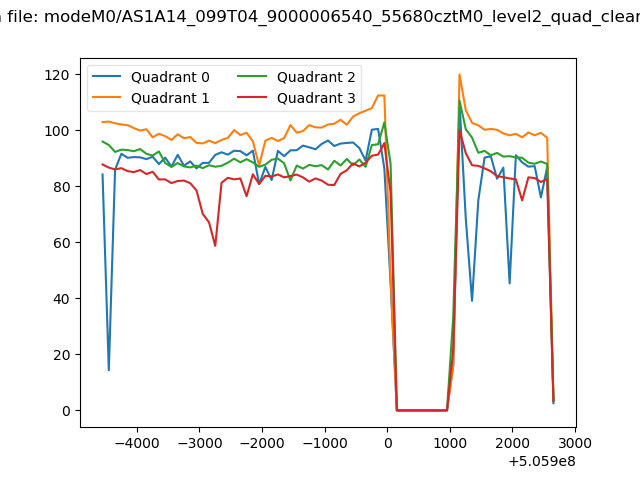 |
|
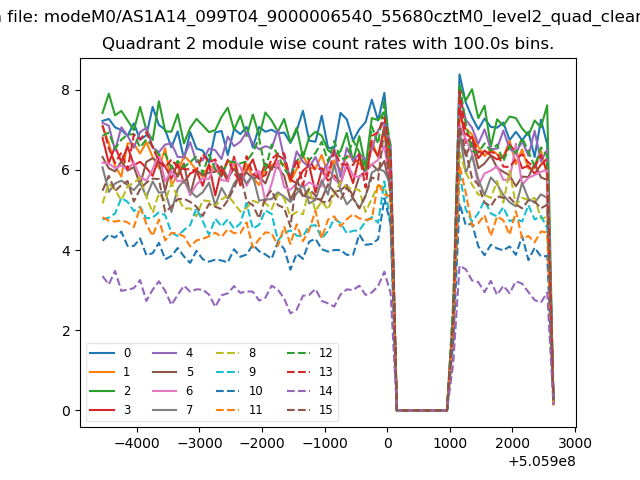
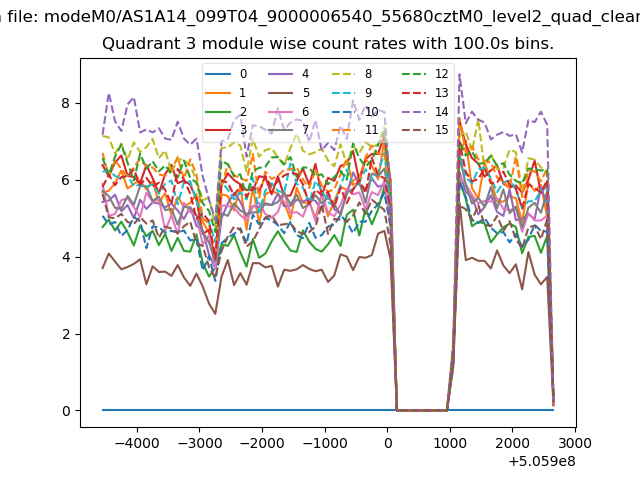
| Module-wise count rates for Quadrant A Data is divided into 100 sec bins |
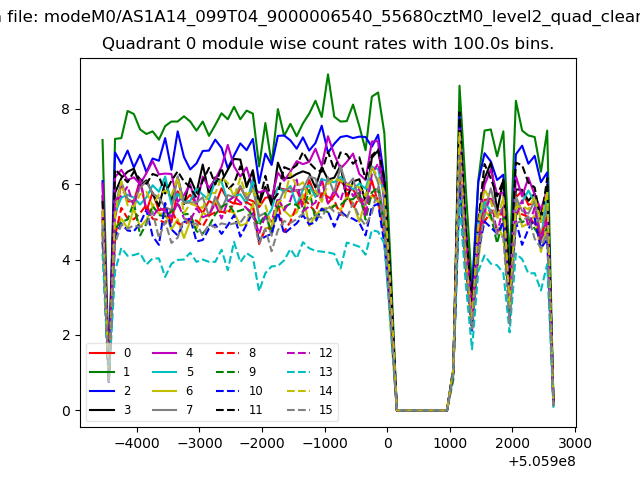 |
 |
| Module-wise count rates for Quadrant B Data is divided into 100 sec bins |
 |
 |
| Module-wise count rates for Quadrant C Data is divided into 100 sec bins |
 |
 |
| Module-wise count rates for Quadrant D Data is divided into 100 sec bins |
 |
 |
| Parameter | Plot |
|---|---|
| CZT HV Monitor | 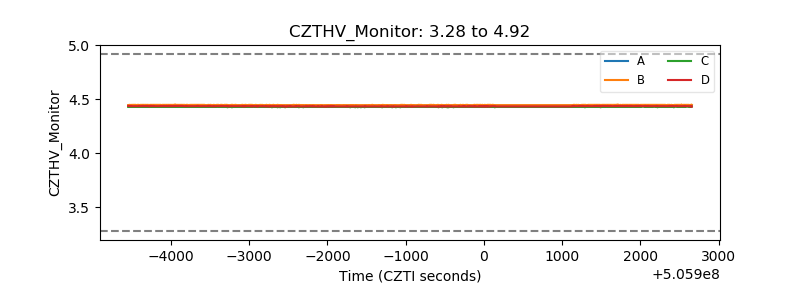 |
| D_VDD | 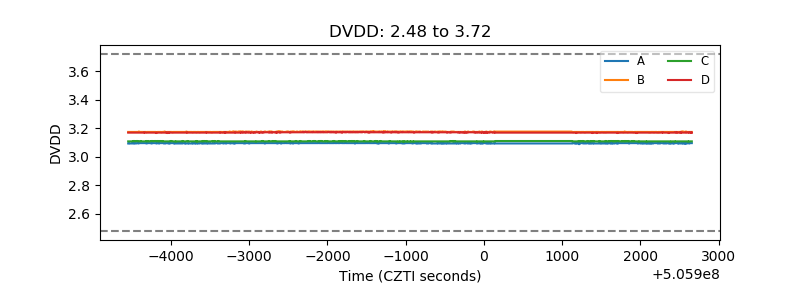 |
| Temperature 1 | 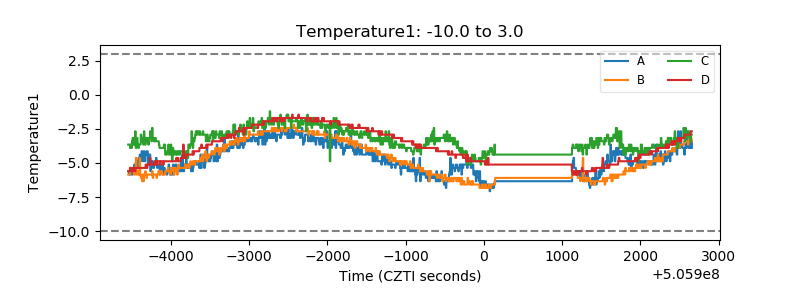 |
| Veto HV Monitor | 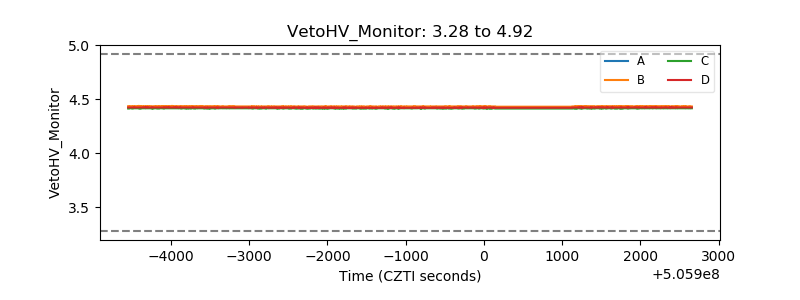 |
| Veto LLD | 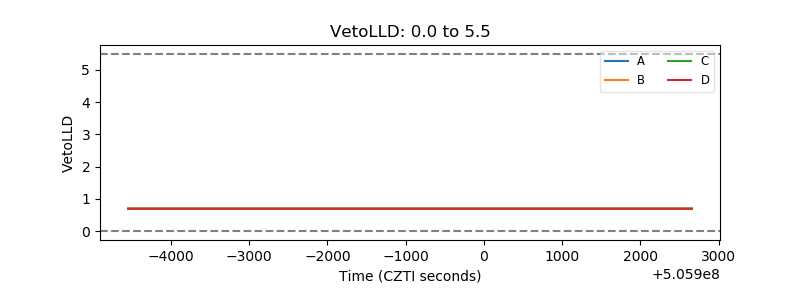 |
| Alpha Counter | 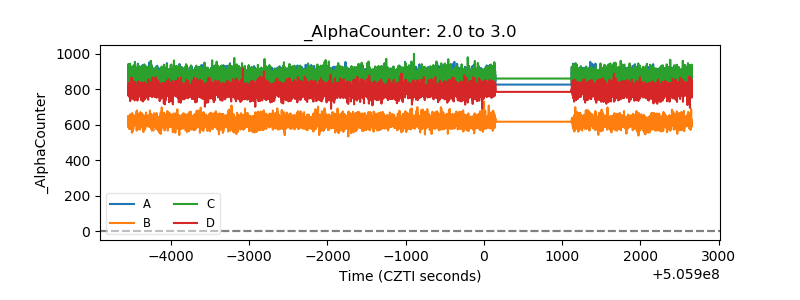 |
| _CPM_Rate | 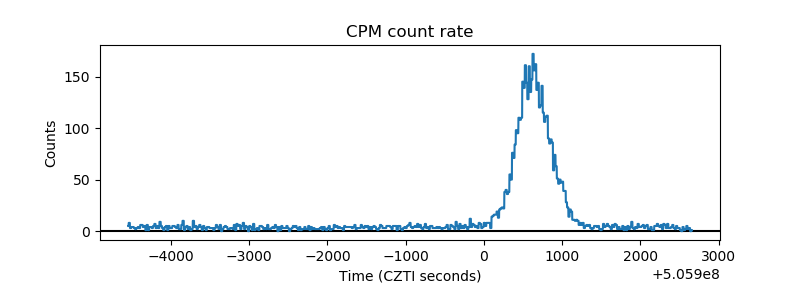 |
| CZT Counter | 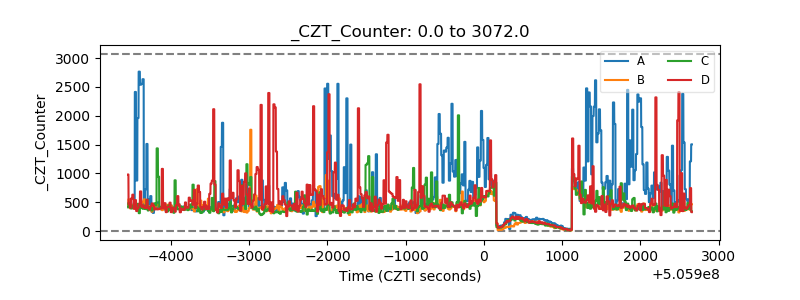 |
| +2.5 Volts monitor |  |
| +5 Volts monitor |  |
| _ROLL_ROT | 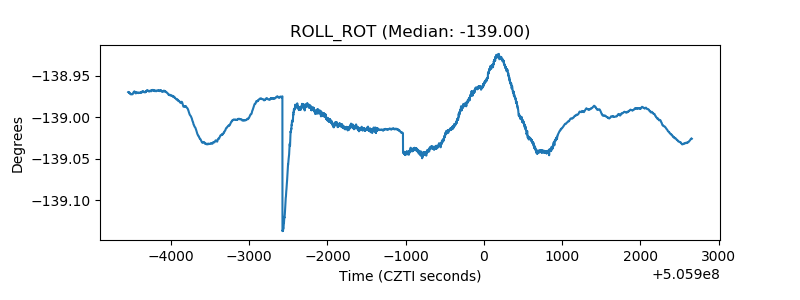 |
| _Roll_DEC | 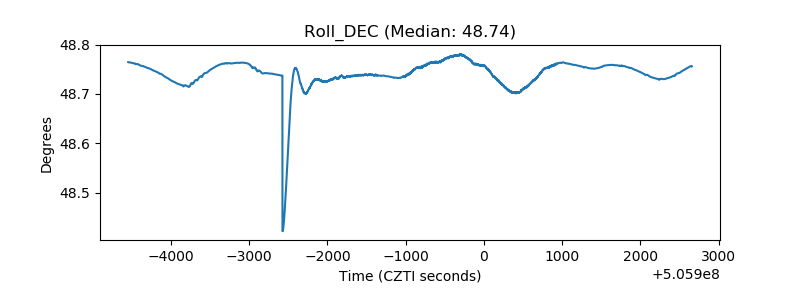 |
| _Roll_RA | 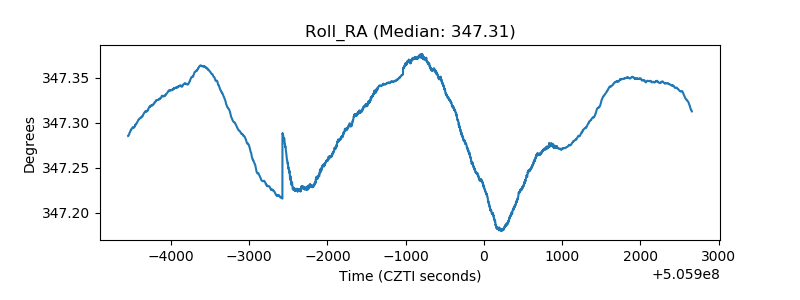 |
| Veto Counter | 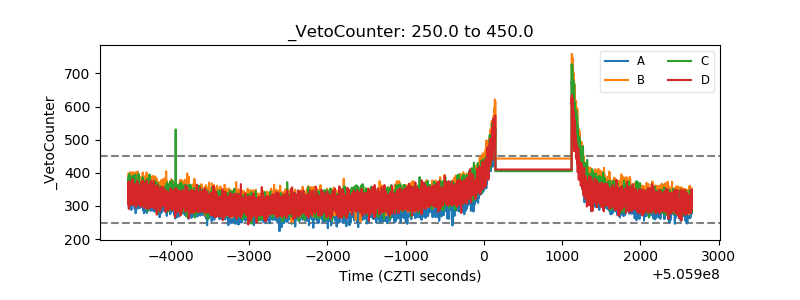 |