| Param | Original file | Final file |
|---|---|---|
| Filename | modeM0/AS1A14_099T04_9000006540_55681cztM0_level2.fits | modeM0/AS1A14_099T04_9000006540_55681cztM0_level2_quad_clean.evt |
| Size (bytes) | 427,809,600 | 88,404,480 |
| Size | 408.0 MB | 84.3 MB |
| Events in quadrant A | 5,219,591 | 524,255 |
| Events in quadrant B | 2,654,797 | 626,123 |
| Events in quadrant C | 2,938,946 | 565,850 |
| Events in quadrant D | 4,528,612 | 517,014 |
| Mode M0 | |||
|---|---|---|---|
| Quadrant | BADHDUFLAG | Total packets | Discarded packets |
| A | 0 | 20133 | 1 |
| B | 0 | 13102 | 4 |
| C | 0 | 13615 | 1 |
| D | 0 | 17975 | 1 |
| Mode M9 | |||
|---|---|---|---|
| Quadrant | BADHDUFLAG | Total packets | Discarded packets |
| A | 0 | 7 | 0 |
| B | 0 | 7 | 0 |
| C | 0 | 7 | 0 |
| D | 0 | 7 | 0 |
| Mode SS | |||
|---|---|---|---|
| Quadrant | BADHDUFLAG | Total packets | Discarded packets |
| A | 0 | 130 | 0 |
| B | 0 | 130 | 0 |
| C | 0 | 130 | 0 |
| D | 0 | 130 | 0 |
| Quadrant | Total seconds | Saturated seconds | Saturation percentage |
|---|---|---|---|
| A | 6353 | 762 | 11.994333% |
| B | 6351 | 65 | 1.023461% |
| C | 6354 | 24 | 0.377715% |
| D | 6354 | 244 | 3.840101% |
Noise dominated data is calculated using 1-second bins in cleaned event files. If a bin has >2000 counts, and if more than 50% of those come from <1% of pixels, then it is considered to be noise-dominated and hence unusable.
| Quadrant | # 1 sec bins | Bins with >0 counts | Bins with >2000 counts | High rate bins dominated by noise | Noise dominated (total time) | Noise dominated (detector-on time) | Marked lightcurve |
|---|---|---|---|---|---|---|---|
| A | 7073 | 6354 | 649 | 649 | 9.18% | 10.21% | 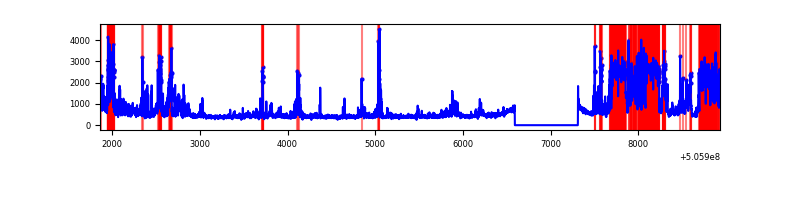 |
| B | 7073 | 6353 | 2 | 2 | 0.03% | 0.03% | 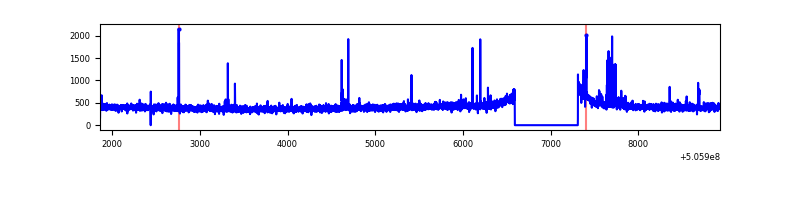 |
| C | 7074 | 6355 | 18 | 18 | 0.25% | 0.28% | 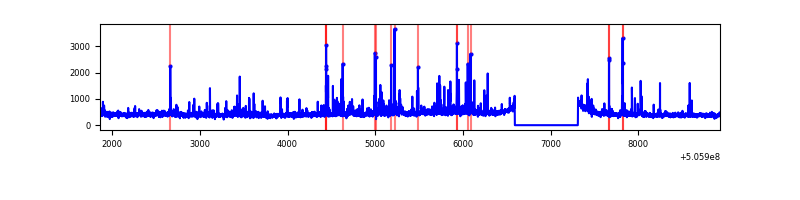 |
| D | 7074 | 6355 | 219 | 219 | 3.10% | 3.45% | 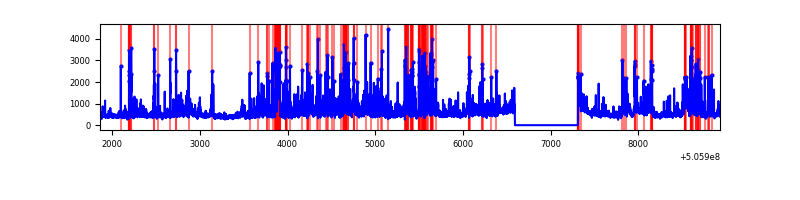 |
Top three noisy pixels from each quadrant. If the there are fewer than three noisy pixels in the level2.evt file, extra rows are filled as -1
| Pixel properties | Quadrant properties | ||||||
|---|---|---|---|---|---|---|---|
| Quadrant | DetID | PixID | Counts | Sigma | Mean | Median | Sigma |
| A | 12 | 115 | 2198537 | 13999.54 | 629 | 614 | 157.0 |
| A | 7 | 64 | 211874 | 1345.61 | 629 | 614 | 157.0 |
| A | 0 | 8 | 136498 | 865.51 | 629 | 614 | 157.0 |
| B | 5 | 172 | 63884 | 455.37 | 643 | 620 | 138.9 |
| B | 12 | 111 | 16994 | 117.86 | 643 | 620 | 138.9 |
| B | 11 | 111 | 15916 | 110.1 | 643 | 620 | 138.9 |
| C | 9 | 38 | 228843 | 1307.26 | 633 | 627 | 174.6 |
| C | 12 | 252 | 60847 | 344.95 | 633 | 627 | 174.6 |
| C | 3 | 248 | 54661 | 309.52 | 633 | 627 | 174.6 |
| D | 11 | 129 | 1357501 | 7662.26 | 624 | 596 | 177.1 |
| D | 10 | 181 | 369970 | 2085.81 | 624 | 596 | 177.1 |
| D | 2 | 62 | 112279 | 630.66 | 624 | 596 | 177.1 |
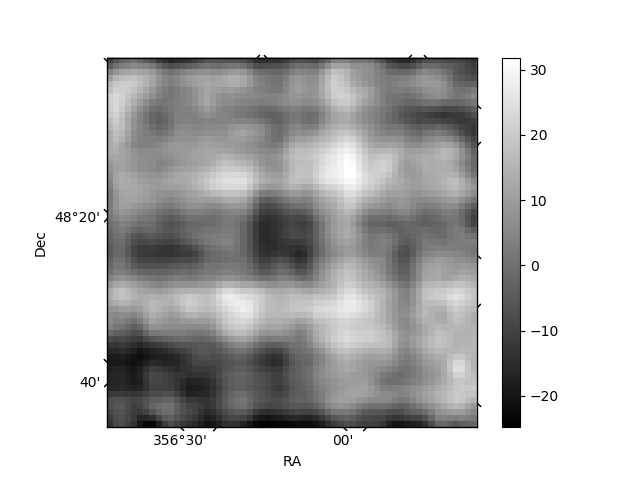
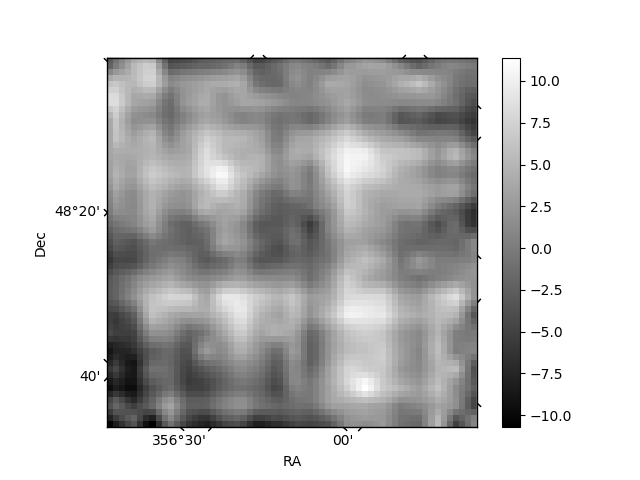
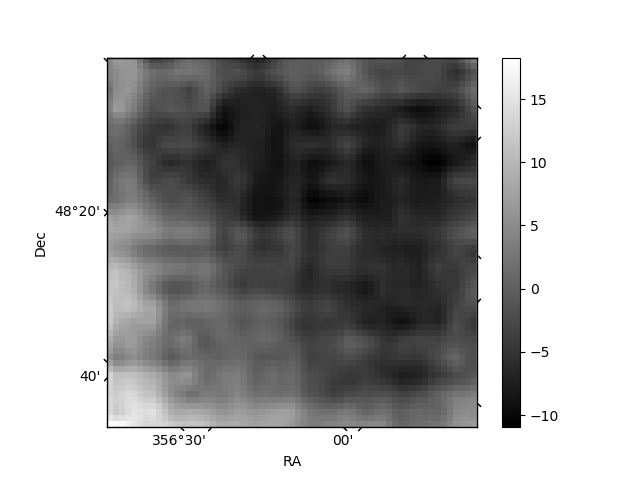
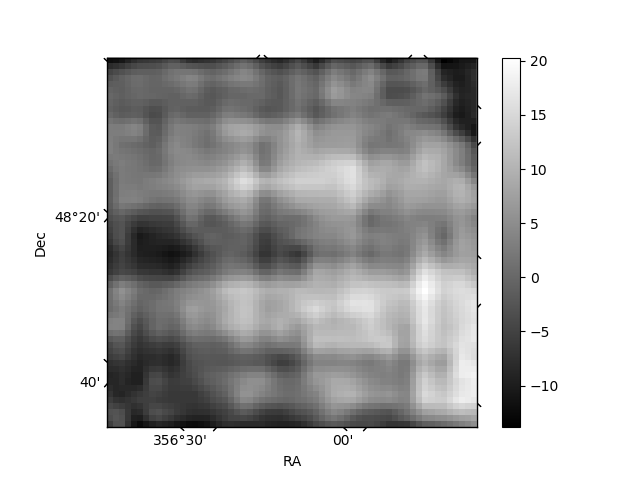
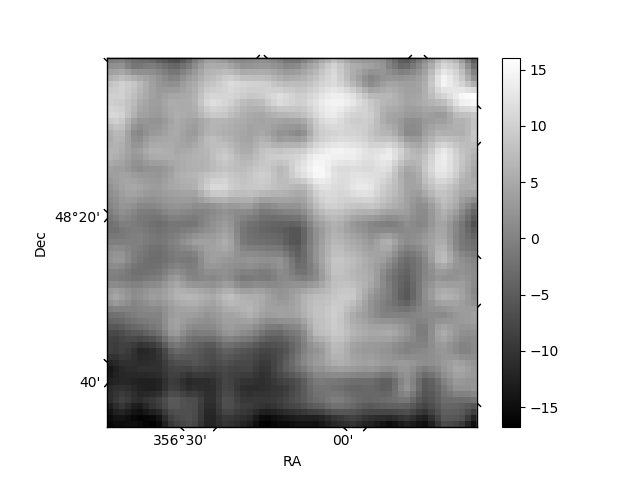
Histogram calculated using DETX and DETY for each event in the final _common_clean file
| Quadrant A | 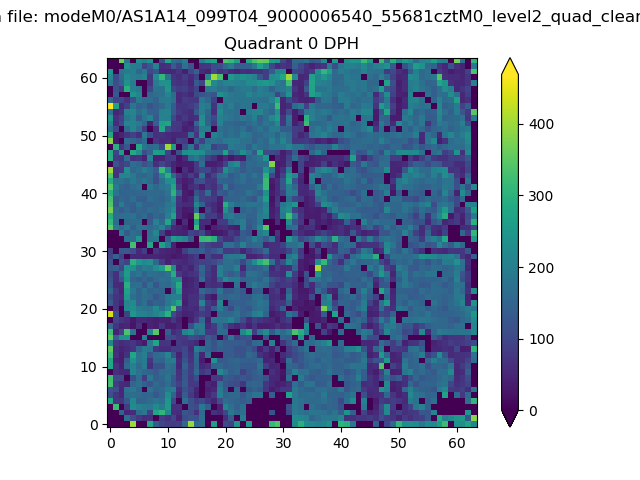 |
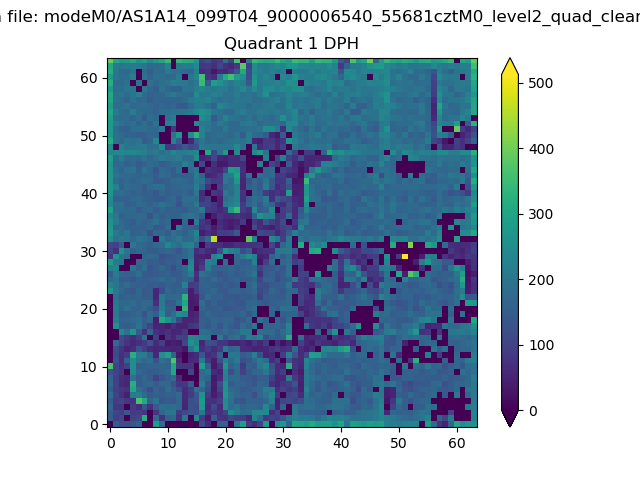 |
Quadrant B |
|---|---|---|---|
| Quadrant D | 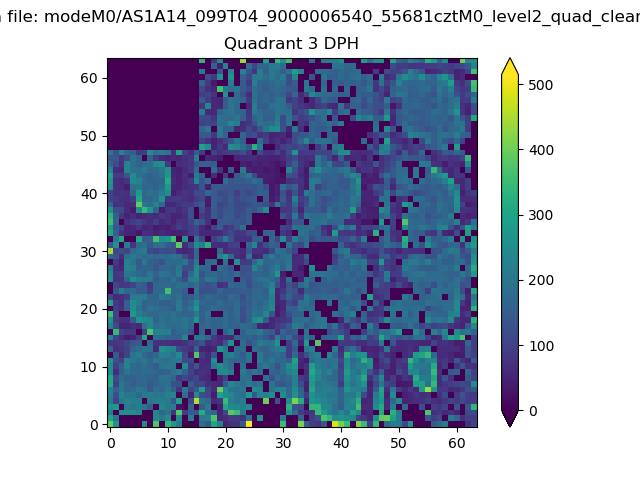 |
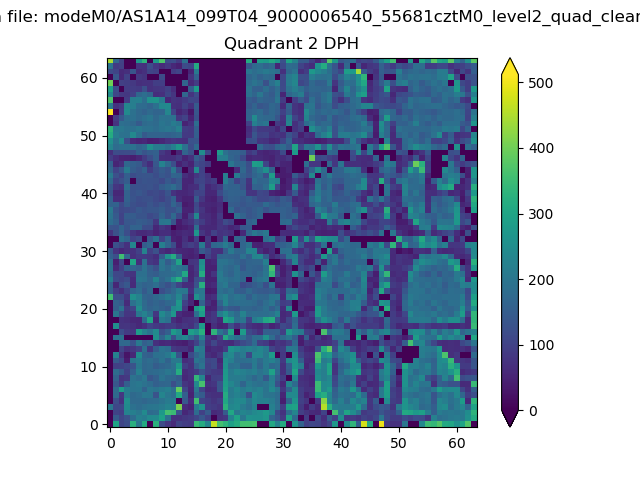 |
Quadrant C |
| Plot type | Count rate plots | Images |
|---|---|---|
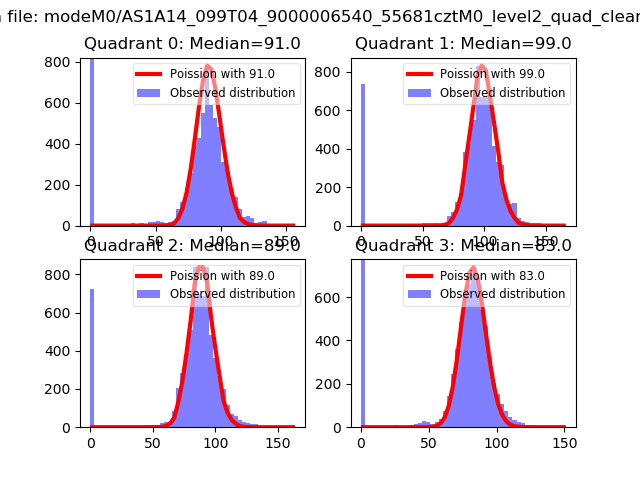
| Comparison with Poisson distribution Blue bars denote a histogram of data divided into 1 sec bins. Red curve is a Poisson curve with rate = median count rate of data. |
 |
 |
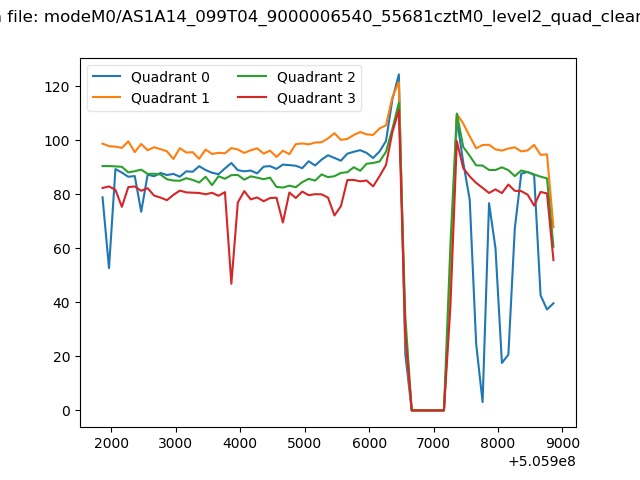
| Quadrant-wise count rates Data is divided into 100 sec bins |
 |
|
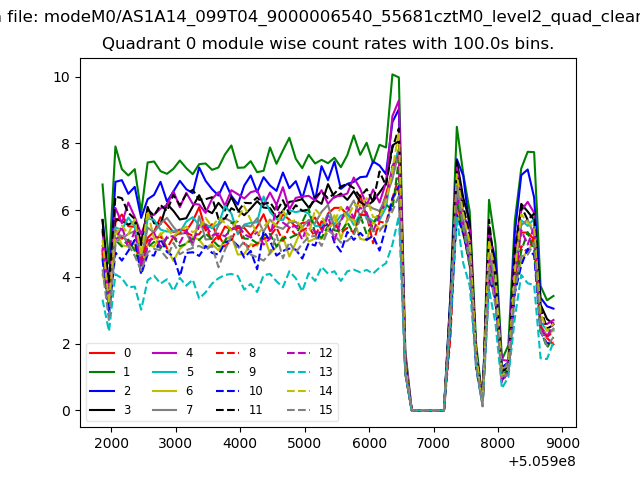
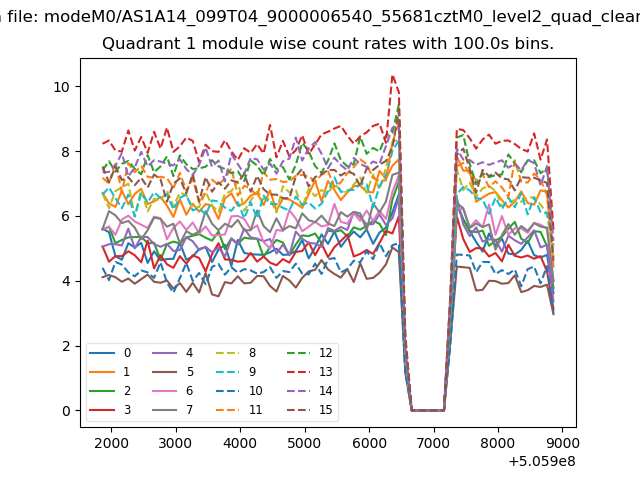
| Module-wise count rates for Quadrant A Data is divided into 100 sec bins |
 |
 |
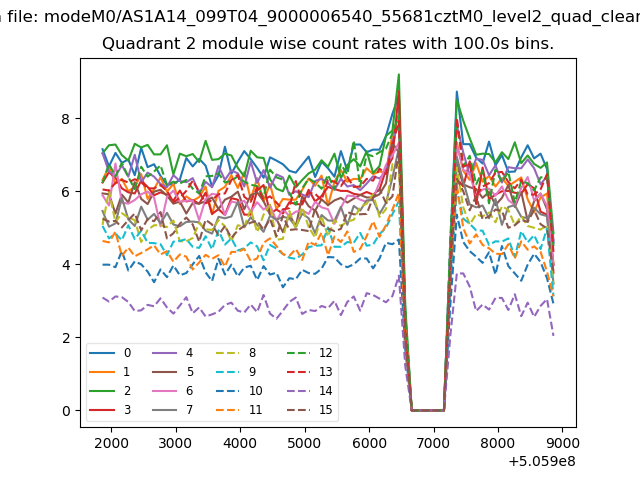
| Module-wise count rates for Quadrant B Data is divided into 100 sec bins |
 |
 |
| Module-wise count rates for Quadrant C Data is divided into 100 sec bins |
 |
 |
| Module-wise count rates for Quadrant D Data is divided into 100 sec bins |
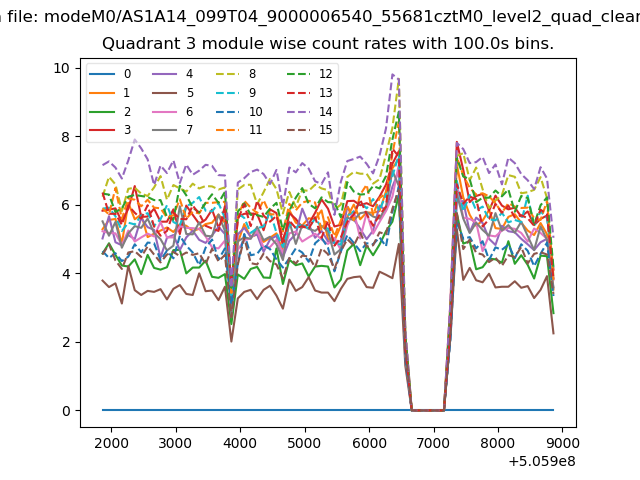 |
 |
| Parameter | Plot |
|---|---|
| CZT HV Monitor | 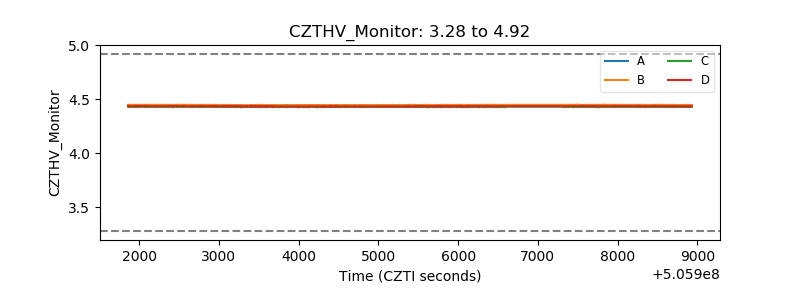 |
| D_VDD | 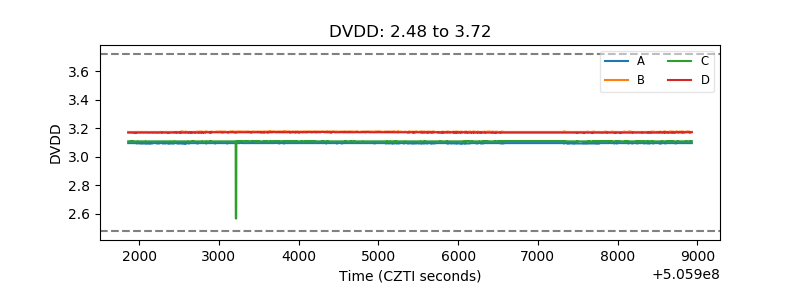 |
| Temperature 1 | 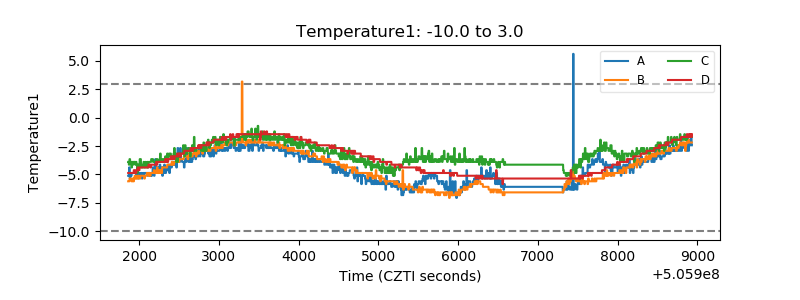 |
| Veto HV Monitor |  |
| Veto LLD | 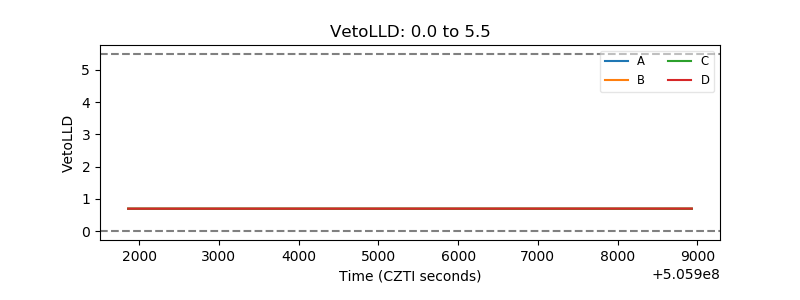 |
| Alpha Counter | 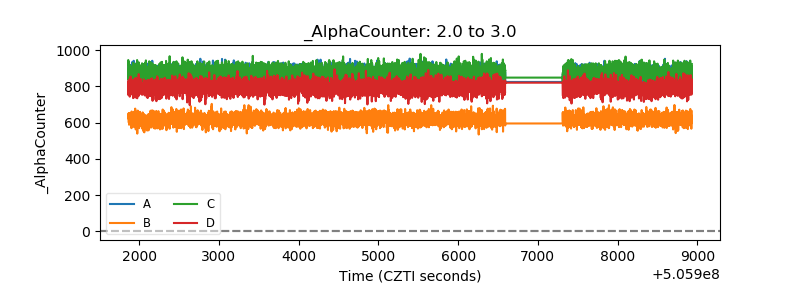 |
| _CPM_Rate | 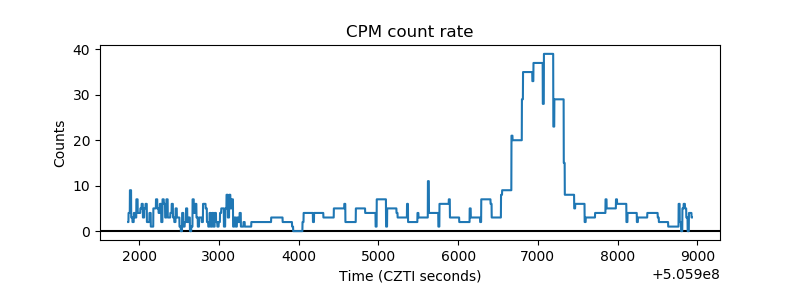 |
| CZT Counter | 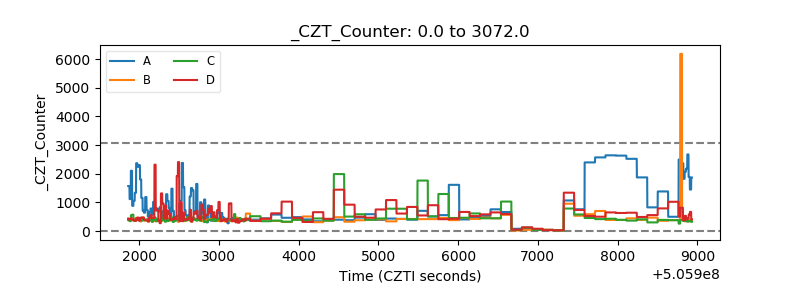 |
| +2.5 Volts monitor |  |
| +5 Volts monitor |  |
| _ROLL_ROT | 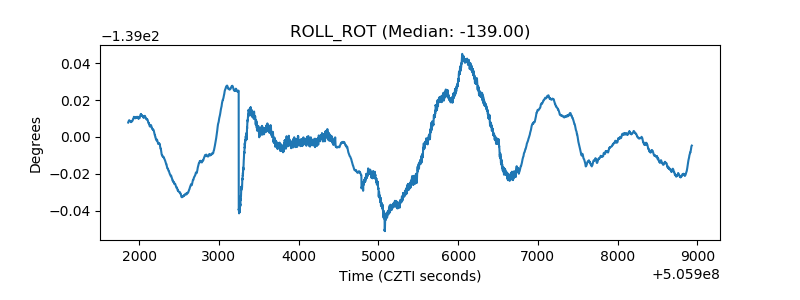 |
| _Roll_DEC | 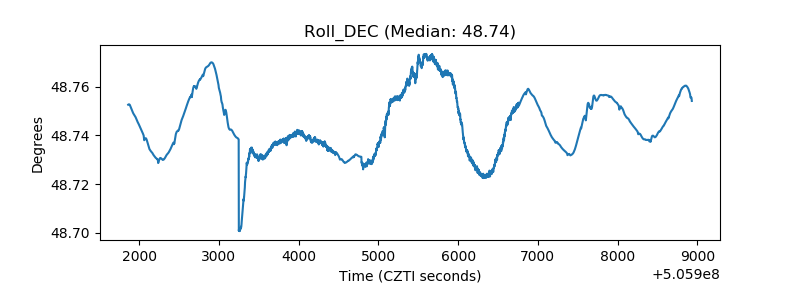 |
| _Roll_RA | 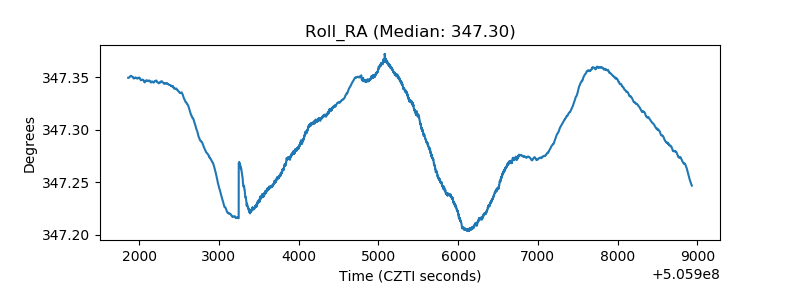 |
| Veto Counter | 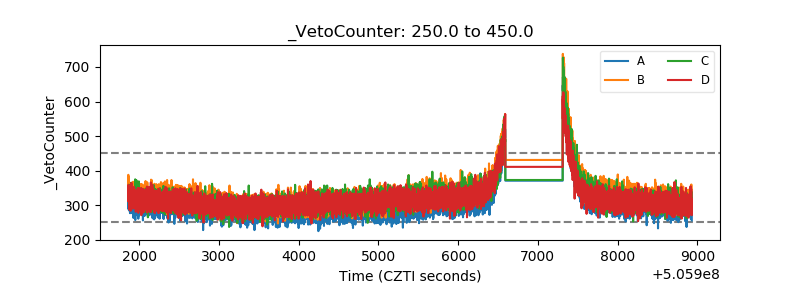 |