| Param | Original file | Final file |
|---|---|---|
| Filename | modeM0/AS1A14_099T04_9000006540_55682cztM0_level2.fits | modeM0/AS1A14_099T04_9000006540_55682cztM0_level2_quad_clean.evt |
| Size (bytes) | 635,388,480 | 94,029,120 |
| Size | 606.0 MB | 89.7 MB |
| Events in quadrant A | 9,426,275 | 510,152 |
| Events in quadrant B | 3,065,459 | 689,264 |
| Events in quadrant C | 3,126,962 | 626,910 |
| Events in quadrant D | 7,361,616 | 535,965 |
| Mode M0 | |||
|---|---|---|---|
| Quadrant | BADHDUFLAG | Total packets | Discarded packets |
| A | 0 | 32875 | 15 |
| B | 0 | 14658 | 4 |
| C | 0 | 14946 | 0 |
| D | 0 | 26695 | 22 |
| Mode SS | |||
|---|---|---|---|
| Quadrant | BADHDUFLAG | Total packets | Discarded packets |
| A | 0 | 138 | 0 |
| B | 0 | 138 | 0 |
| C | 0 | 138 | 0 |
| D | 0 | 138 | 0 |
| Quadrant | Total seconds | Saturated seconds | Saturation percentage |
|---|---|---|---|
| A | 6960 | 1696 | 24.367816% |
| B | 6961 | 174 | 2.499641% |
| C | 6963 | 59 | 0.847336% |
| D | 6958 | 918 | 13.193446% |
Noise dominated data is calculated using 1-second bins in cleaned event files. If a bin has >2000 counts, and if more than 50% of those come from <1% of pixels, then it is considered to be noise-dominated and hence unusable.
| Quadrant | # 1 sec bins | Bins with >0 counts | Bins with >2000 counts | High rate bins dominated by noise | Noise dominated (total time) | Noise dominated (detector-on time) | Marked lightcurve |
|---|---|---|---|---|---|---|---|
| A | 6963 | 6963 | 1271 | 1271 | 18.25% | 18.25% | 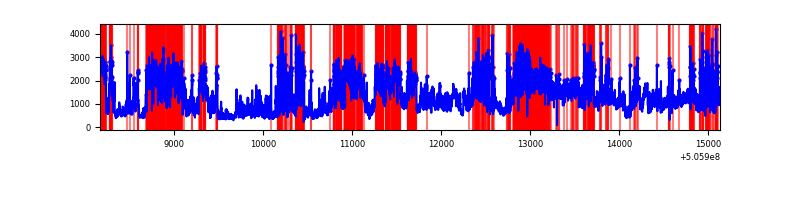 |
| B | 6963 | 6962 | 6 | 6 | 0.09% | 0.09% | 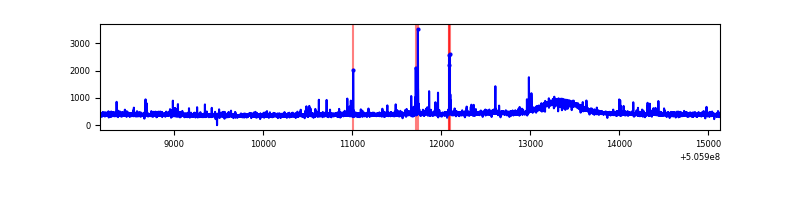 |
| C | 6963 | 6963 | 29 | 29 | 0.42% | 0.42% | 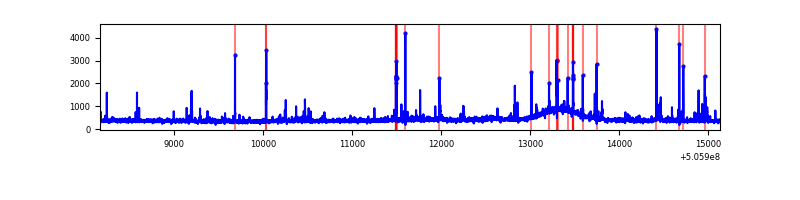 |
| D | 6963 | 6961 | 822 | 822 | 11.81% | 11.81% | 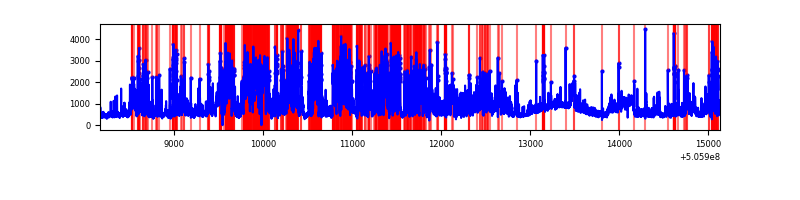 |
Top three noisy pixels from each quadrant. If the there are fewer than three noisy pixels in the level2.evt file, extra rows are filled as -1
| Pixel properties | Quadrant properties | ||||||
|---|---|---|---|---|---|---|---|
| Quadrant | DetID | PixID | Counts | Sigma | Mean | Median | Sigma |
| A | 12 | 115 | 5189743 | 30883.98 | 681 | 664 | 168.0 |
| A | 7 | 64 | 1061303 | 6312.63 | 681 | 664 | 168.0 |
| A | 8 | 206 | 250317 | 1485.86 | 681 | 664 | 168.0 |
| B | 7 | 252 | 39087 | 238.18 | 742 | 712 | 161.1 |
| B | 5 | 248 | 30730 | 186.31 | 742 | 712 | 161.1 |
| B | 12 | 111 | 19861 | 118.85 | 742 | 712 | 161.1 |
| C | 10 | 19 | 71632 | 351.85 | 731 | 726 | 201.5 |
| C | 13 | 3 | 70393 | 345.7 | 731 | 726 | 201.5 |
| C | 12 | 252 | 47469 | 231.95 | 731 | 726 | 201.5 |
| D | 11 | 129 | 4084062 | 20608.35 | 700 | 670 | 198.1 |
| D | 8 | 245 | 123498 | 619.9 | 700 | 670 | 198.1 |
| D | 10 | 181 | 100528 | 503.97 | 700 | 670 | 198.1 |
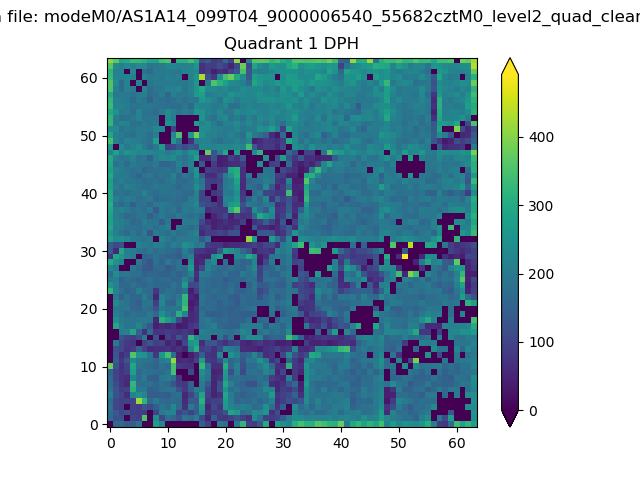
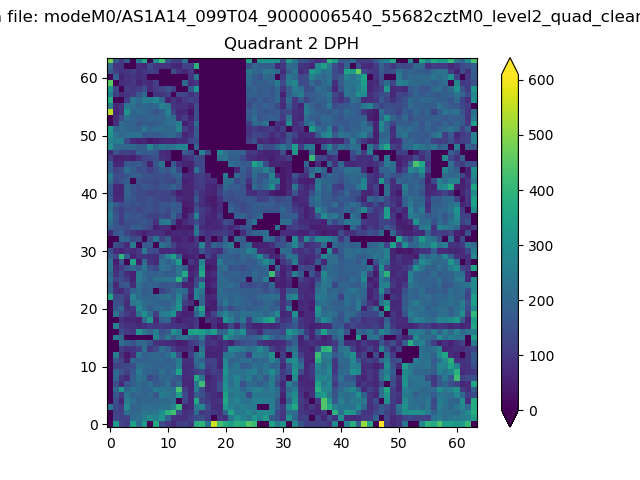
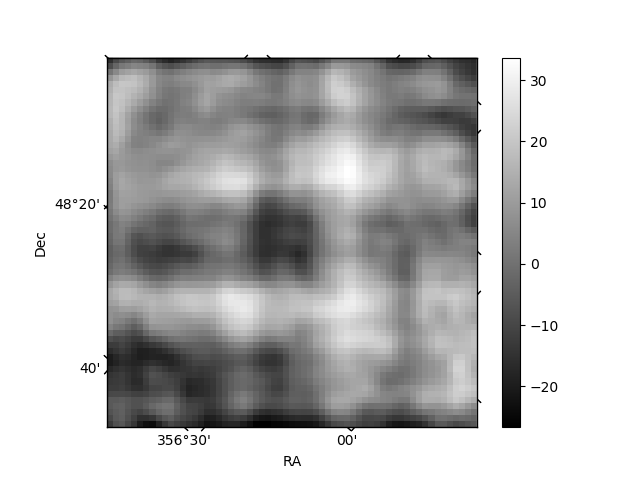
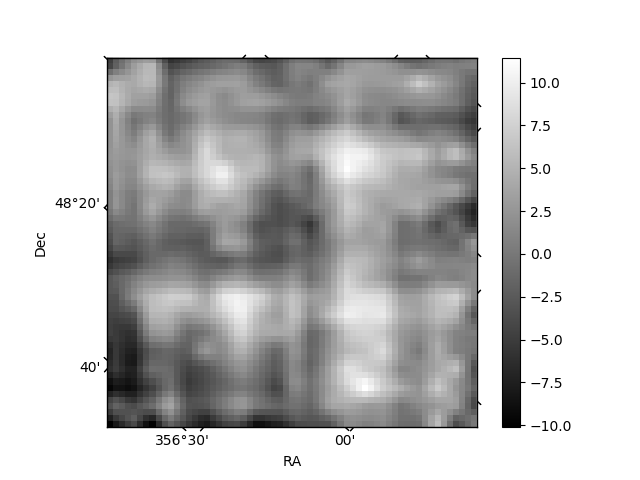
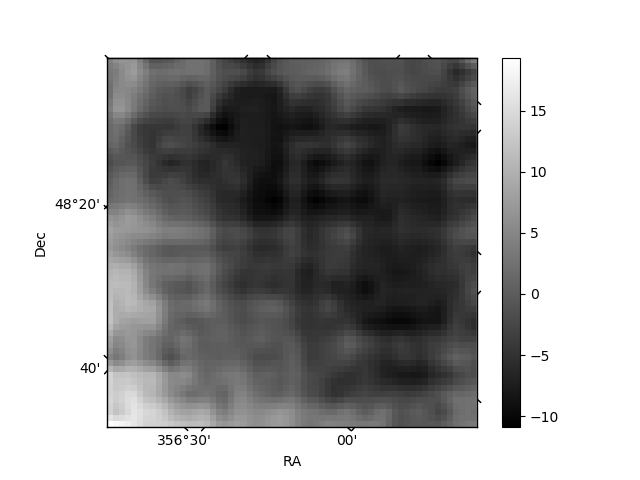
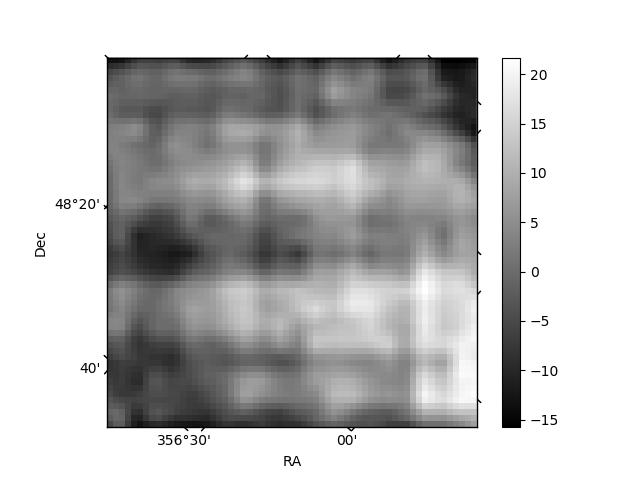
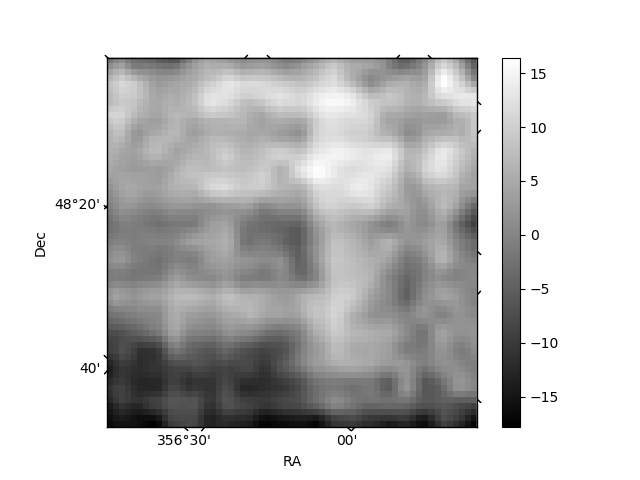
Histogram calculated using DETX and DETY for each event in the final _common_clean file
| Quadrant A |  |
 |
Quadrant B |
|---|---|---|---|
| Quadrant D | 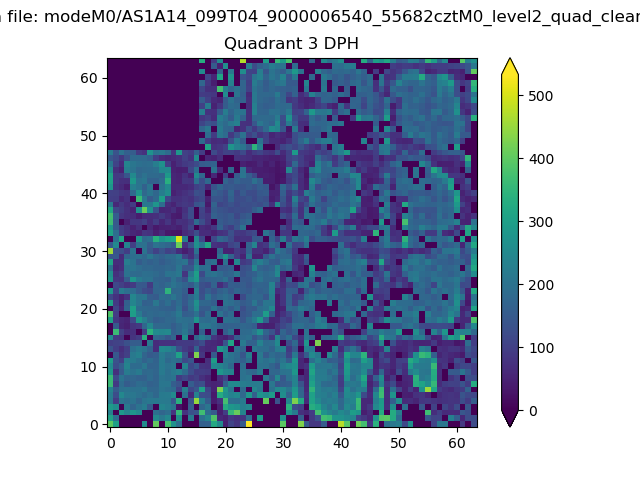 |
 |
Quadrant C |
| Plot type | Count rate plots | Images |
|---|---|---|
| Comparison with Poisson distribution Blue bars denote a histogram of data divided into 1 sec bins. Red curve is a Poisson curve with rate = median count rate of data. |
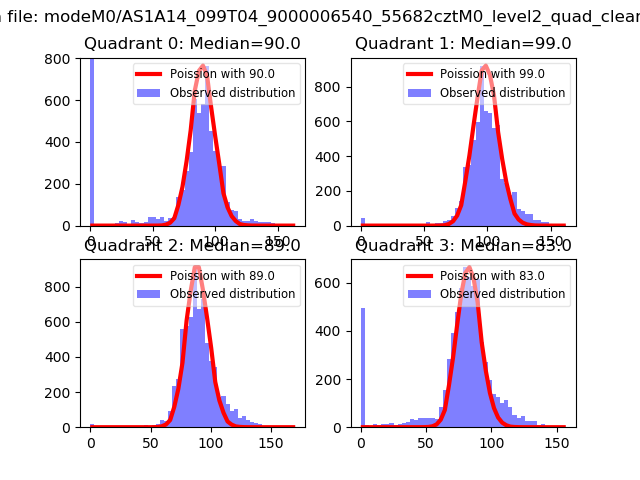 |
 |
| Quadrant-wise count rates Data is divided into 100 sec bins |
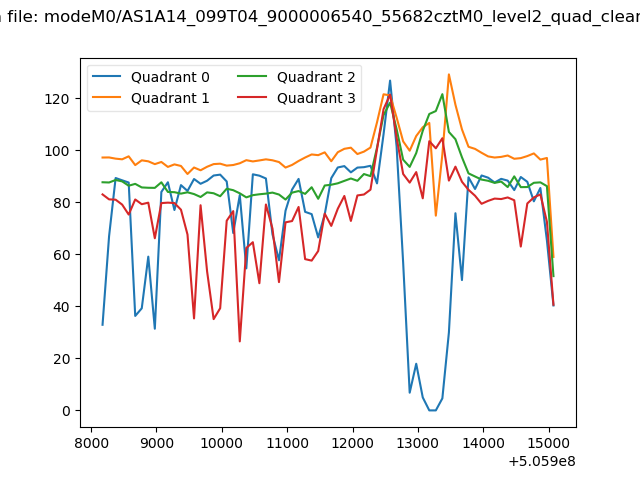 |
|
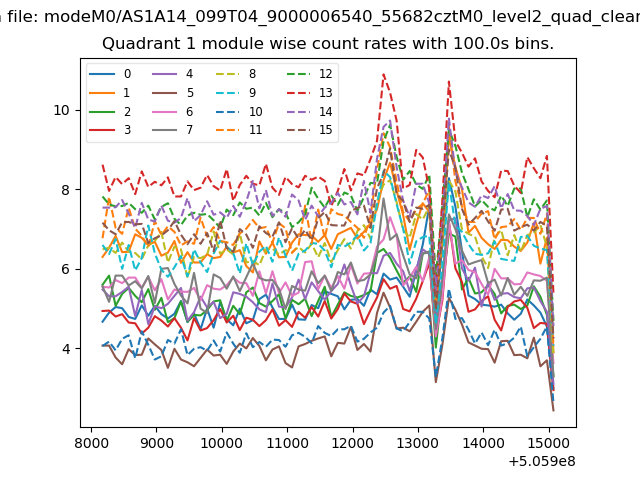
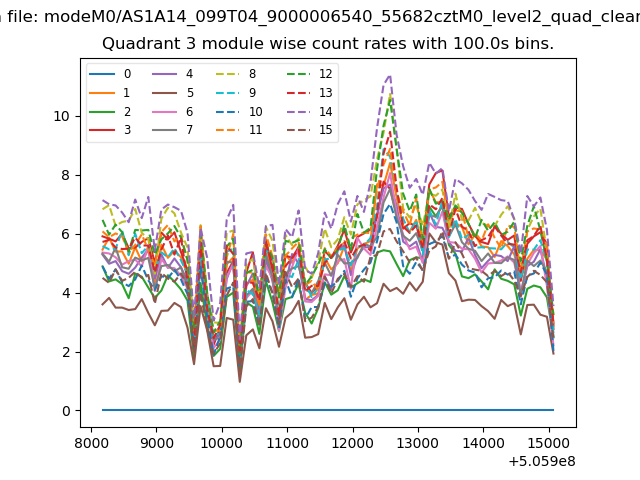
| Module-wise count rates for Quadrant A Data is divided into 100 sec bins |
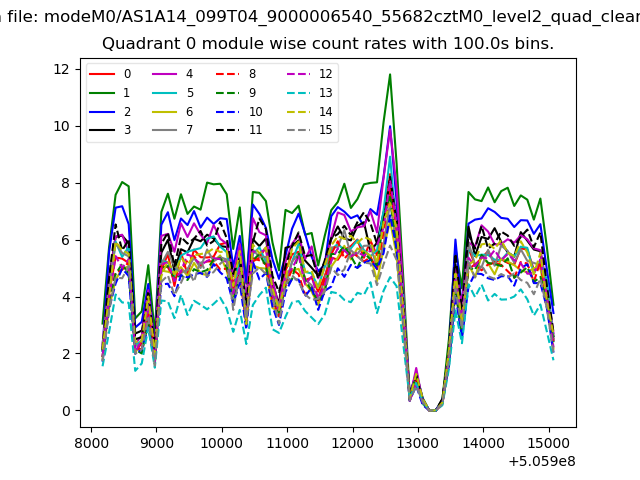 |
 |
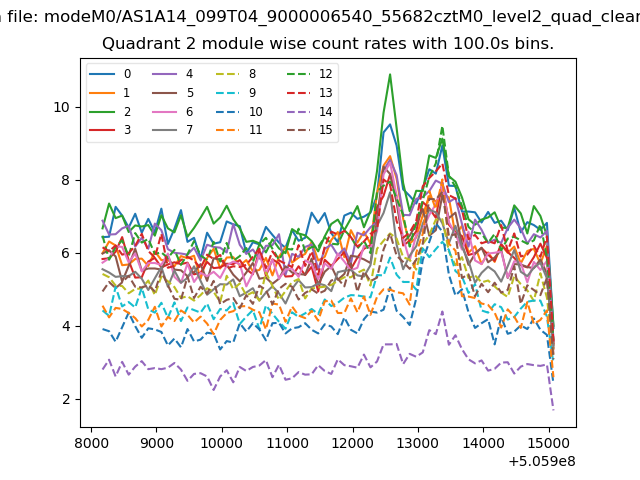
| Module-wise count rates for Quadrant B Data is divided into 100 sec bins |
 |
 |
| Module-wise count rates for Quadrant C Data is divided into 100 sec bins |
 |
 |
| Module-wise count rates for Quadrant D Data is divided into 100 sec bins |
 |
 |
| Parameter | Plot |
|---|---|
| CZT HV Monitor | 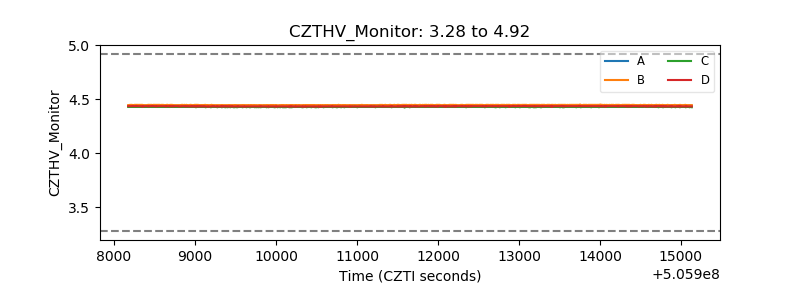 |
| D_VDD | 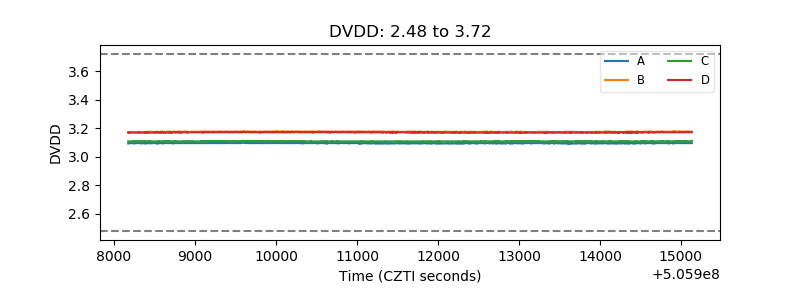 |
| Temperature 1 | 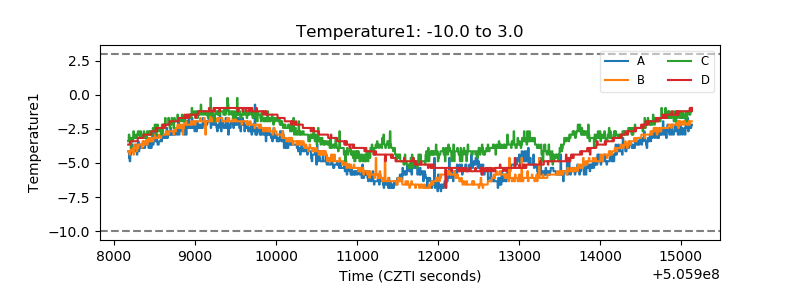 |
| Veto HV Monitor |  |
| Veto LLD | 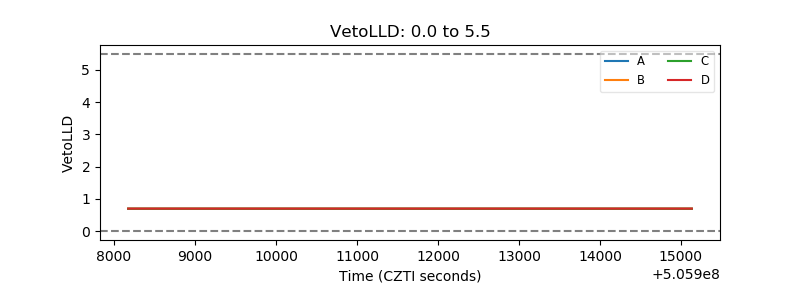 |
| Alpha Counter | 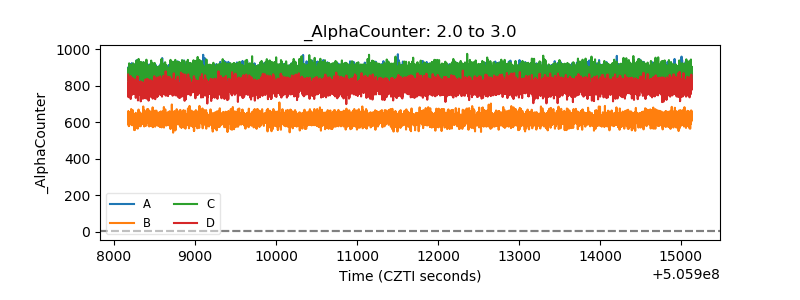 |
| _CPM_Rate | 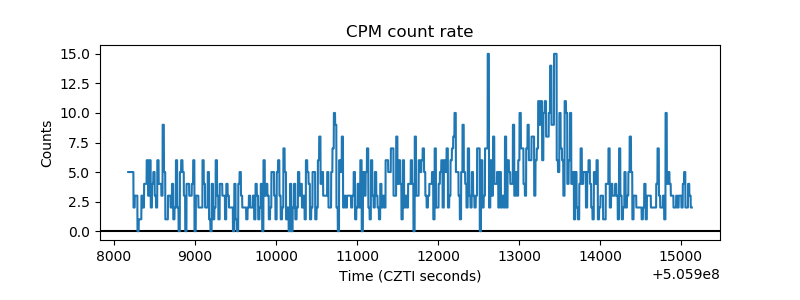 |
| CZT Counter | 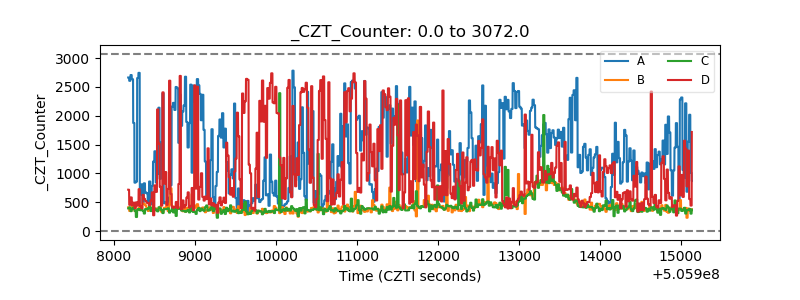 |
| +2.5 Volts monitor |  |
| +5 Volts monitor |  |
| _ROLL_ROT | 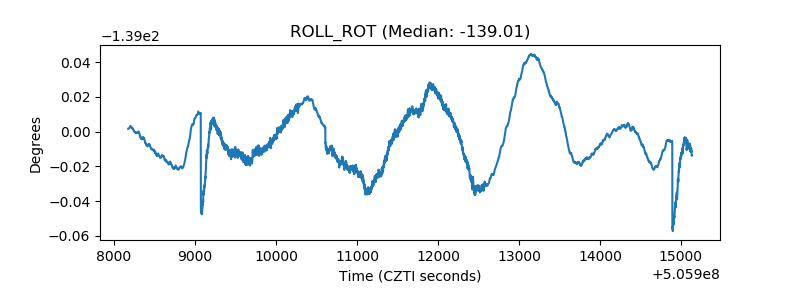 |
| _Roll_DEC | 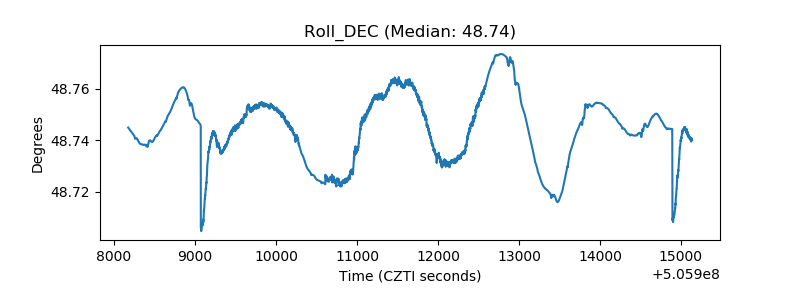 |
| _Roll_RA | 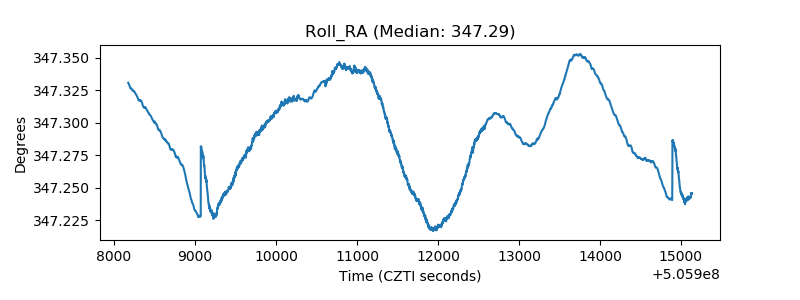 |
| Veto Counter | 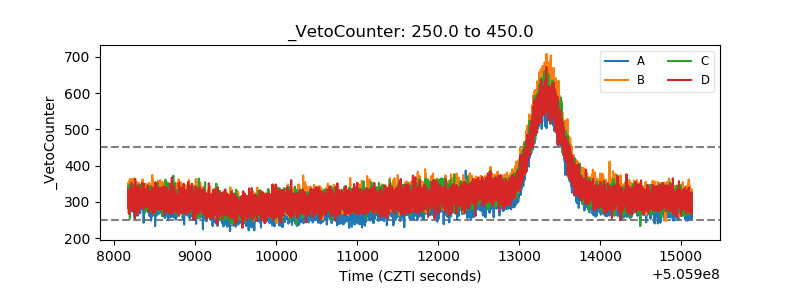 |