| Param | Original file | Final file |
|---|---|---|
| Filename | modeM0/AS1A14_099T04_9000006540_55683cztM0_level2.fits | modeM0/AS1A14_099T04_9000006540_55683cztM0_level2_quad_clean.evt |
| Size (bytes) | 597,467,520 | 104,567,040 |
| Size | 569.8 MB | 99.7 MB |
| Events in quadrant A | 6,117,930 | 679,142 |
| Events in quadrant B | 3,419,026 | 745,432 |
| Events in quadrant C | 3,610,445 | 674,960 |
| Events in quadrant D | 8,376,893 | 535,520 |
| Mode M0 | |||
|---|---|---|---|
| Quadrant | BADHDUFLAG | Total packets | Discarded packets |
| A | 0 | 23565 | 11 |
| B | 0 | 16208 | 28 |
| C | 0 | 16695 | 0 |
| D | 0 | 30290 | 63 |
| Mode SS | |||
|---|---|---|---|
| Quadrant | BADHDUFLAG | Total packets | Discarded packets |
| A | 0 | 152 | 0 |
| B | 0 | 152 | 0 |
| C | 0 | 152 | 0 |
| D | 0 | 152 | 0 |
| Quadrant | Total seconds | Saturated seconds | Saturation percentage |
|---|---|---|---|
| A | 7638 | 348 | 4.556167% |
| B | 7626 | 48 | 0.629426% |
| C | 7642 | 48 | 0.628108% |
| D | 7628 | 1362 | 17.855270% |
Noise dominated data is calculated using 1-second bins in cleaned event files. If a bin has >2000 counts, and if more than 50% of those come from <1% of pixels, then it is considered to be noise-dominated and hence unusable.
| Quadrant | # 1 sec bins | Bins with >0 counts | Bins with >2000 counts | High rate bins dominated by noise | Noise dominated (total time) | Noise dominated (detector-on time) | Marked lightcurve |
|---|---|---|---|---|---|---|---|
| A | 7642 | 7641 | 254 | 254 | 3.32% | 3.32% | 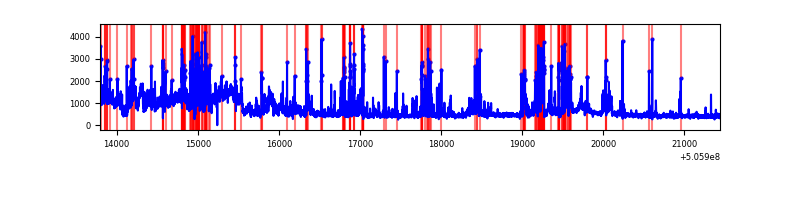 |
| B | 7642 | 7636 | 34 | 34 | 0.44% | 0.45% | 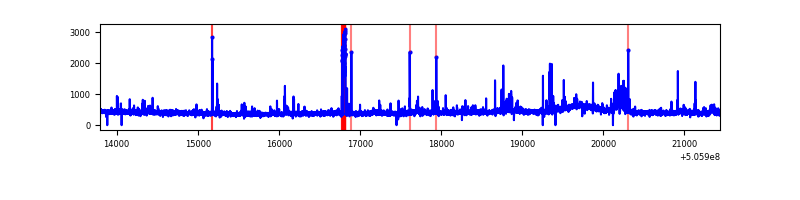 |
| C | 7643 | 7643 | 41 | 41 | 0.54% | 0.54% | 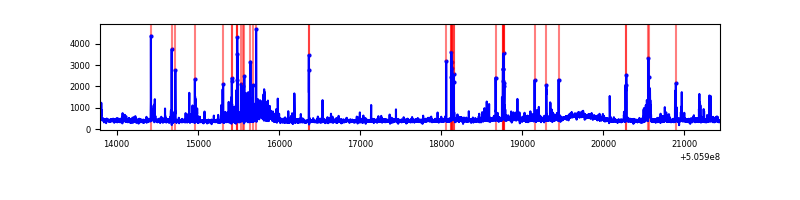 |
| D | 7643 | 7637 | 1233 | 1233 | 16.13% | 16.15% | 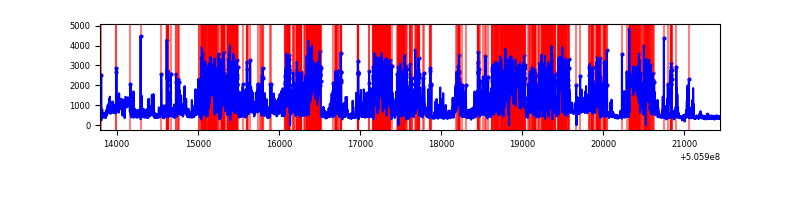 |
Top three noisy pixels from each quadrant. If the there are fewer than three noisy pixels in the level2.evt file, extra rows are filled as -1
| Pixel properties | Quadrant properties | ||||||
|---|---|---|---|---|---|---|---|
| Quadrant | DetID | PixID | Counts | Sigma | Mean | Median | Sigma |
| A | 12 | 115 | 1475212 | 7666.67 | 773 | 752 | 192.3 |
| A | 7 | 64 | 922336 | 4791.91 | 773 | 752 | 192.3 |
| A | 0 | 8 | 368348 | 1911.37 | 773 | 752 | 192.3 |
| B | 5 | 172 | 136272 | 820.29 | 773 | 744 | 165.2 |
| B | 0 | 173 | 97032 | 582.79 | 773 | 744 | 165.2 |
| B | 7 | 252 | 28806 | 169.85 | 773 | 744 | 165.2 |
| C | 9 | 38 | 122012 | 578.48 | 762 | 754 | 209.6 |
| C | 12 | 252 | 118009 | 559.38 | 762 | 754 | 209.6 |
| C | 10 | 19 | 115226 | 546.1 | 762 | 754 | 209.6 |
| D | 11 | 129 | 4169517 | 20962.92 | 702 | 669 | 198.9 |
| D | 8 | 245 | 455858 | 2288.9 | 702 | 669 | 198.9 |
| D | 10 | 181 | 364968 | 1831.87 | 702 | 669 | 198.9 |
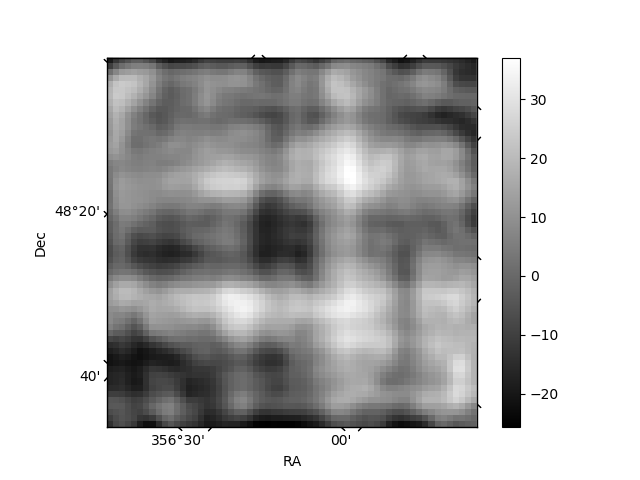
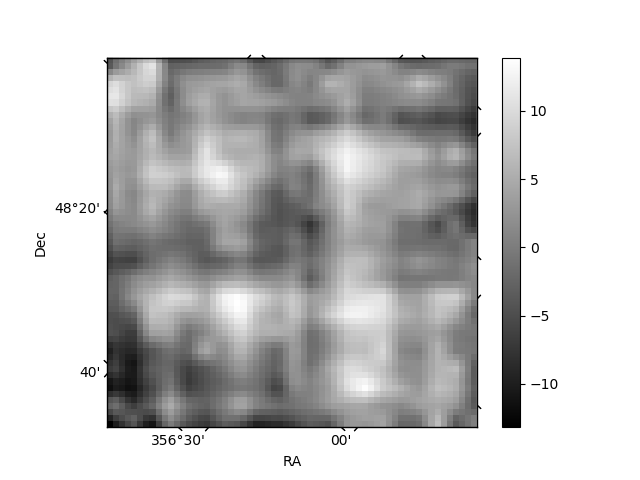
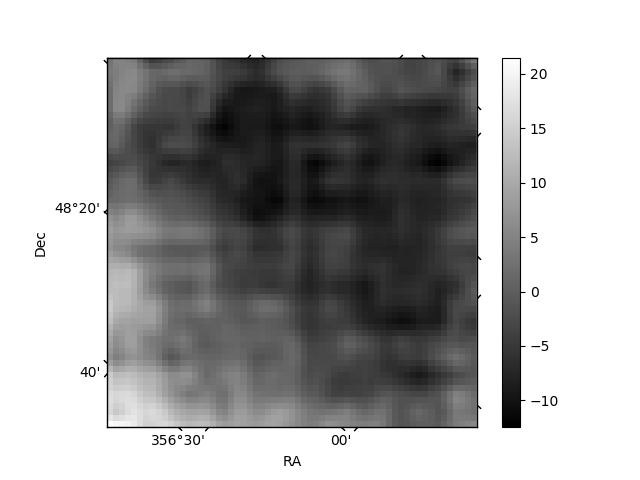
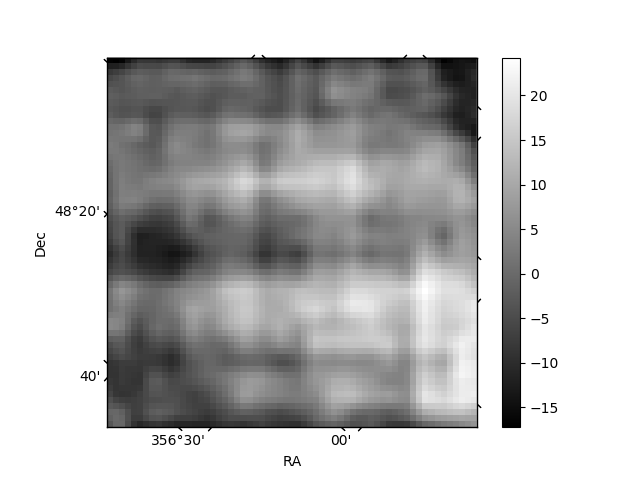
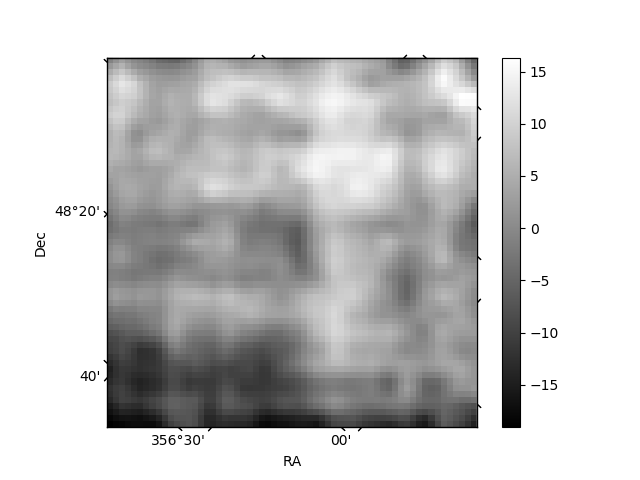
Histogram calculated using DETX and DETY for each event in the final _common_clean file
| Quadrant A | 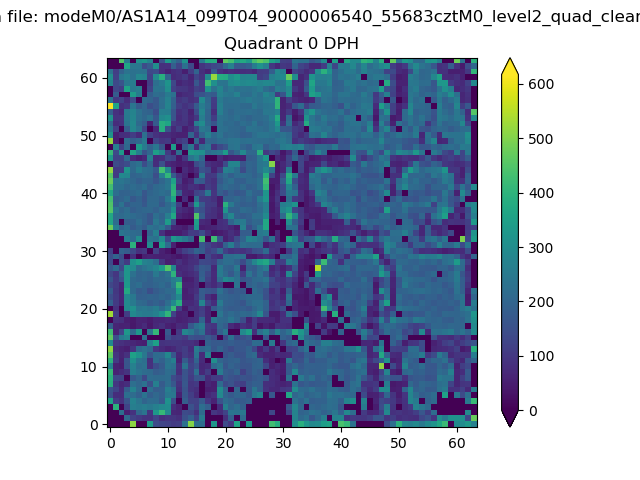 |
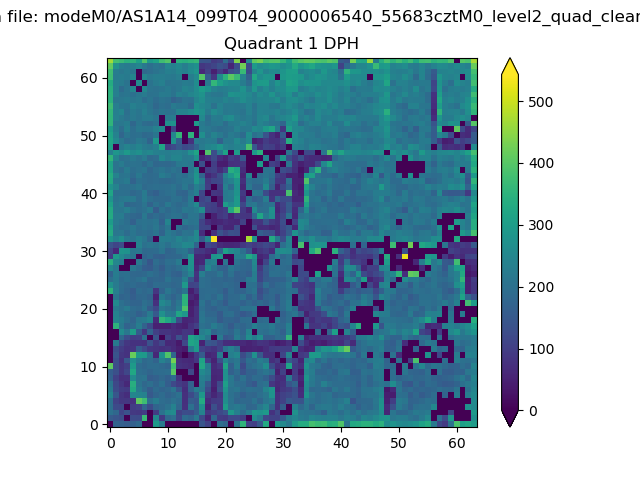 |
Quadrant B |
|---|---|---|---|
| Quadrant D | 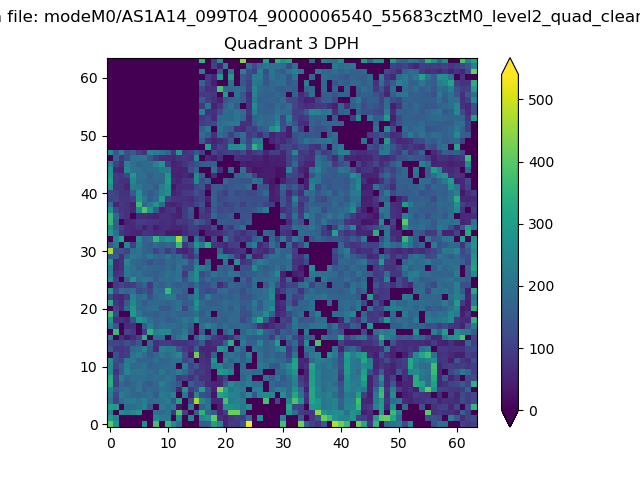 |
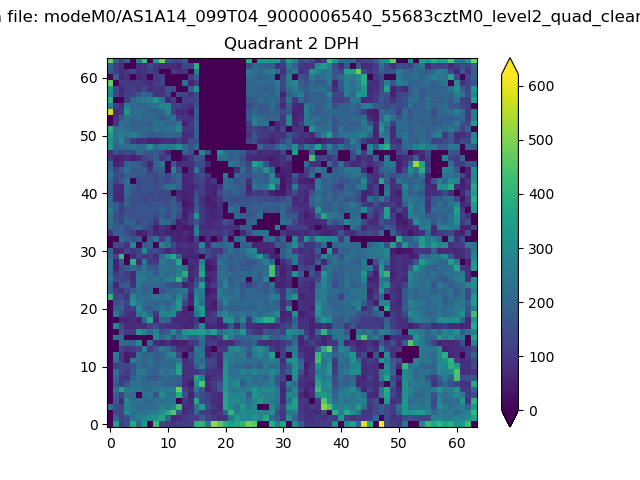 |
Quadrant C |
| Plot type | Count rate plots | Images |
|---|---|---|
| Comparison with Poisson distribution Blue bars denote a histogram of data divided into 1 sec bins. Red curve is a Poisson curve with rate = median count rate of data. |
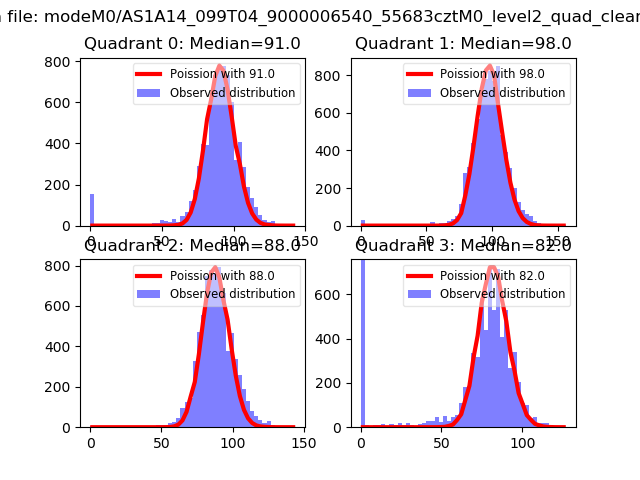 |
 |
| Quadrant-wise count rates Data is divided into 100 sec bins |
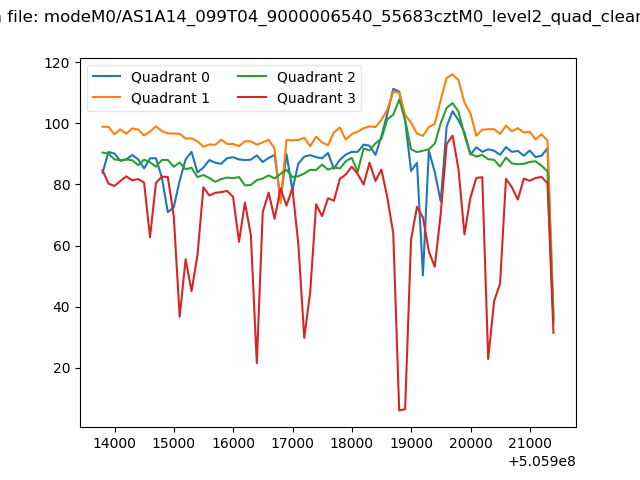 |
|
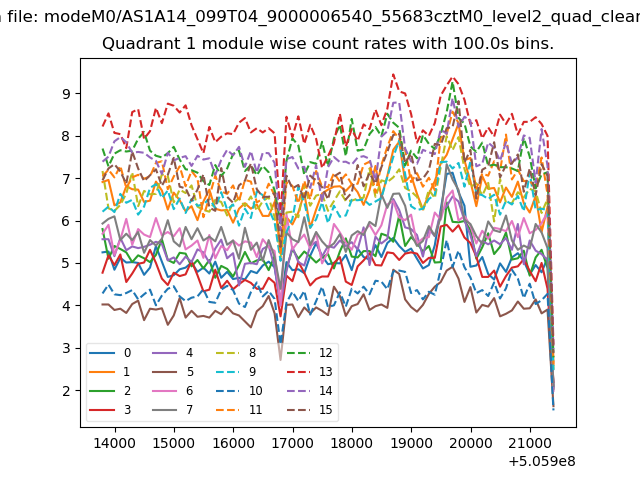
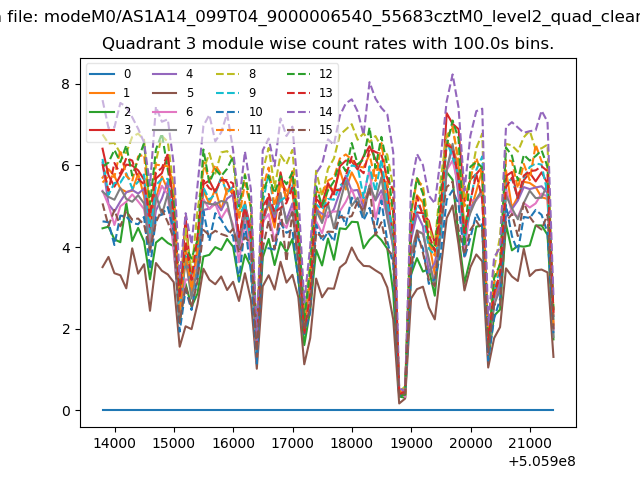
| Module-wise count rates for Quadrant A Data is divided into 100 sec bins |
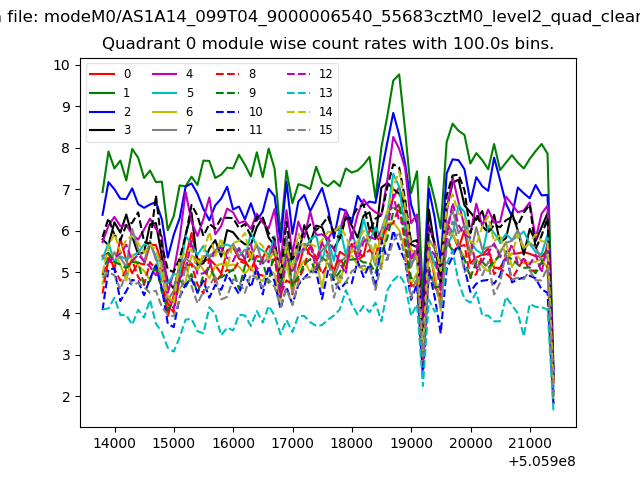 |
 |
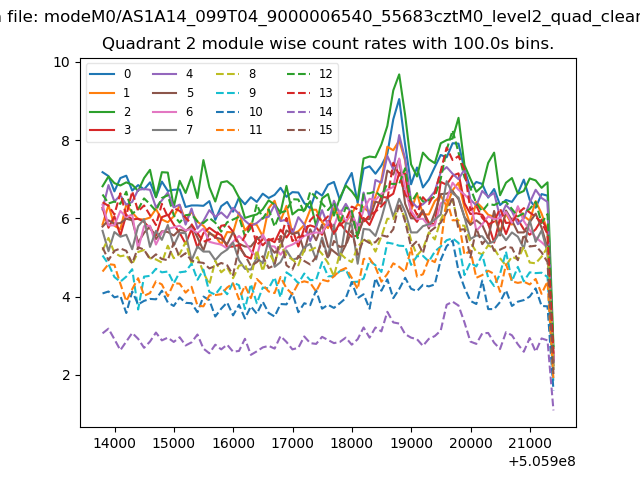
| Module-wise count rates for Quadrant B Data is divided into 100 sec bins |
 |
 |
| Module-wise count rates for Quadrant C Data is divided into 100 sec bins |
 |
 |
| Module-wise count rates for Quadrant D Data is divided into 100 sec bins |
 |
 |
| Parameter | Plot |
|---|---|
| CZT HV Monitor | 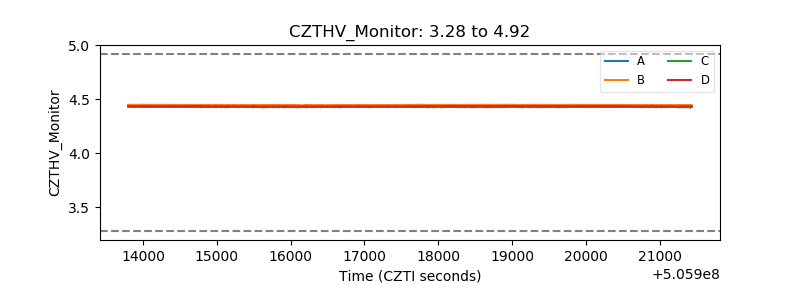 |
| D_VDD | 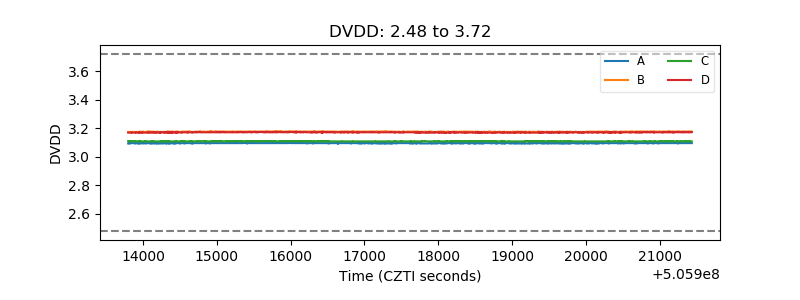 |
| Temperature 1 | 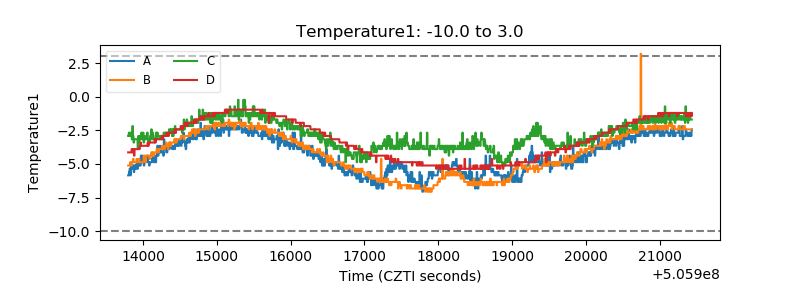 |
| Veto HV Monitor |  |
| Veto LLD | 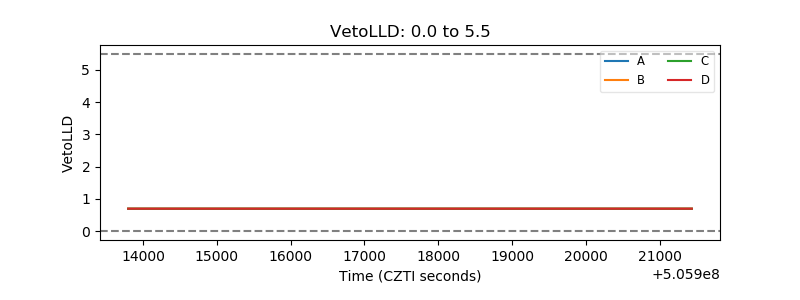 |
| Alpha Counter | 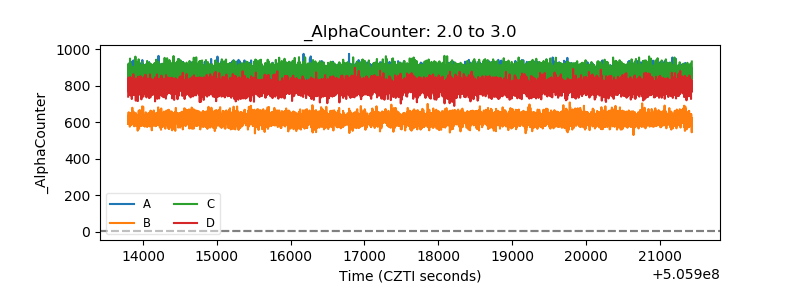 |
| _CPM_Rate | 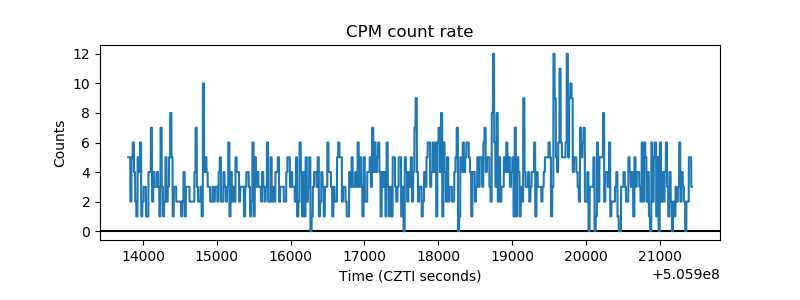 |
| CZT Counter | 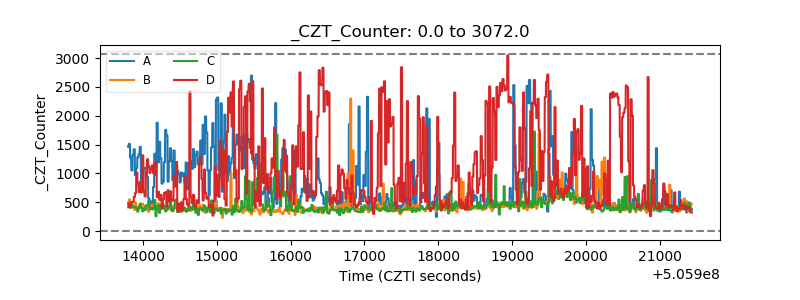 |
| +2.5 Volts monitor |  |
| +5 Volts monitor |  |
| _ROLL_ROT | 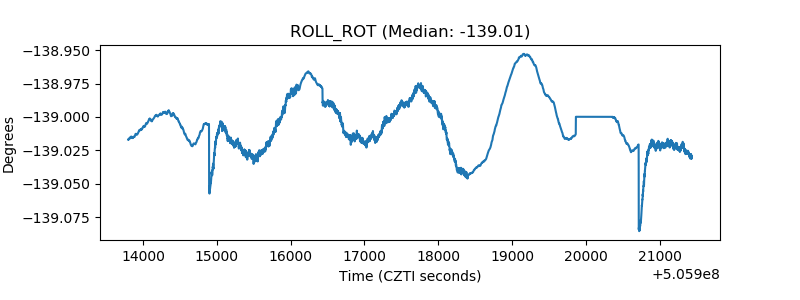 |
| _Roll_DEC | 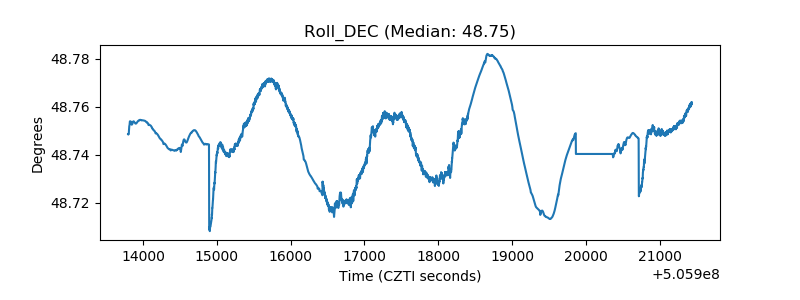 |
| _Roll_RA | 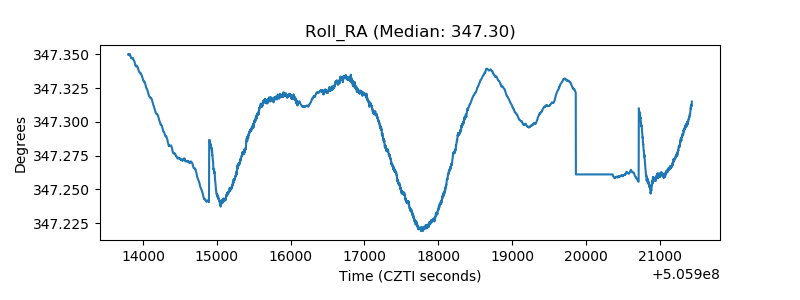 |
| Veto Counter | 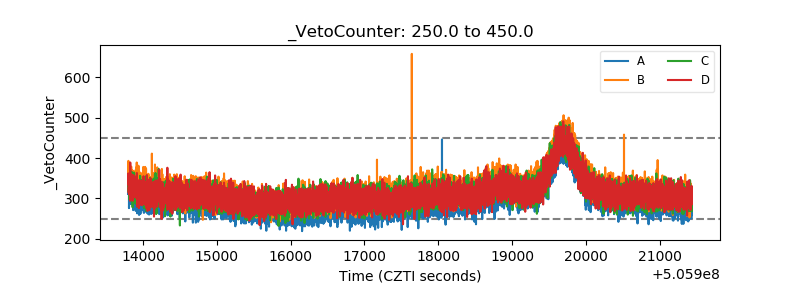 |