| Param | Original file | Final file |
|---|---|---|
| Filename | modeM0/AS1A14_099T04_9000006540_55684cztM0_level2.fits | modeM0/AS1A14_099T04_9000006540_55684cztM0_level2_quad_clean.evt |
| Size (bytes) | 416,986,560 | 95,123,520 |
| Size | 397.7 MB | 90.7 MB |
| Events in quadrant A | 4,013,777 | 591,891 |
| Events in quadrant B | 3,112,410 | 666,668 |
| Events in quadrant C | 3,008,581 | 599,884 |
| Events in quadrant D | 4,770,725 | 547,256 |
| Mode M0 | |||
|---|---|---|---|
| Quadrant | BADHDUFLAG | Total packets | Discarded packets |
| A | 0 | 16995 | 0 |
| B | 0 | 14531 | 0 |
| C | 0 | 14350 | 0 |
| D | 0 | 19151 | 0 |
| Mode SS | |||
|---|---|---|---|
| Quadrant | BADHDUFLAG | Total packets | Discarded packets |
| A | 0 | 136 | 0 |
| B | 0 | 136 | 0 |
| C | 0 | 136 | 0 |
| D | 0 | 136 | 0 |
| Quadrant | Total seconds | Saturated seconds | Saturation percentage |
|---|---|---|---|
| A | 6809 | 339 | 4.978705% |
| B | 6809 | 32 | 0.469966% |
| C | 6809 | 24 | 0.352475% |
| D | 6810 | 319 | 4.684288% |
Noise dominated data is calculated using 1-second bins in cleaned event files. If a bin has >2000 counts, and if more than 50% of those come from <1% of pixels, then it is considered to be noise-dominated and hence unusable.
| Quadrant | # 1 sec bins | Bins with >0 counts | Bins with >2000 counts | High rate bins dominated by noise | Noise dominated (total time) | Noise dominated (detector-on time) | Marked lightcurve |
|---|---|---|---|---|---|---|---|
| A | 6809 | 6809 | 293 | 293 | 4.30% | 4.30% | 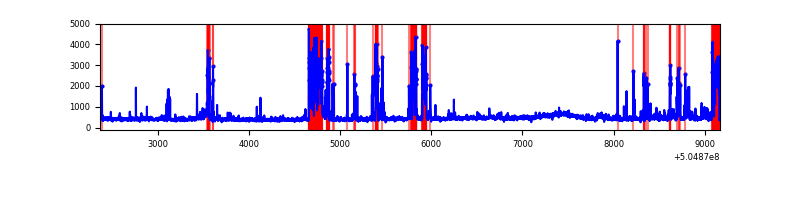 |
| B | 6809 | 6809 | 26 | 26 | 0.38% | 0.38% | 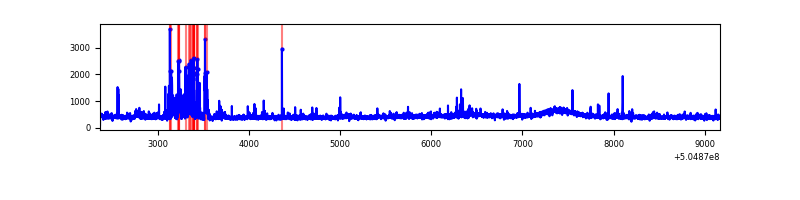 |
| C | 6809 | 6809 | 17 | 17 | 0.25% | 0.25% | 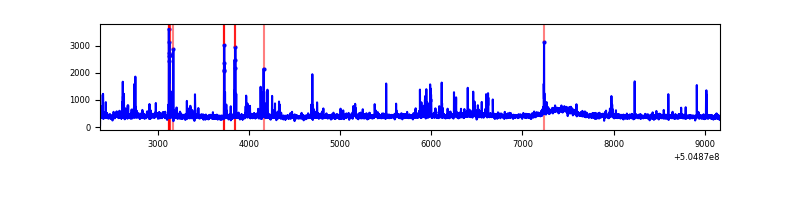 |
| D | 6810 | 6810 | 316 | 316 | 4.64% | 4.64% | 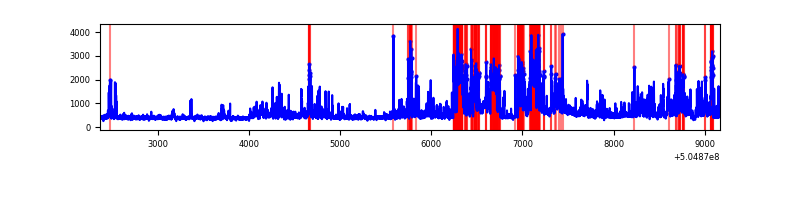 |
Top three noisy pixels from each quadrant. If the there are fewer than three noisy pixels in the level2.evt file, extra rows are filled as -1
| Pixel properties | Quadrant properties | ||||||
|---|---|---|---|---|---|---|---|
| Quadrant | DetID | PixID | Counts | Sigma | Mean | Median | Sigma |
| A | 7 | 64 | 1108492 | 6534.32 | 683 | 665 | 169.5 |
| A | 0 | 8 | 81778 | 478.43 | 683 | 665 | 169.5 |
| A | 8 | 6 | 32364 | 186.97 | 683 | 665 | 169.5 |
| B | 5 | 172 | 284581 | 1904.2 | 691 | 667 | 149.1 |
| B | 10 | 247 | 31198 | 204.77 | 691 | 667 | 149.1 |
| B | 4 | 206 | 19639 | 127.24 | 691 | 667 | 149.1 |
| C | 12 | 252 | 135671 | 716.13 | 683 | 677 | 188.5 |
| C | 13 | 3 | 108583 | 572.43 | 683 | 677 | 188.5 |
| C | 6 | 223 | 29546 | 153.15 | 683 | 677 | 188.5 |
| D | 8 | 245 | 1084417 | 5720.68 | 673 | 644 | 189.4 |
| D | 11 | 129 | 694331 | 3661.62 | 673 | 644 | 189.4 |
| D | 10 | 181 | 146116 | 767.87 | 673 | 644 | 189.4 |
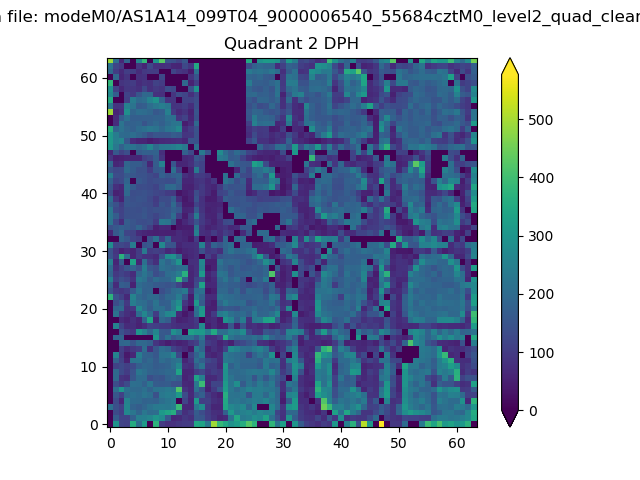
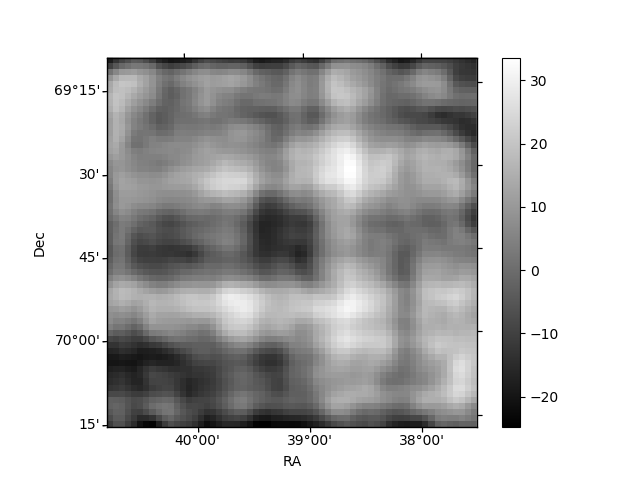
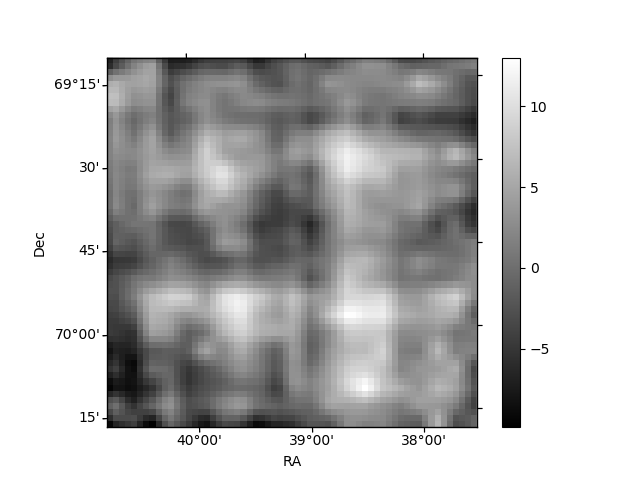
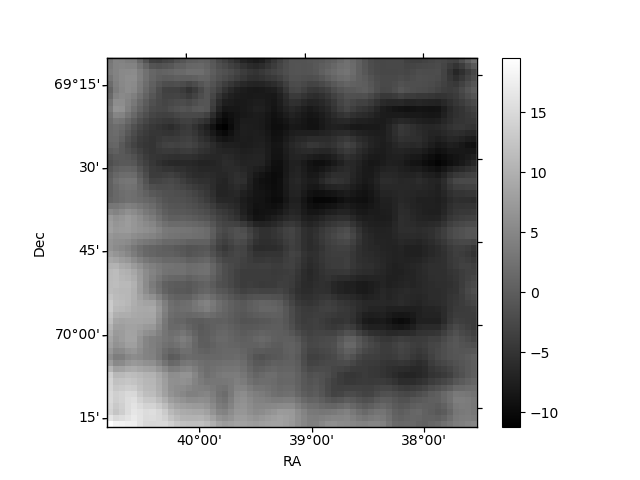
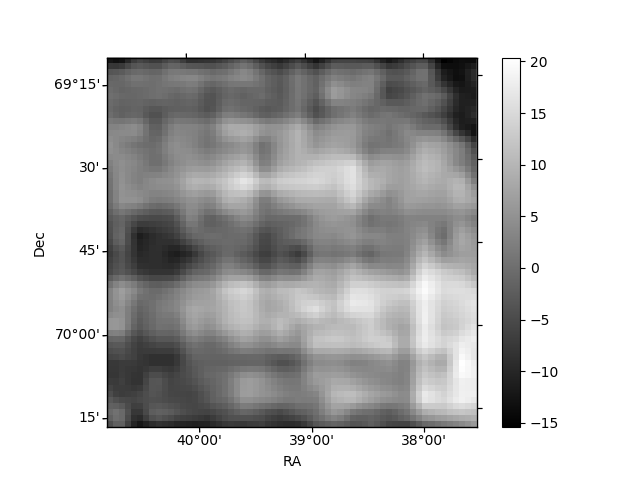
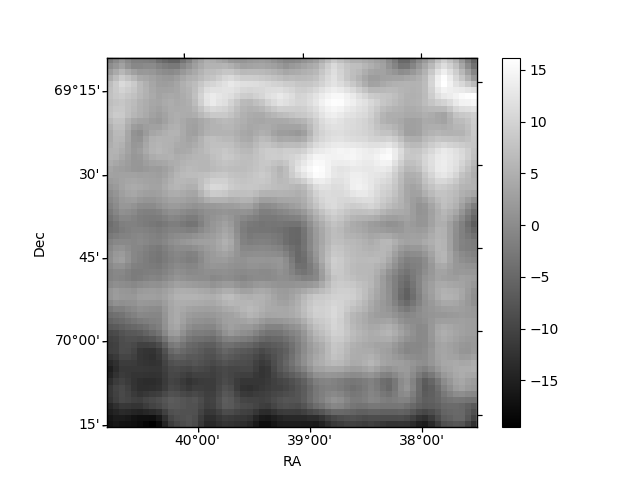
Histogram calculated using DETX and DETY for each event in the final _common_clean file
| Quadrant A | 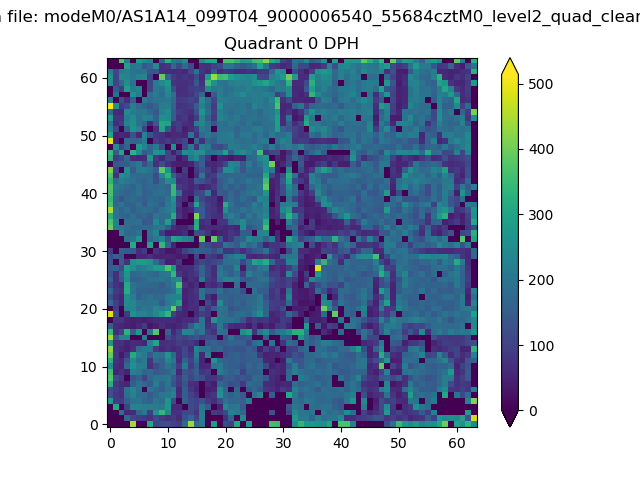 |
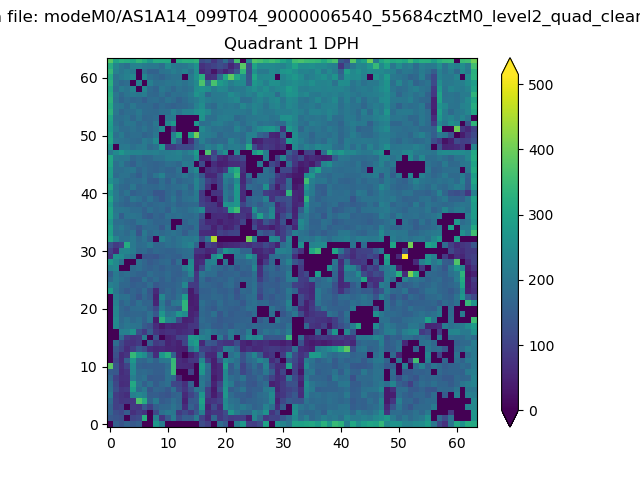 |
Quadrant B |
|---|---|---|---|
| Quadrant D | 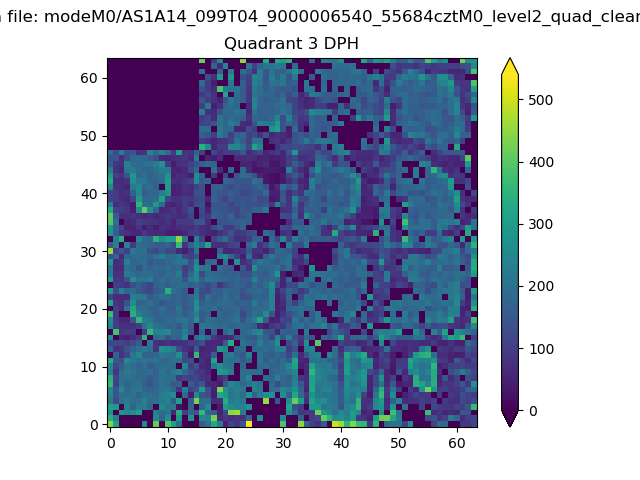 |
 |
Quadrant C |
| Plot type | Count rate plots | Images |
|---|---|---|
| Comparison with Poisson distribution Blue bars denote a histogram of data divided into 1 sec bins. Red curve is a Poisson curve with rate = median count rate of data. |
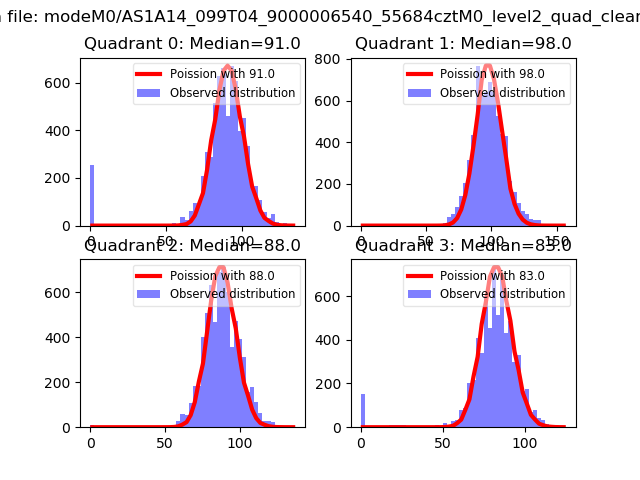 |
 |
| Quadrant-wise count rates Data is divided into 100 sec bins |
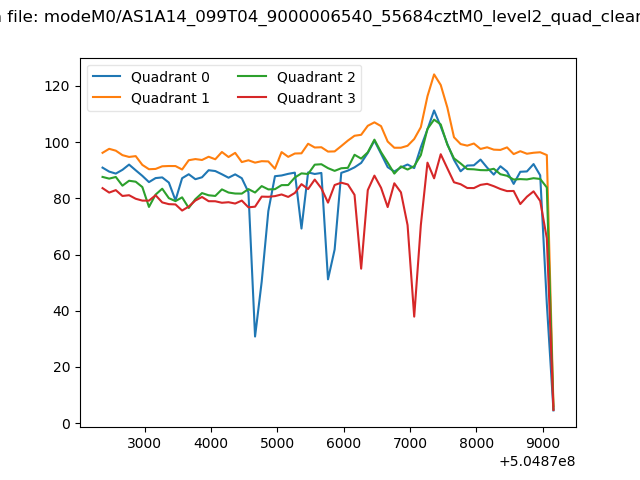 |
|
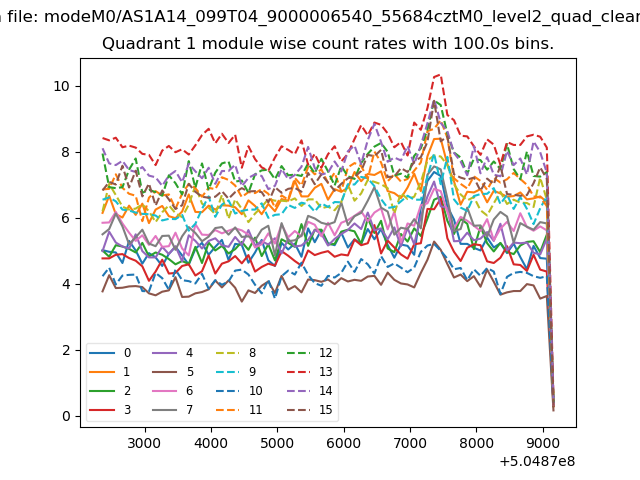
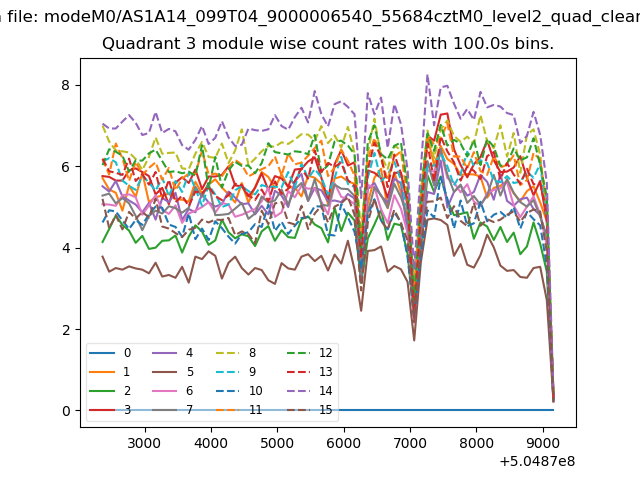
| Module-wise count rates for Quadrant A Data is divided into 100 sec bins |
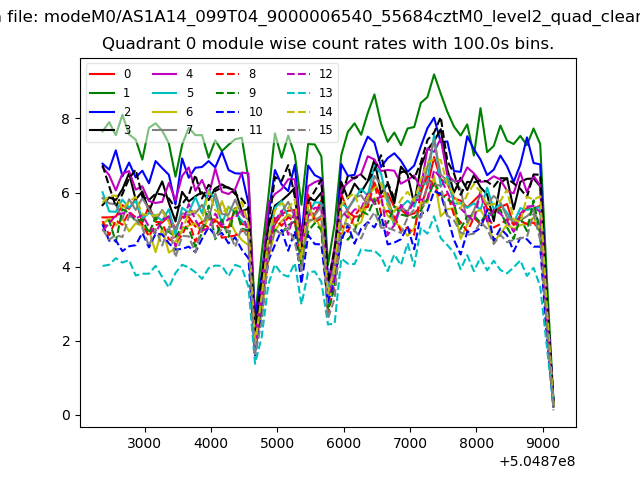 |
 |
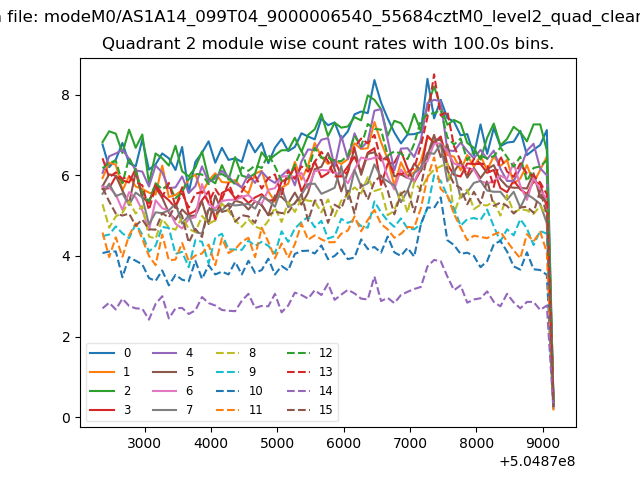
| Module-wise count rates for Quadrant B Data is divided into 100 sec bins |
 |
 |
| Module-wise count rates for Quadrant C Data is divided into 100 sec bins |
 |
 |
| Module-wise count rates for Quadrant D Data is divided into 100 sec bins |
 |
 |
| Parameter | Plot |
|---|---|
| CZT HV Monitor | 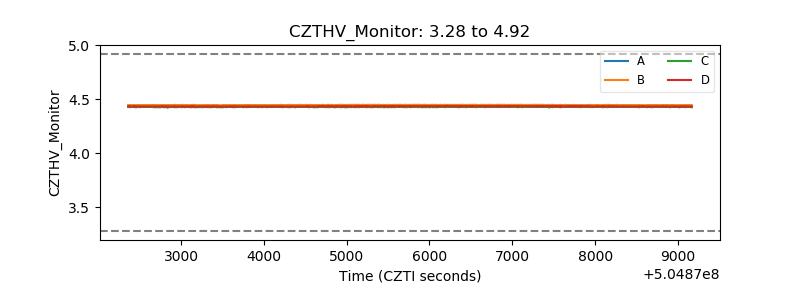 |
| D_VDD | 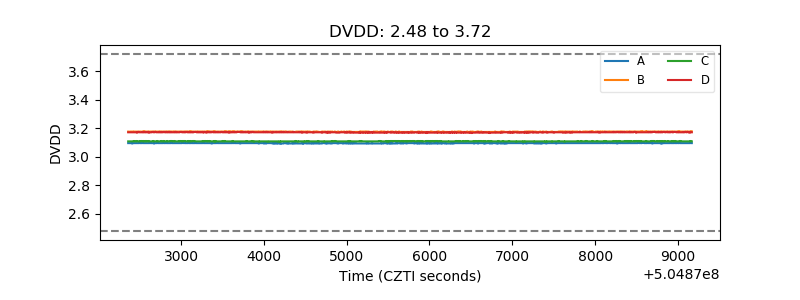 |
| Temperature 1 | 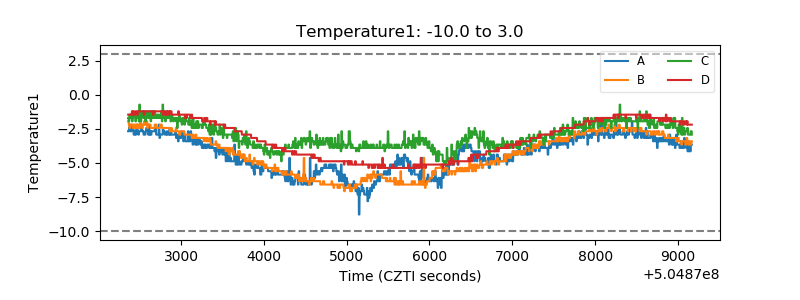 |
| Veto HV Monitor | 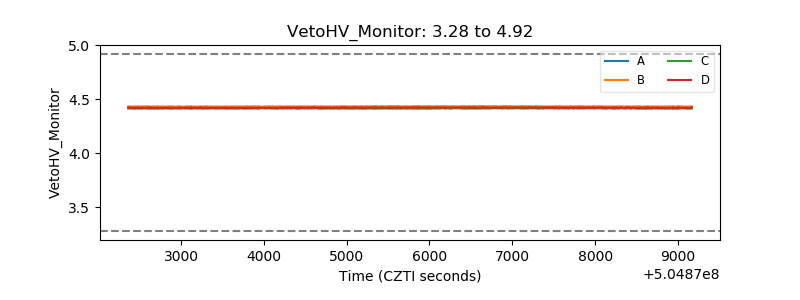 |
| Veto LLD | 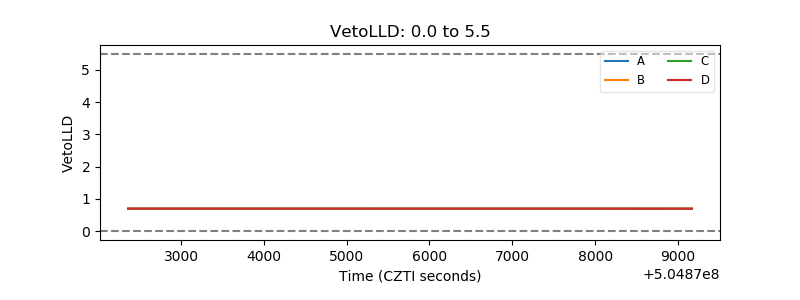 |
| Alpha Counter | 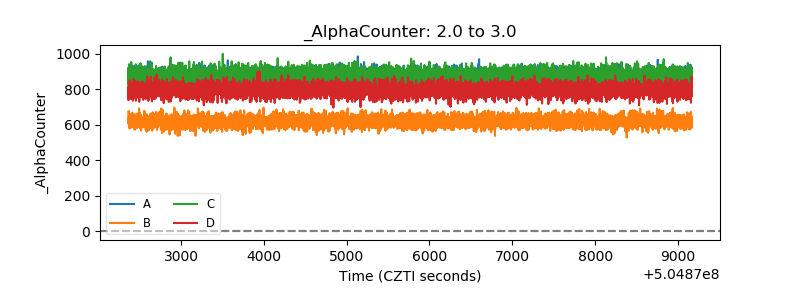 |
| _CPM_Rate | 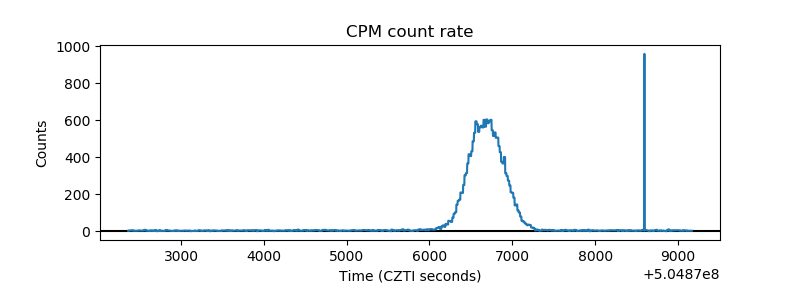 |
| CZT Counter | 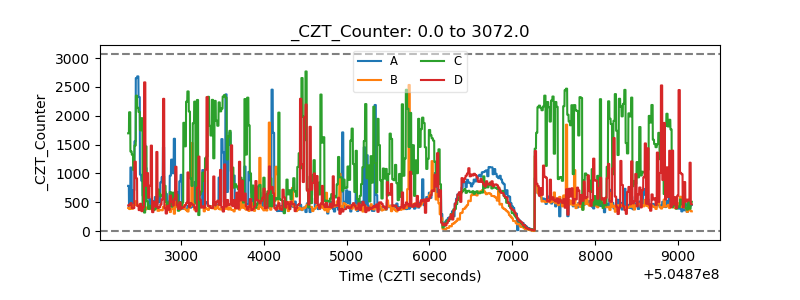 |
| +2.5 Volts monitor | 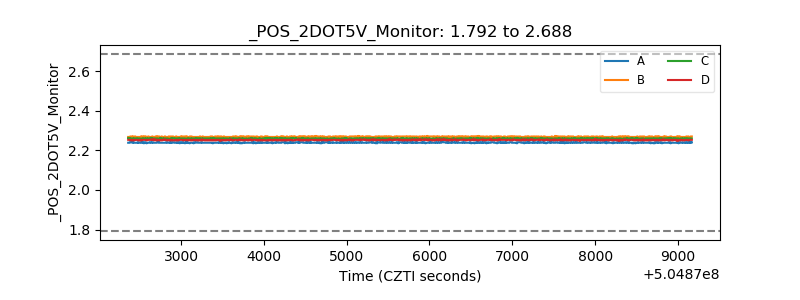 |
| +5 Volts monitor | 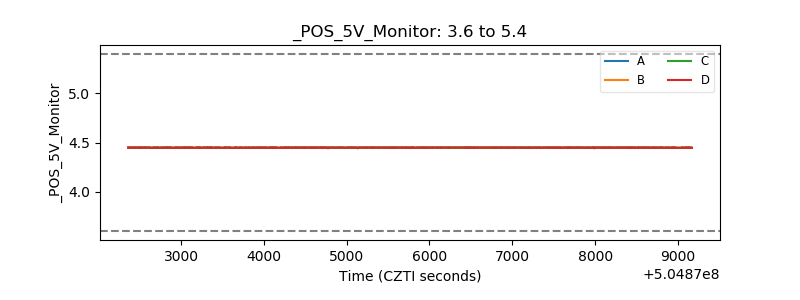 |
| _ROLL_ROT | 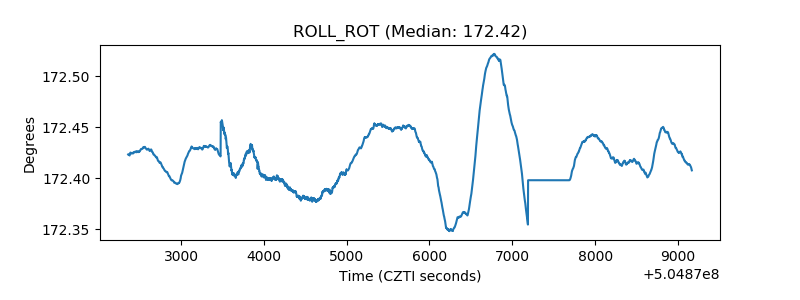 |
| _Roll_DEC | 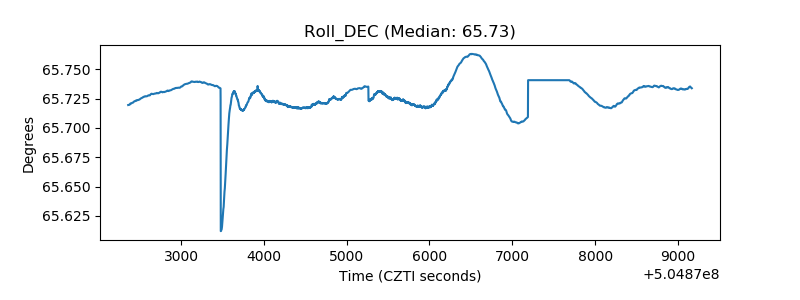 |
| _Roll_RA | 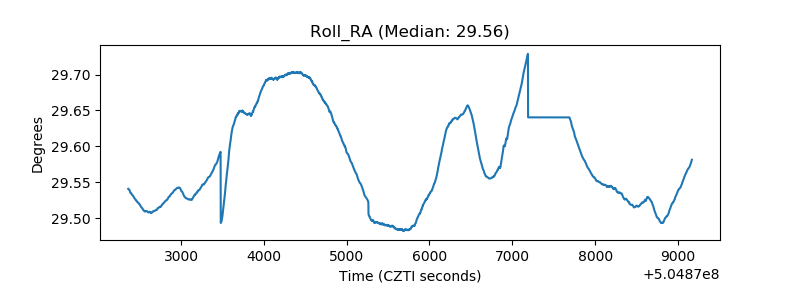 |
| Veto Counter | 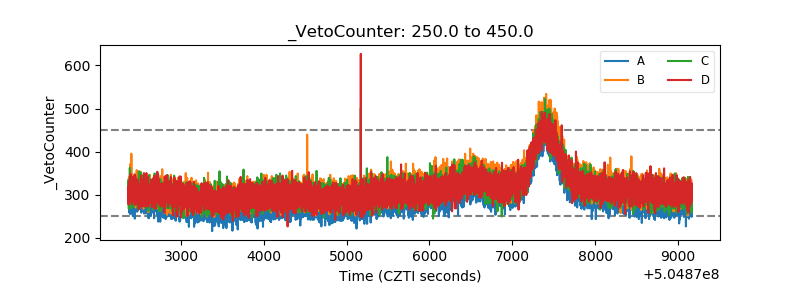 |