| Param | Original file | Final file |
|---|---|---|
| Filename | modeM0/AS1A14_099T04_9000006540_55687cztM0_level2.fits | modeM0/AS1A14_099T04_9000006540_55687cztM0_level2_quad_clean.evt |
| Size (bytes) | 1,421,856,000 | 250,116,480 |
| Size | 1.3 GB | 238.5 MB |
| Events in quadrant A | 16,568,724 | 1,463,300 |
| Events in quadrant B | 8,093,617 | 1,809,994 |
| Events in quadrant C | 9,334,490 | 1,620,414 |
| Events in quadrant D | 17,187,944 | 1,387,801 |
| Mode M0 | |||
|---|---|---|---|
| Quadrant | BADHDUFLAG | Total packets | Discarded packets |
| A | 0 | 62501 | 4 |
| B | 0 | 38715 | 4 |
| C | 0 | 41959 | 4 |
| D | 0 | 64261 | 4 |
| Mode M9 | |||
|---|---|---|---|
| Quadrant | BADHDUFLAG | Total packets | Discarded packets |
| A | 0 | 10 | 0 |
| B | 0 | 10 | 0 |
| C | 0 | 10 | 0 |
| D | 0 | 10 | 0 |
| Mode SS | |||
|---|---|---|---|
| Quadrant | BADHDUFLAG | Total packets | Discarded packets |
| A | 0 | 382 | 0 |
| B | 0 | 382 | 0 |
| C | 0 | 382 | 0 |
| D | 0 | 382 | 0 |
| Quadrant | Total seconds | Saturated seconds | Saturation percentage |
|---|---|---|---|
| A | 18721 | 2370 | 12.659580% |
| B | 18722 | 147 | 0.785173% |
| C | 18722 | 176 | 0.940071% |
| D | 18721 | 1915 | 10.229154% |
Noise dominated data is calculated using 1-second bins in cleaned event files. If a bin has >2000 counts, and if more than 50% of those come from <1% of pixels, then it is considered to be noise-dominated and hence unusable.
| Quadrant | # 1 sec bins | Bins with >0 counts | Bins with >2000 counts | High rate bins dominated by noise | Noise dominated (total time) | Noise dominated (detector-on time) | Marked lightcurve |
|---|---|---|---|---|---|---|---|
| A | 19971 | 18726 | 2365 | 2365 | 11.84% | 12.63% | 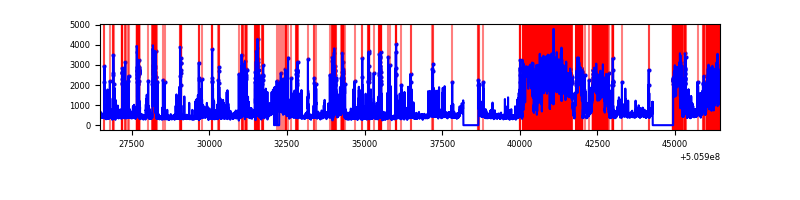 |
| B | 19972 | 18727 | 25 | 25 | 0.13% | 0.13% | 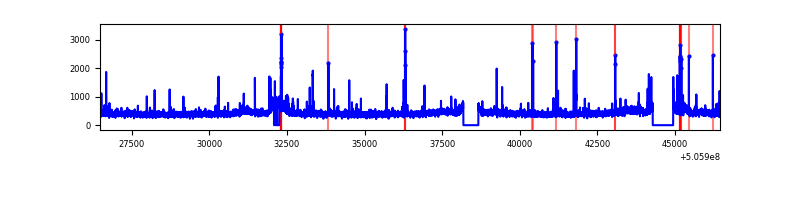 |
| C | 19971 | 18726 | 84 | 84 | 0.42% | 0.45% | 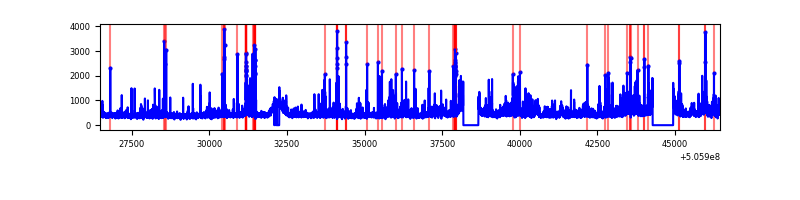 |
| D | 19971 | 18726 | 1678 | 1678 | 8.40% | 8.96% | 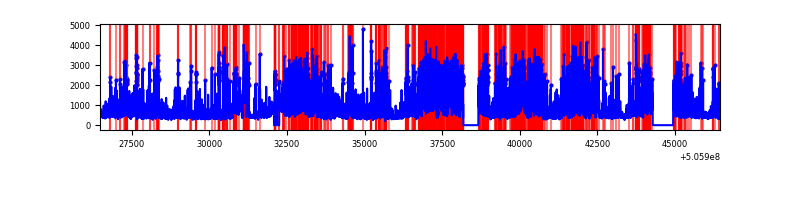 |
Top three noisy pixels from each quadrant. If the there are fewer than three noisy pixels in the level2.evt file, extra rows are filled as -1
| Pixel properties | Quadrant properties | ||||||
|---|---|---|---|---|---|---|---|
| Quadrant | DetID | PixID | Counts | Sigma | Mean | Median | Sigma |
| A | 12 | 115 | 6010499 | 13275.33 | 1839 | 1790 | 452.6 |
| A | 7 | 64 | 2647435 | 5845.15 | 1839 | 1790 | 452.6 |
| A | 15 | 32 | 269246 | 590.9 | 1839 | 1790 | 452.6 |
| B | 5 | 172 | 164680 | 399.51 | 1902 | 1828 | 407.6 |
| B | 4 | 206 | 152875 | 370.55 | 1902 | 1828 | 407.6 |
| B | 10 | 247 | 90316 | 217.08 | 1902 | 1828 | 407.6 |
| C | 9 | 38 | 1101996 | 2135.15 | 1888 | 1868 | 515.2 |
| C | 13 | 3 | 351609 | 678.78 | 1888 | 1868 | 515.2 |
| C | 12 | 252 | 164031 | 314.73 | 1888 | 1868 | 515.2 |
| D | 11 | 129 | 8022171 | 15651.81 | 1810 | 1727 | 512.4 |
| D | 10 | 181 | 641579 | 1248.66 | 1810 | 1727 | 512.4 |
| D | 8 | 245 | 599819 | 1167.17 | 1810 | 1727 | 512.4 |
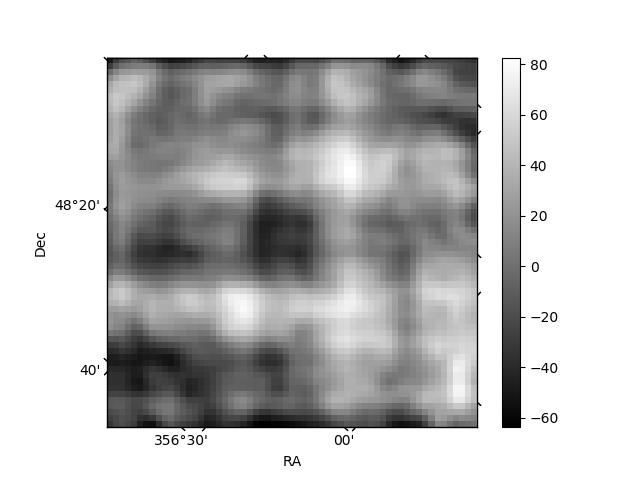
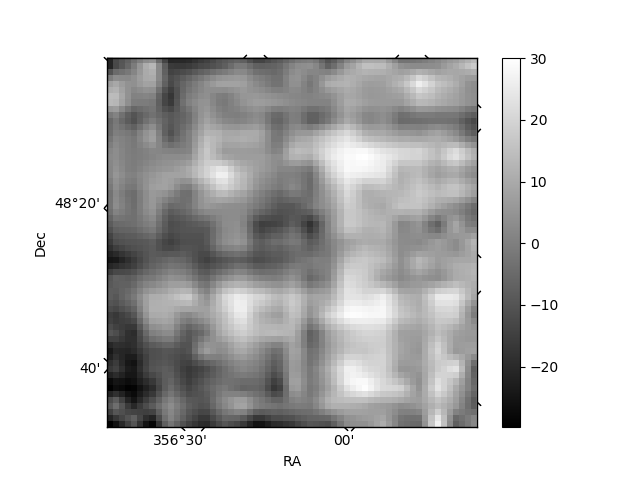
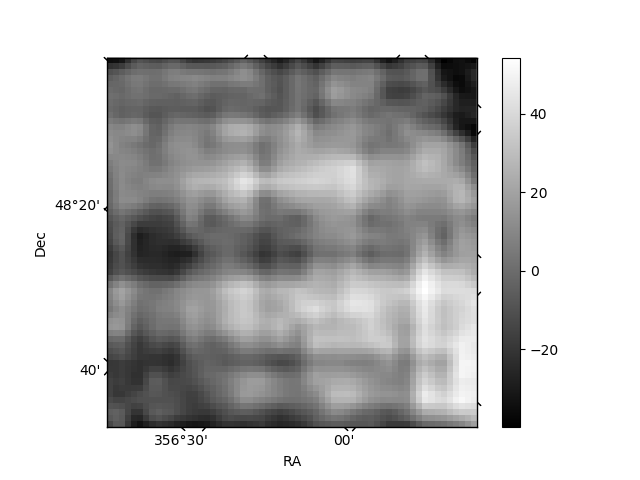
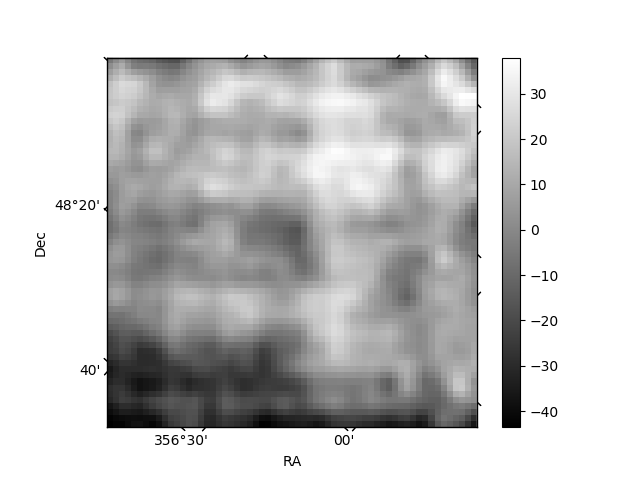
Histogram calculated using DETX and DETY for each event in the final _common_clean file
| Quadrant A | 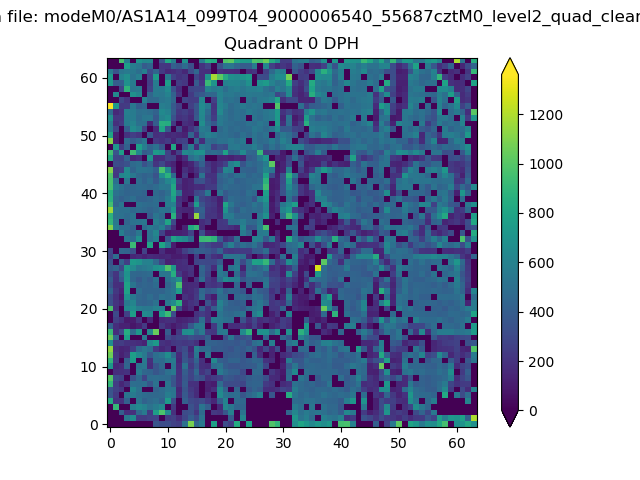 |
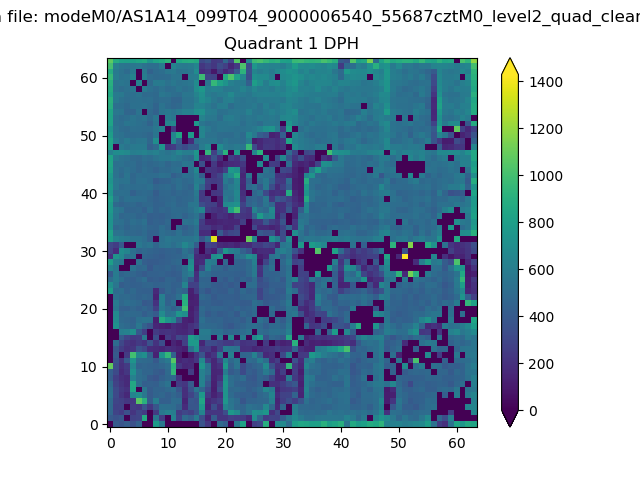 |
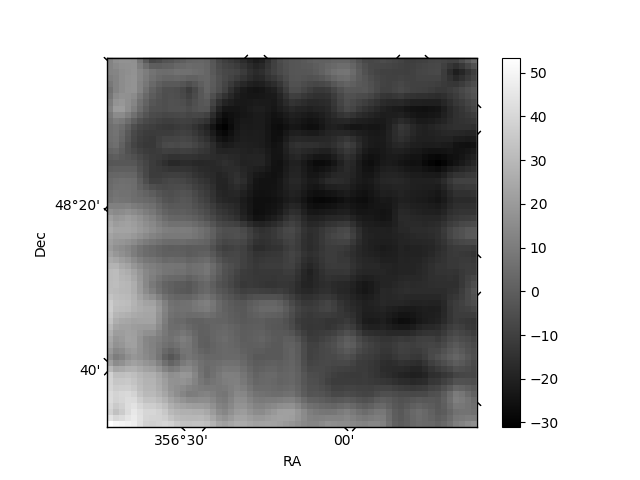
Quadrant B |
|---|---|---|---|
| Quadrant D | 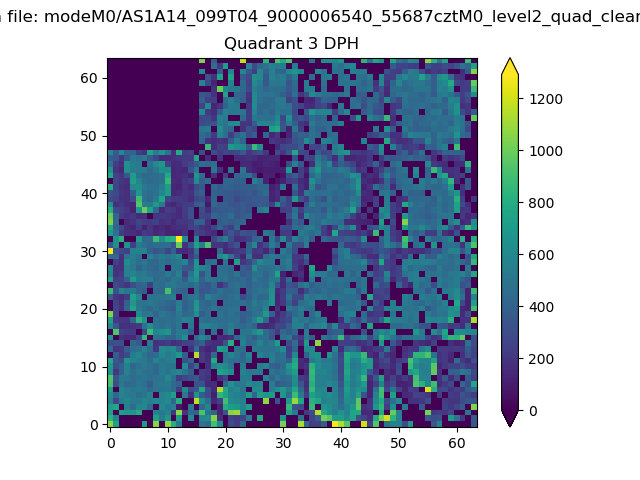 |
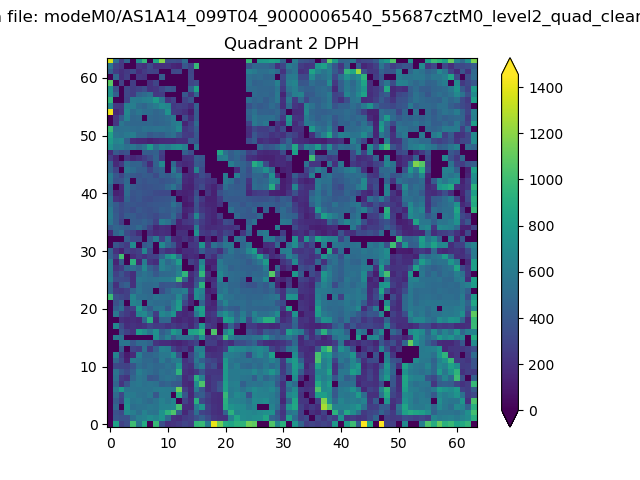 |
Quadrant C |
| Plot type | Count rate plots | Images |
|---|---|---|
| Comparison with Poisson distribution Blue bars denote a histogram of data divided into 1 sec bins. Red curve is a Poisson curve with rate = median count rate of data. |
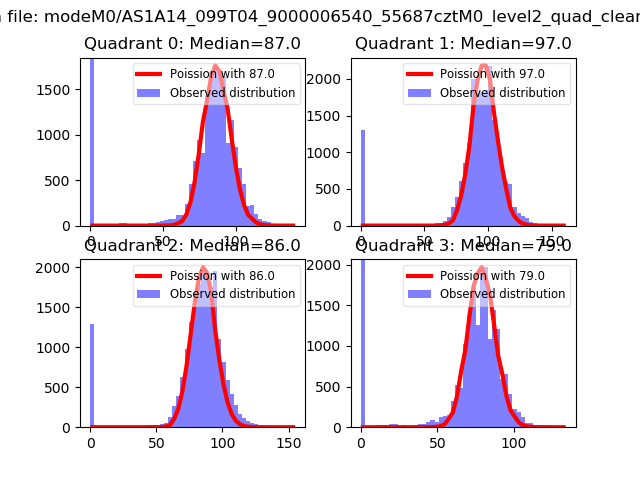 |
 |
| Quadrant-wise count rates Data is divided into 100 sec bins |
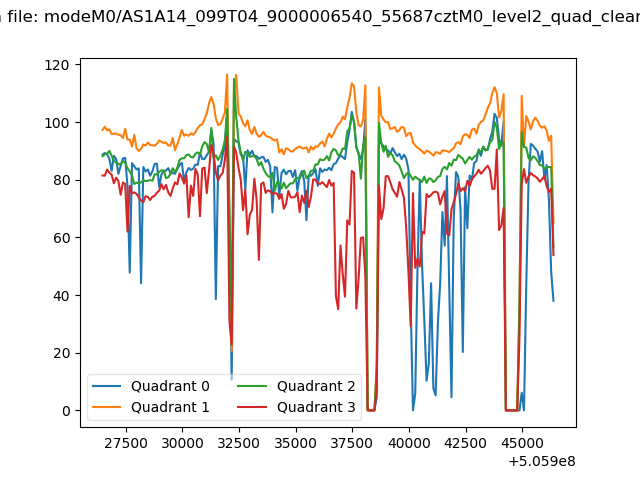 |
|
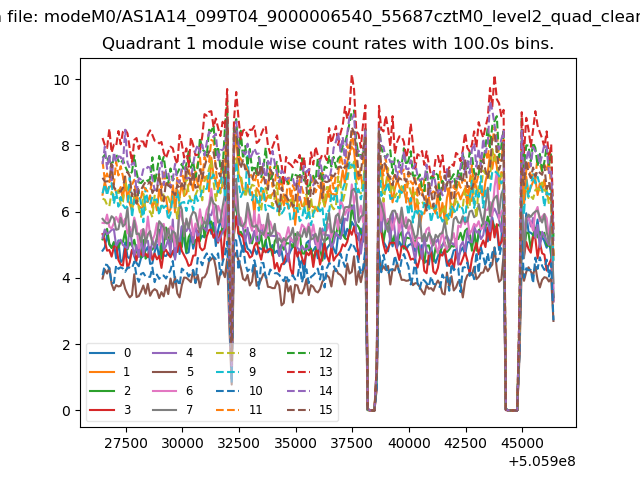
| Module-wise count rates for Quadrant A Data is divided into 100 sec bins |
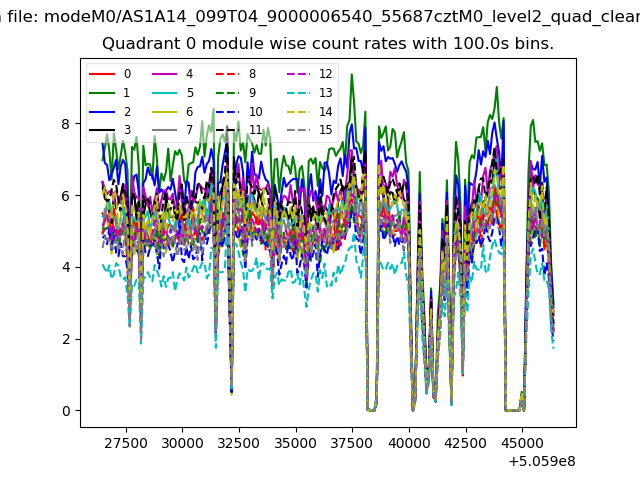 |
 |
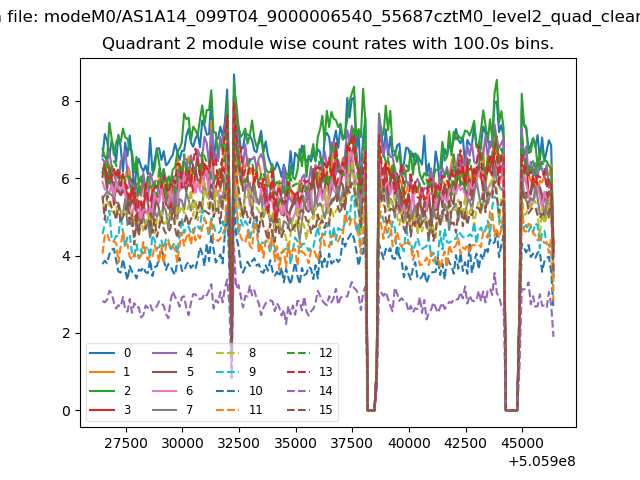
| Module-wise count rates for Quadrant B Data is divided into 100 sec bins |
 |
 |
| Module-wise count rates for Quadrant C Data is divided into 100 sec bins |
 |
 |
| Module-wise count rates for Quadrant D Data is divided into 100 sec bins |
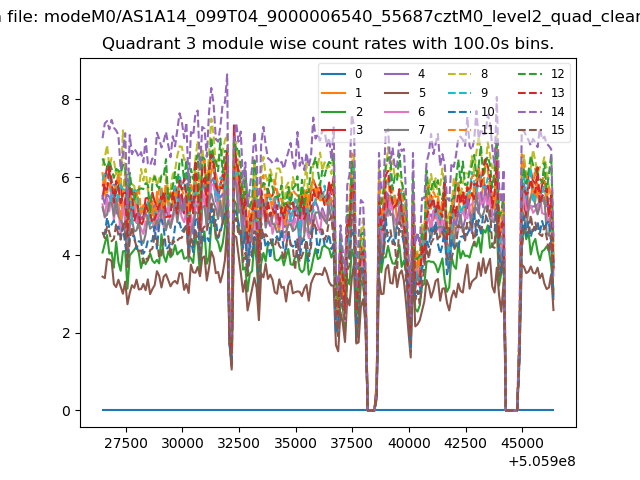 |
 |
| Parameter | Plot |
|---|---|
| CZT HV Monitor | 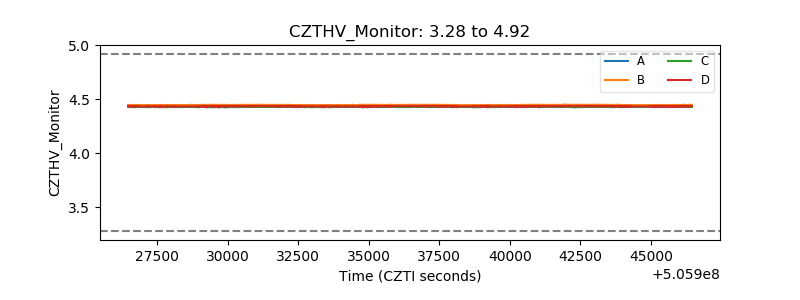 |
| D_VDD | 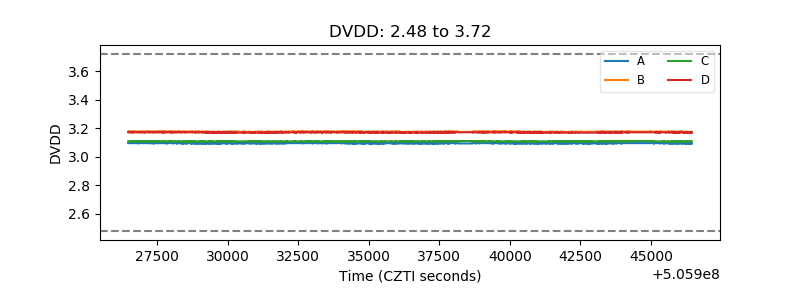 |
| Temperature 1 | 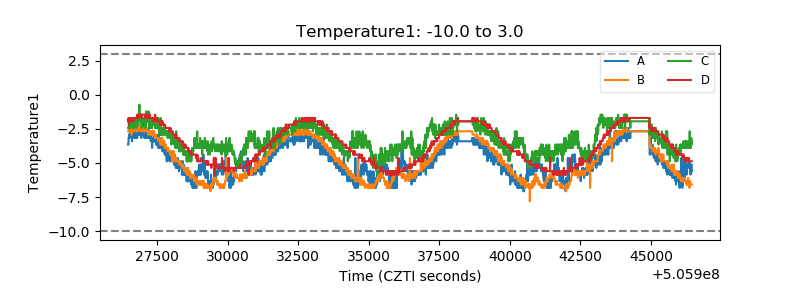 |
| Veto HV Monitor | 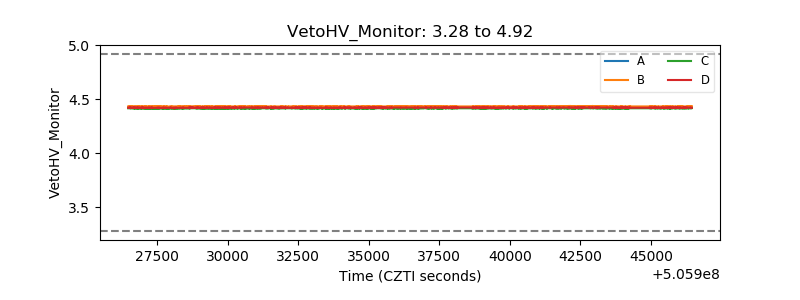 |
| Veto LLD | 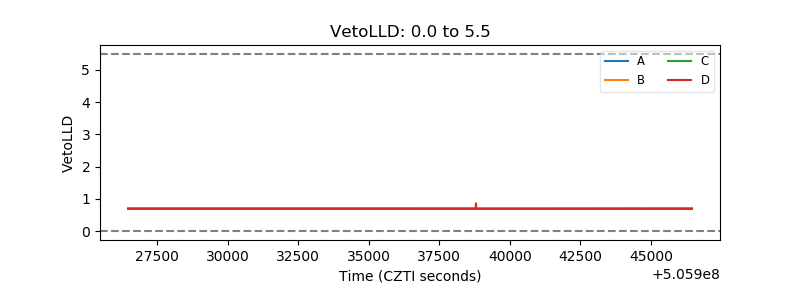 |
| Alpha Counter | 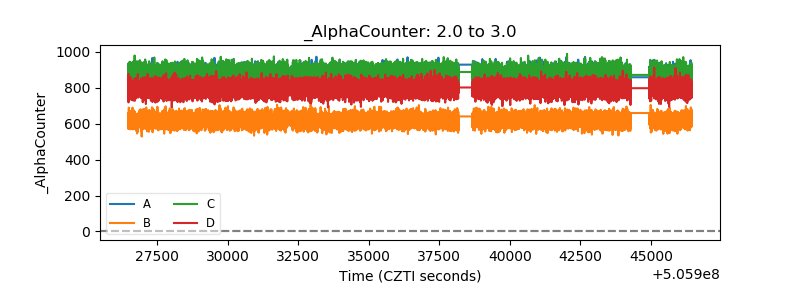 |
| _CPM_Rate | 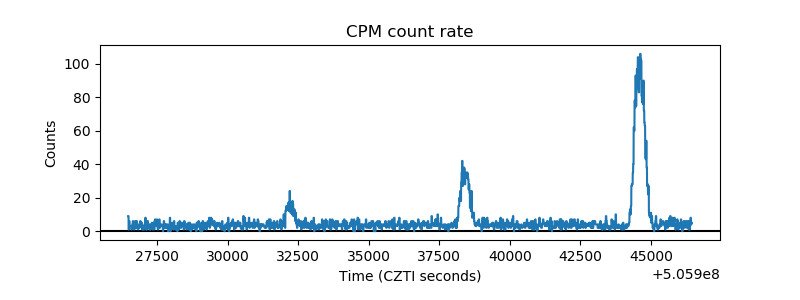 |
| CZT Counter | 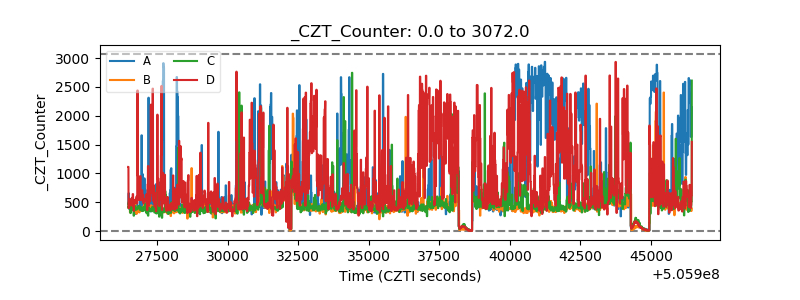 |
| +2.5 Volts monitor |  |
| +5 Volts monitor |  |
| _ROLL_ROT | 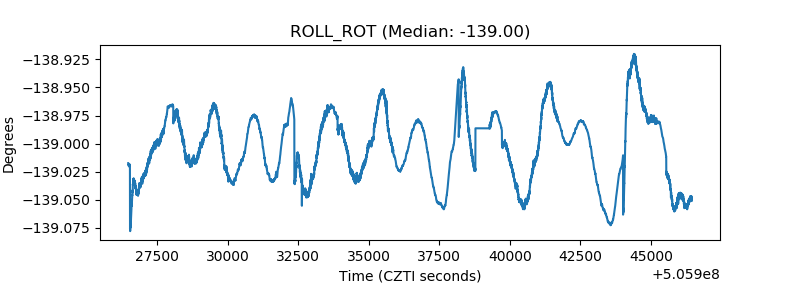 |
| _Roll_DEC | 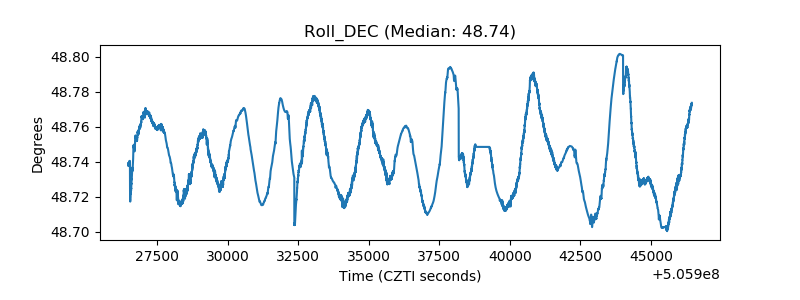 |
| _Roll_RA | 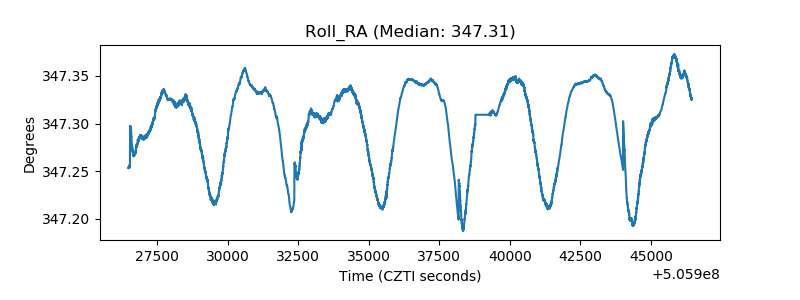 |
| Veto Counter | 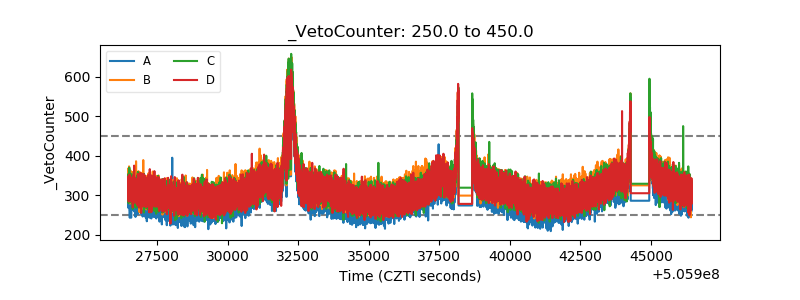 |