| Param | Original file | Final file |
|---|---|---|
| Filename | modeM0/AS1A14_099T04_9000006540_55688cztM0_level2.fits | modeM0/AS1A14_099T04_9000006540_55688cztM0_level2_quad_clean.evt |
| Size (bytes) | 652,262,400 | 92,658,240 |
| Size | 622.0 MB | 88.4 MB |
| Events in quadrant A | 11,167,688 | 470,594 |
| Events in quadrant B | 3,184,603 | 683,639 |
| Events in quadrant C | 4,236,435 | 603,501 |
| Events in quadrant D | 5,015,678 | 561,311 |
| Mode M0 | |||
|---|---|---|---|
| Quadrant | BADHDUFLAG | Total packets | Discarded packets |
| A | 0 | 38027 | 2 |
| B | 0 | 14669 | 2 |
| C | 0 | 17544 | 2 |
| D | 0 | 19895 | 3 |
| Mode M9 | |||
|---|---|---|---|
| Quadrant | BADHDUFLAG | Total packets | Discarded packets |
| A | 0 | 12 | 0 |
| B | 0 | 13 | 0 |
| C | 0 | 13 | 0 |
| D | 0 | 13 | 0 |
| Mode SS | |||
|---|---|---|---|
| Quadrant | BADHDUFLAG | Total packets | Discarded packets |
| A | 0 | 144 | 0 |
| B | 0 | 144 | 0 |
| C | 0 | 144 | 0 |
| D | 0 | 144 | 0 |
| Quadrant | Total seconds | Saturated seconds | Saturation percentage |
|---|---|---|---|
| A | 6973 | 2129 | 30.532052% |
| B | 6973 | 43 | 0.616664% |
| C | 6973 | 185 | 2.653090% |
| D | 6972 | 320 | 4.589788% |
Noise dominated data is calculated using 1-second bins in cleaned event files. If a bin has >2000 counts, and if more than 50% of those come from <1% of pixels, then it is considered to be noise-dominated and hence unusable.
| Quadrant | # 1 sec bins | Bins with >0 counts | Bins with >2000 counts | High rate bins dominated by noise | Noise dominated (total time) | Noise dominated (detector-on time) | Marked lightcurve |
|---|---|---|---|---|---|---|---|
| A | 7838 | 6974 | 2228 | 2228 | 28.43% | 31.95% | 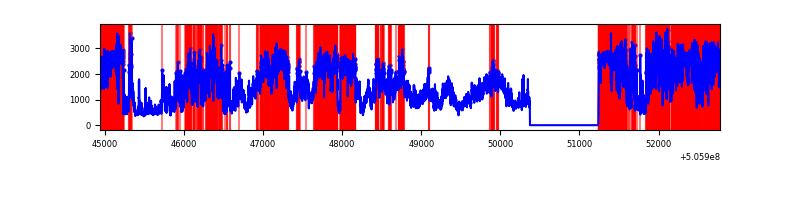 |
| B | 7838 | 6974 | 11 | 11 | 0.14% | 0.16% | 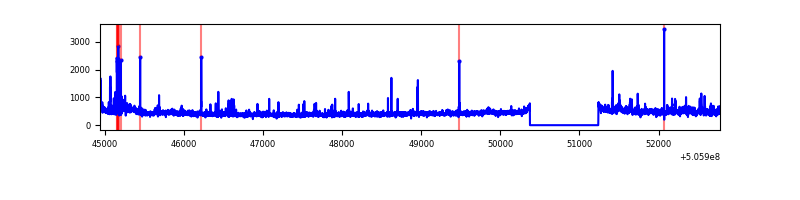 |
| C | 7838 | 6974 | 155 | 155 | 1.98% | 2.22% | 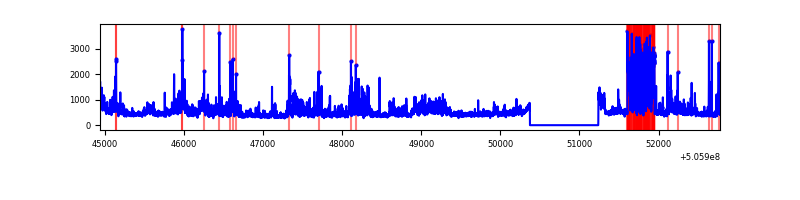 |
| D | 7837 | 6973 | 297 | 297 | 3.79% | 4.26% | 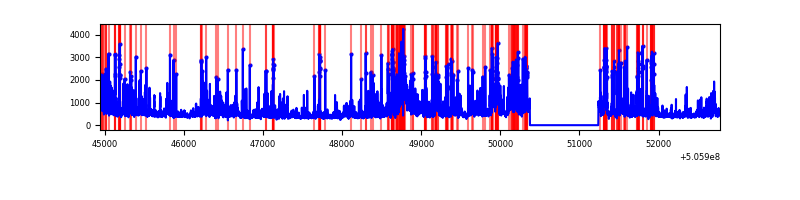 |
Top three noisy pixels from each quadrant. If the there are fewer than three noisy pixels in the level2.evt file, extra rows are filled as -1
| Pixel properties | Quadrant properties | ||||||
|---|---|---|---|---|---|---|---|
| Quadrant | DetID | PixID | Counts | Sigma | Mean | Median | Sigma |
| A | 12 | 115 | 8144237 | 51129.65 | 641 | 623 | 159.3 |
| A | 7 | 64 | 180819 | 1131.36 | 641 | 623 | 159.3 |
| A | 0 | 8 | 163328 | 1021.54 | 641 | 623 | 159.3 |
| B | 4 | 206 | 126927 | 810.42 | 712 | 684 | 155.8 |
| B | 5 | 172 | 110439 | 704.58 | 712 | 684 | 155.8 |
| B | 0 | 199 | 53716 | 340.44 | 712 | 684 | 155.8 |
| C | 9 | 38 | 800551 | 4073.75 | 704 | 695 | 196.3 |
| C | 15 | 147 | 547418 | 2784.52 | 704 | 695 | 196.3 |
| C | 13 | 3 | 53705 | 269.99 | 704 | 695 | 196.3 |
| D | 11 | 129 | 1494640 | 7549.89 | 693 | 662 | 197.9 |
| D | 8 | 245 | 409608 | 2066.63 | 693 | 662 | 197.9 |
| D | 10 | 181 | 202855 | 1021.79 | 693 | 662 | 197.9 |
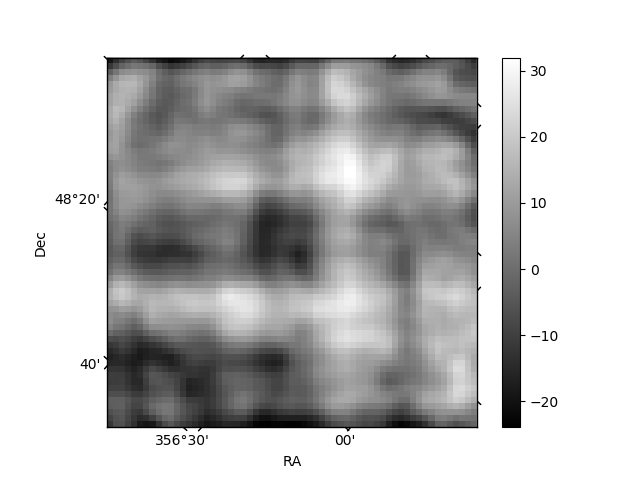
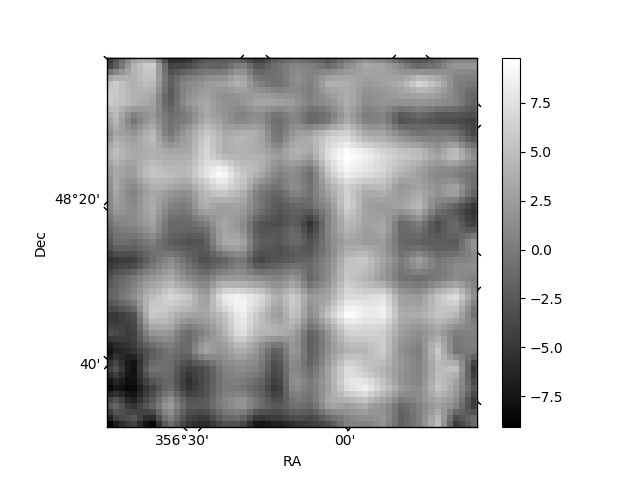
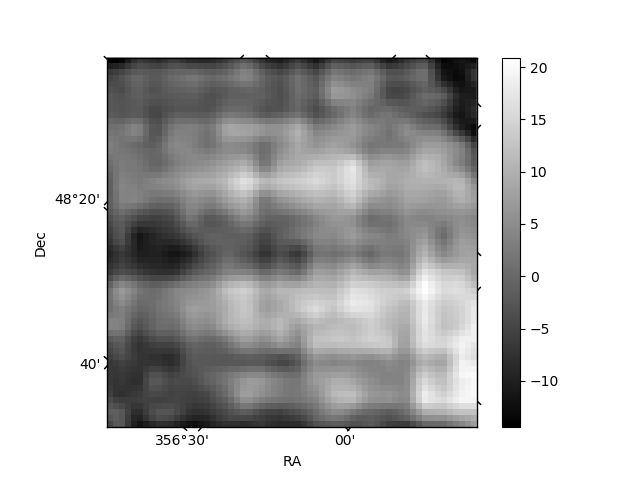
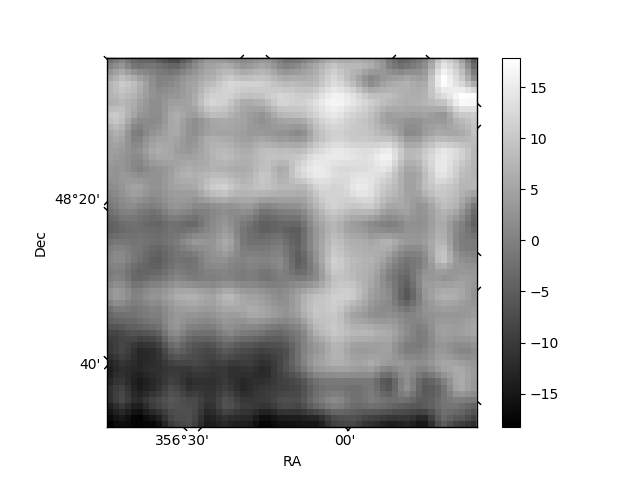
Histogram calculated using DETX and DETY for each event in the final _common_clean file
| Quadrant A | 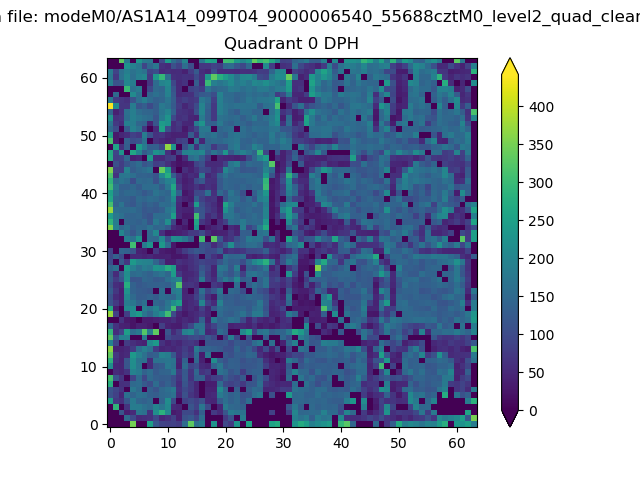 |
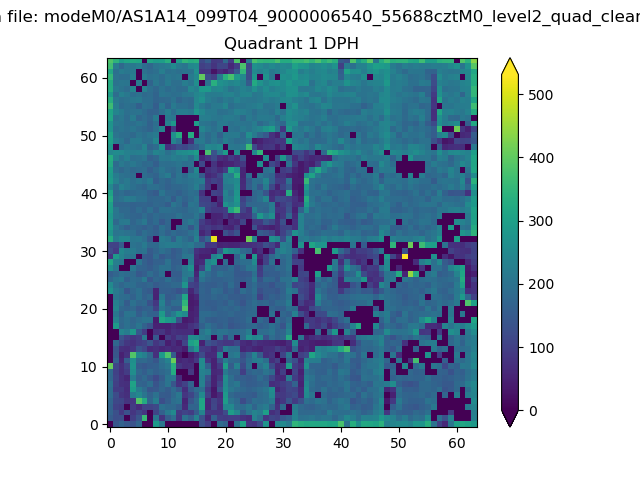 |
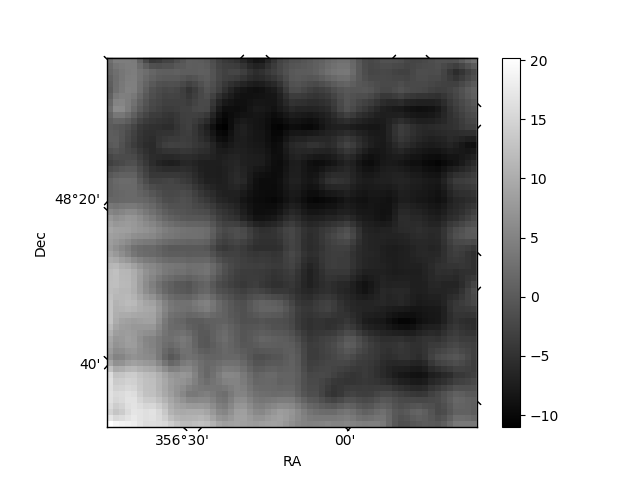
Quadrant B |
|---|---|---|---|
| Quadrant D | 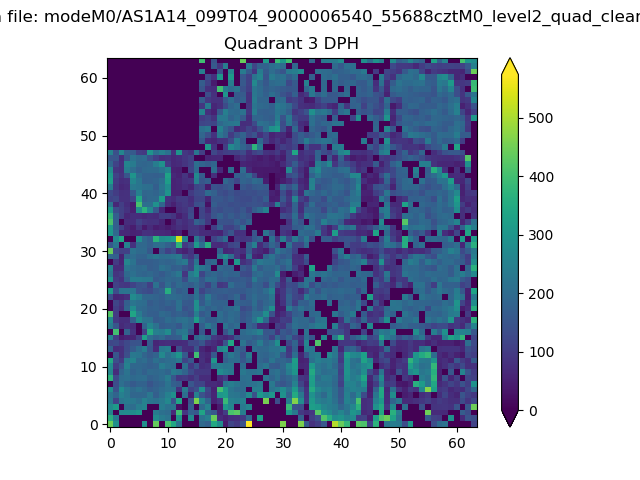 |
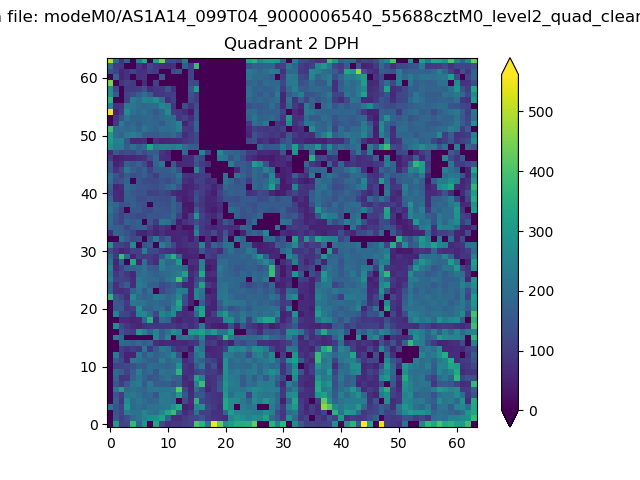 |
Quadrant C |
| Plot type | Count rate plots | Images |
|---|---|---|
| Comparison with Poisson distribution Blue bars denote a histogram of data divided into 1 sec bins. Red curve is a Poisson curve with rate = median count rate of data. |
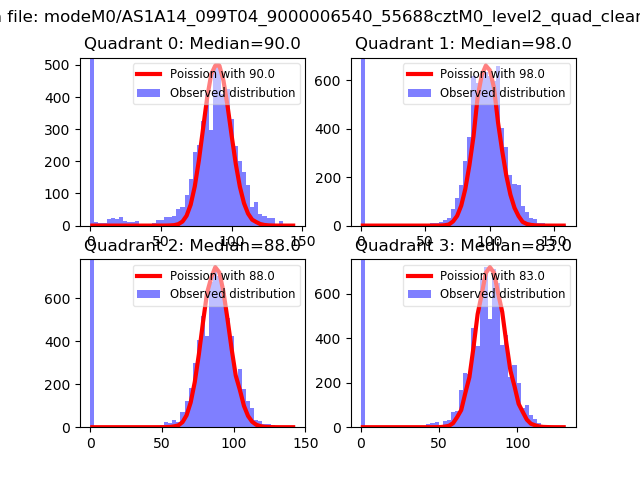 |
 |
| Quadrant-wise count rates Data is divided into 100 sec bins |
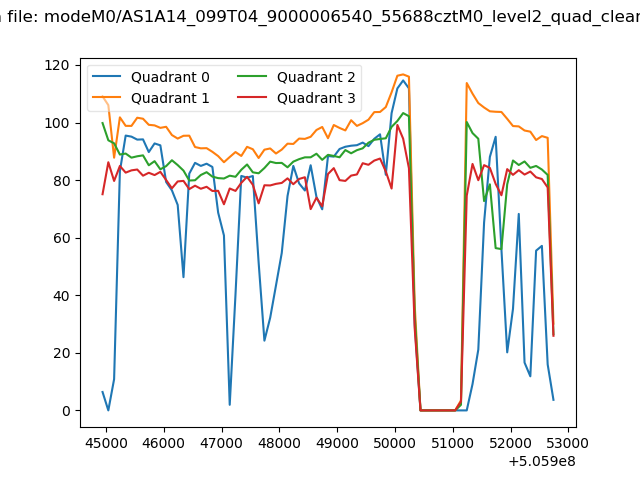 |
|
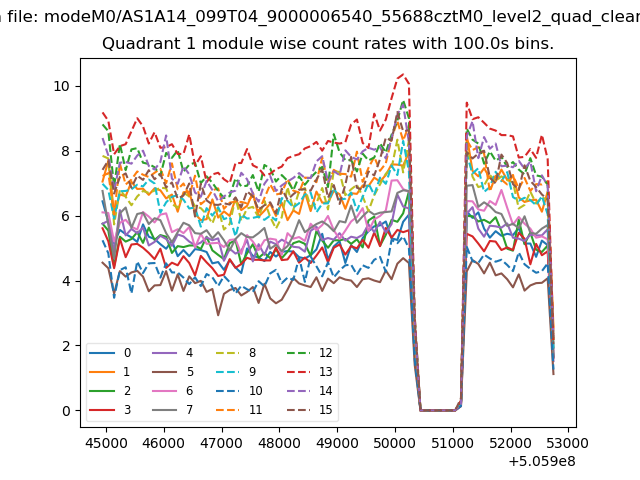
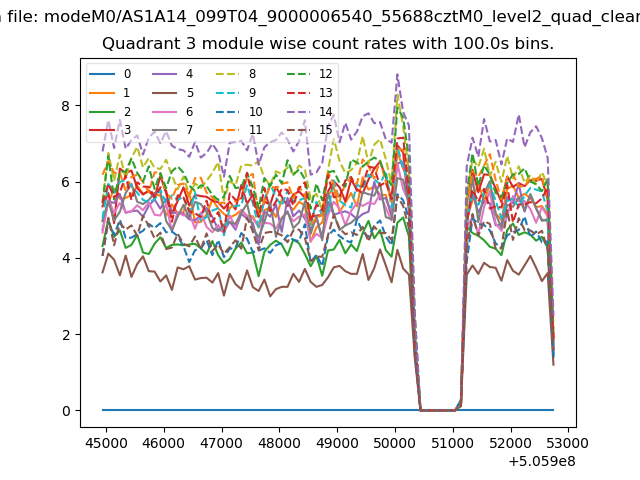
| Module-wise count rates for Quadrant A Data is divided into 100 sec bins |
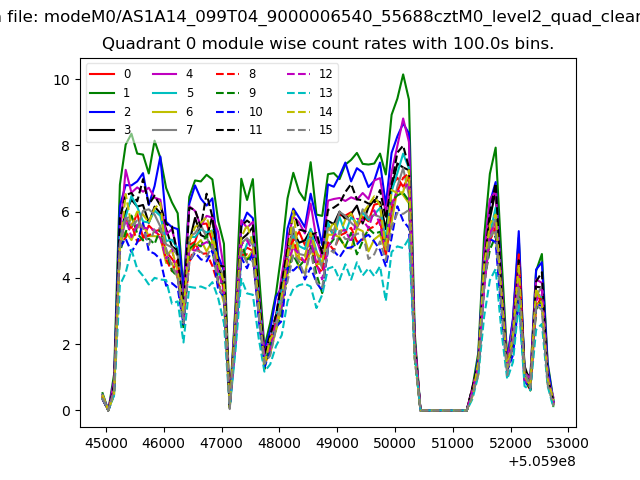 |
 |
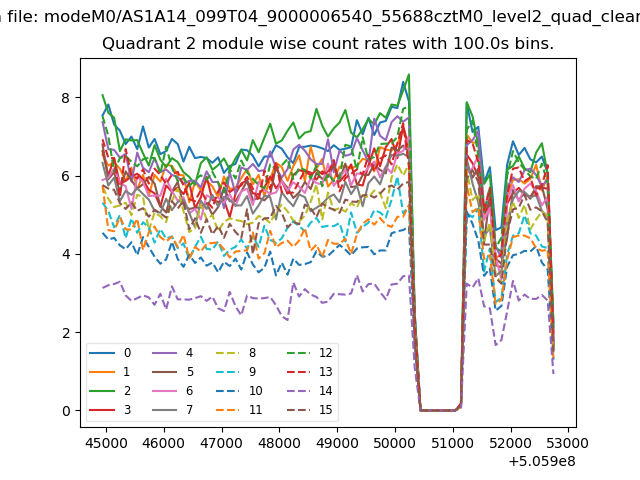
| Module-wise count rates for Quadrant B Data is divided into 100 sec bins |
 |
 |
| Module-wise count rates for Quadrant C Data is divided into 100 sec bins |
 |
 |
| Module-wise count rates for Quadrant D Data is divided into 100 sec bins |
 |
 |
| Parameter | Plot |
|---|---|
| CZT HV Monitor | 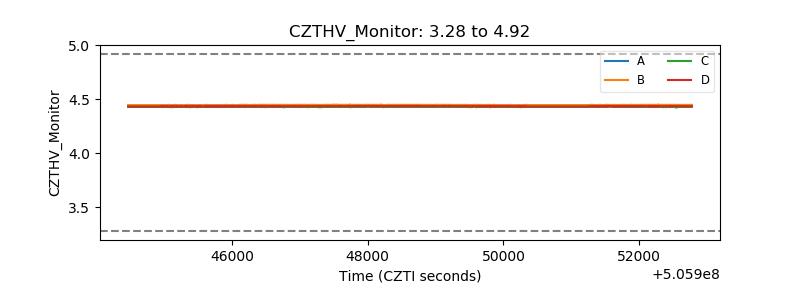 |
| D_VDD | 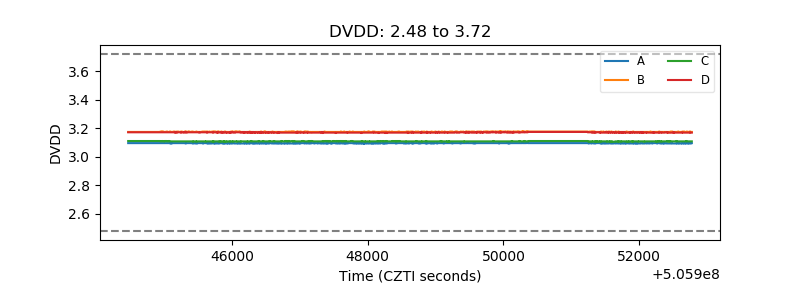 |
| Temperature 1 | 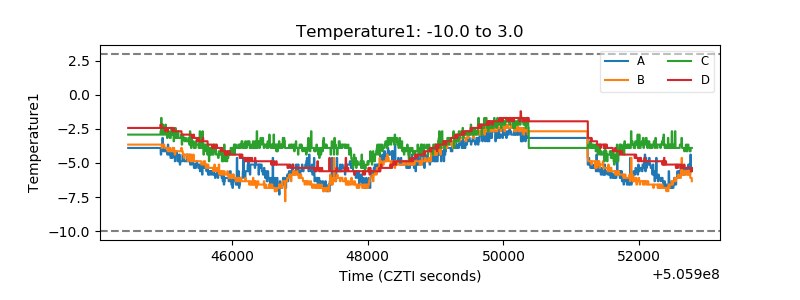 |
| Veto HV Monitor | 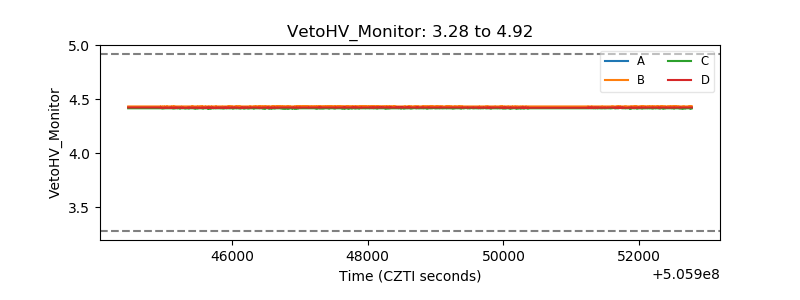 |
| Veto LLD | 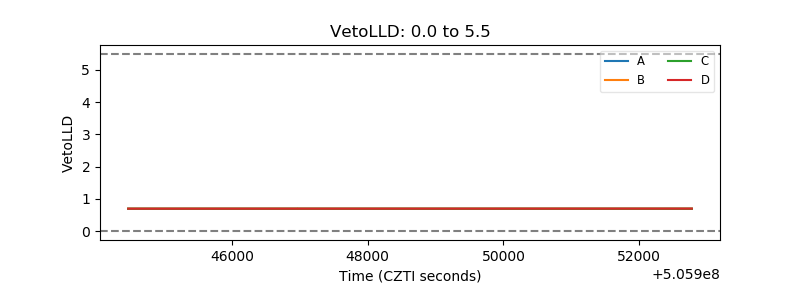 |
| Alpha Counter | 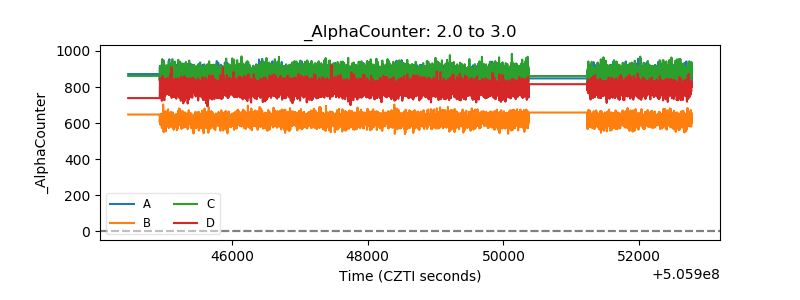 |
| _CPM_Rate | 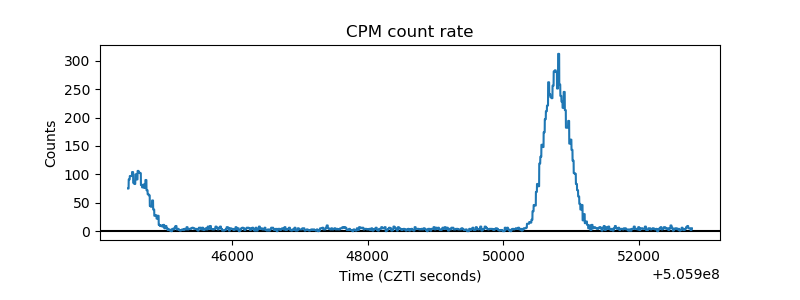 |
| CZT Counter | 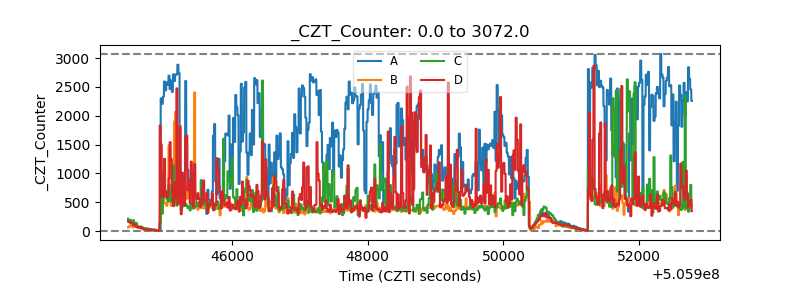 |
| +2.5 Volts monitor |  |
| +5 Volts monitor |  |
| _ROLL_ROT | 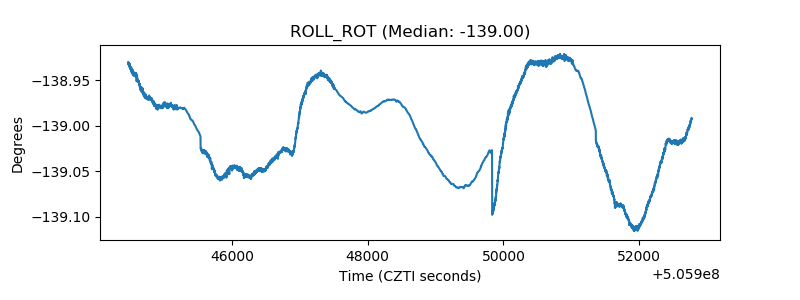 |
| _Roll_DEC | 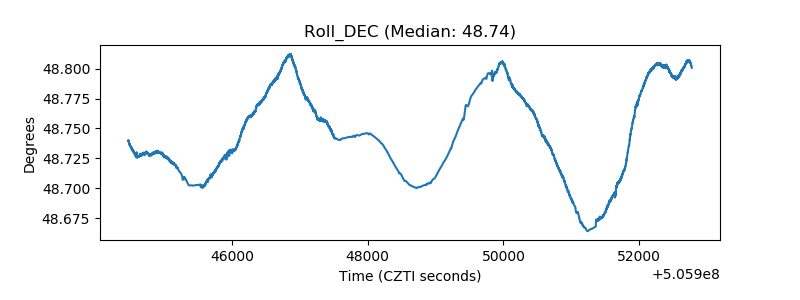 |
| _Roll_RA | 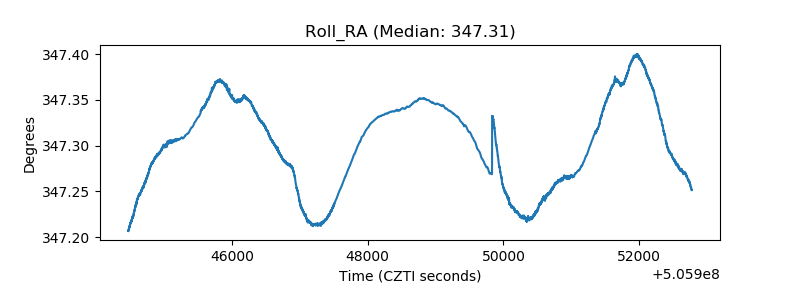 |
| Veto Counter | 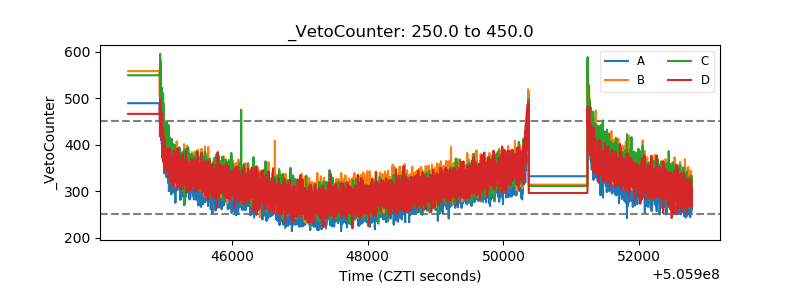 |