| Param | Original file | Final file |
|---|---|---|
| Filename | modeM0/AS1A14_099T04_9000006540_55690cztM0_level2.fits | modeM0/AS1A14_099T04_9000006540_55690cztM0_level2_quad_clean.evt |
| Size (bytes) | 567,037,440 | 94,844,160 |
| Size | 540.8 MB | 90.5 MB |
| Events in quadrant A | 7,195,740 | 539,293 |
| Events in quadrant B | 4,019,192 | 681,940 |
| Events in quadrant C | 4,240,818 | 606,943 |
| Events in quadrant D | 4,999,112 | 563,124 |
| Mode M0 | |||
|---|---|---|---|
| Quadrant | BADHDUFLAG | Total packets | Discarded packets |
| A | 0 | 26153 | 2 |
| B | 0 | 16702 | 2 |
| C | 0 | 17395 | 4 |
| D | 0 | 19919 | 2 |
| Mode M9 | |||
|---|---|---|---|
| Quadrant | BADHDUFLAG | Total packets | Discarded packets |
| A | 0 | 18 | 0 |
| B | 0 | 18 | 0 |
| C | 0 | 18 | 0 |
| D | 0 | 18 | 0 |
| Mode SS | |||
|---|---|---|---|
| Quadrant | BADHDUFLAG | Total packets | Discarded packets |
| A | 0 | 142 | 0 |
| B | 0 | 142 | 0 |
| C | 0 | 142 | 0 |
| D | 0 | 142 | 0 |
| Quadrant | Total seconds | Saturated seconds | Saturation percentage |
|---|---|---|---|
| A | 6894 | 1246 | 18.073687% |
| B | 6894 | 127 | 1.842182% |
| C | 6894 | 254 | 3.684363% |
| D | 6894 | 386 | 5.599072% |
Noise dominated data is calculated using 1-second bins in cleaned event files. If a bin has >2000 counts, and if more than 50% of those come from <1% of pixels, then it is considered to be noise-dominated and hence unusable.
| Quadrant | # 1 sec bins | Bins with >0 counts | Bins with >2000 counts | High rate bins dominated by noise | Noise dominated (total time) | Noise dominated (detector-on time) | Marked lightcurve |
|---|---|---|---|---|---|---|---|
| A | 8759 | 6895 | 1255 | 1255 | 14.33% | 18.20% | 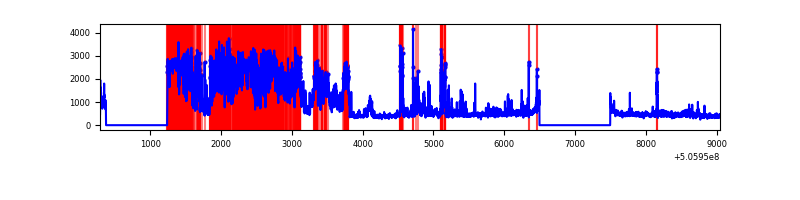 |
| B | 8759 | 6896 | 59 | 59 | 0.67% | 0.86% | 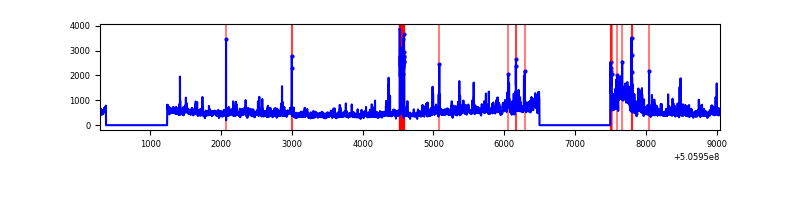 |
| C | 8759 | 6896 | 216 | 216 | 2.47% | 3.13% | 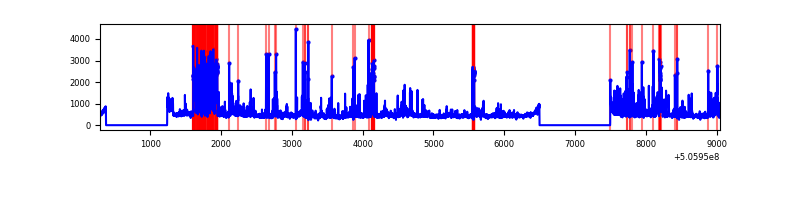 |
| D | 8759 | 6896 | 362 | 362 | 4.13% | 5.25% | 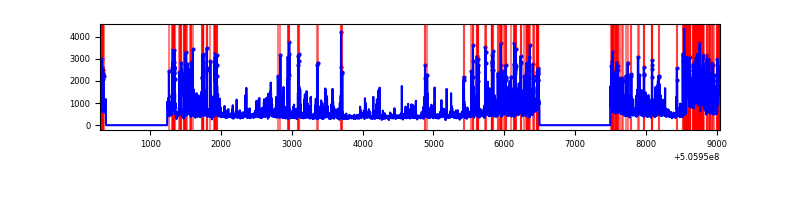 |
Top three noisy pixels from each quadrant. If the there are fewer than three noisy pixels in the level2.evt file, extra rows are filled as -1
| Pixel properties | Quadrant properties | ||||||
|---|---|---|---|---|---|---|---|
| Quadrant | DetID | PixID | Counts | Sigma | Mean | Median | Sigma |
| A | 12 | 115 | 3866142 | 23223.39 | 675 | 656 | 166.4 |
| A | 0 | 8 | 315044 | 1888.8 | 675 | 656 | 166.4 |
| A | 3 | 95 | 129034 | 771.28 | 675 | 656 | 166.4 |
| B | 4 | 206 | 462288 | 3024.5 | 710 | 686 | 152.6 |
| B | 5 | 236 | 417432 | 2730.59 | 710 | 686 | 152.6 |
| B | 0 | 143 | 113868 | 741.59 | 710 | 686 | 152.6 |
| C | 15 | 147 | 834554 | 4279.66 | 701 | 693 | 194.8 |
| C | 9 | 38 | 460672 | 2360.77 | 701 | 693 | 194.8 |
| C | 10 | 19 | 60903 | 309.02 | 701 | 693 | 194.8 |
| D | 11 | 129 | 1186924 | 6022.18 | 688 | 656 | 197.0 |
| D | 10 | 181 | 508134 | 2576.25 | 688 | 656 | 197.0 |
| D | 8 | 245 | 297617 | 1507.54 | 688 | 656 | 197.0 |
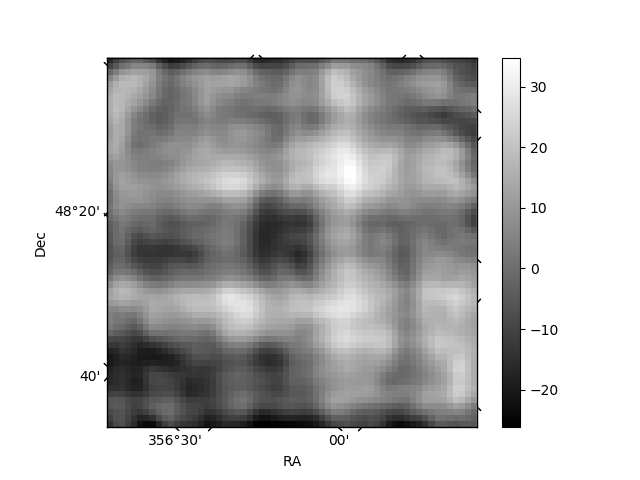
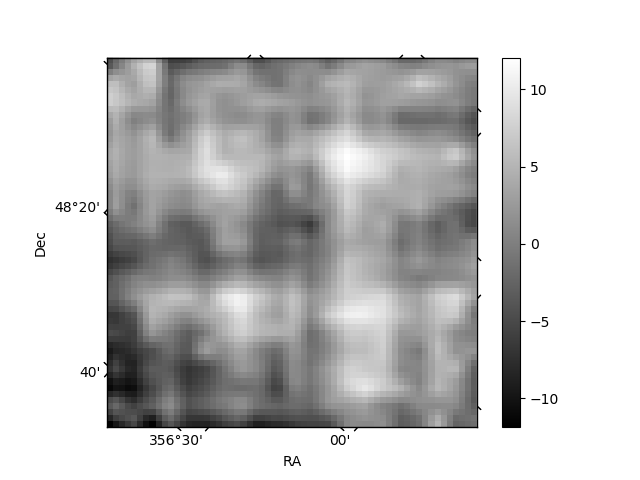
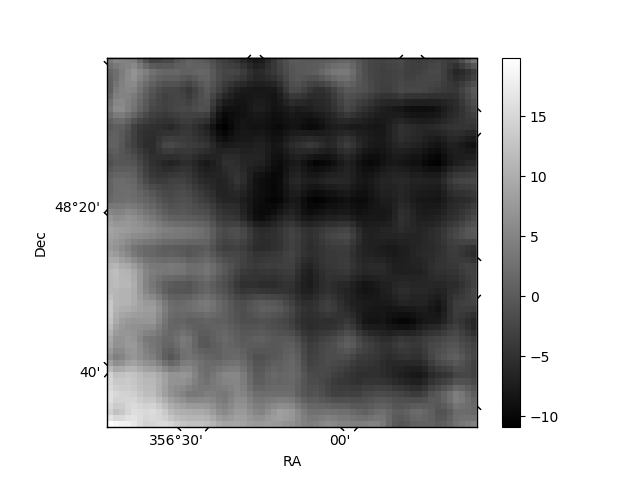
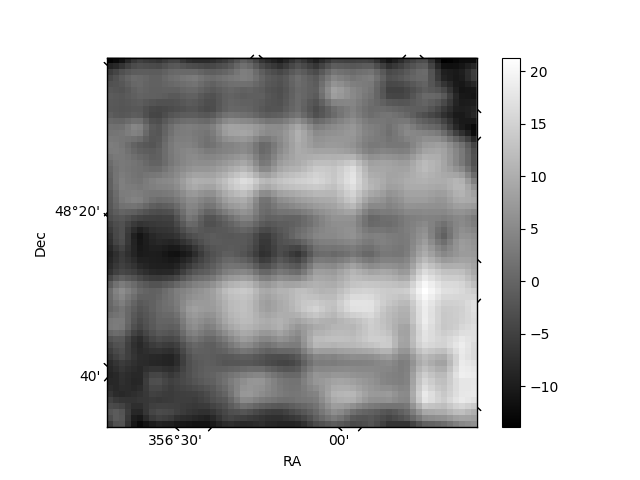
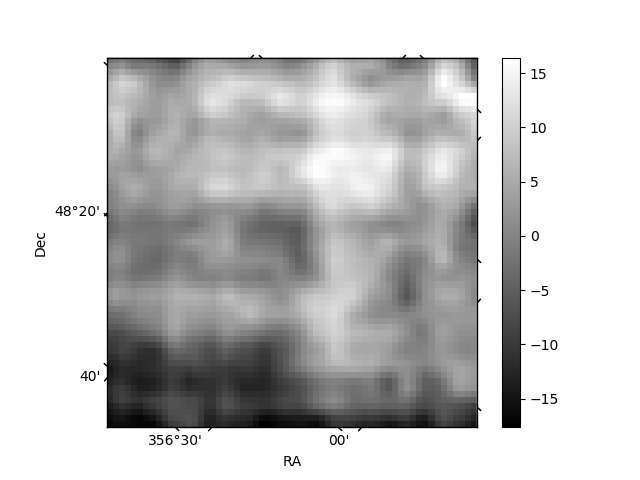
Histogram calculated using DETX and DETY for each event in the final _common_clean file
| Quadrant A | 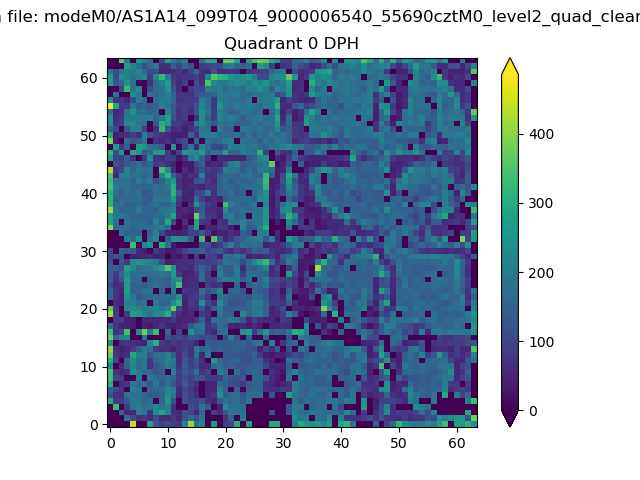 |
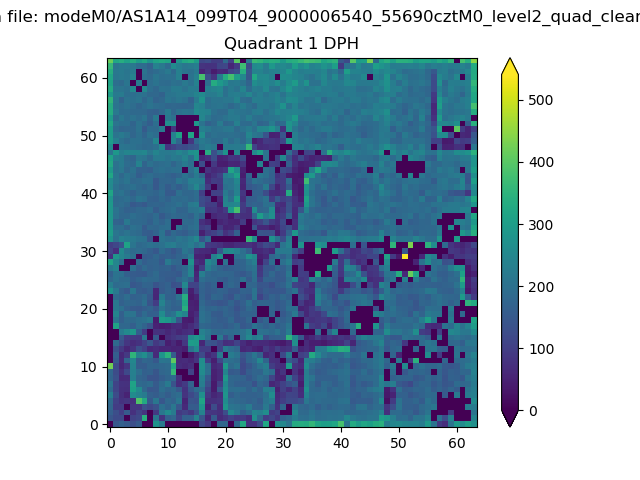 |
Quadrant B |
|---|---|---|---|
| Quadrant D | 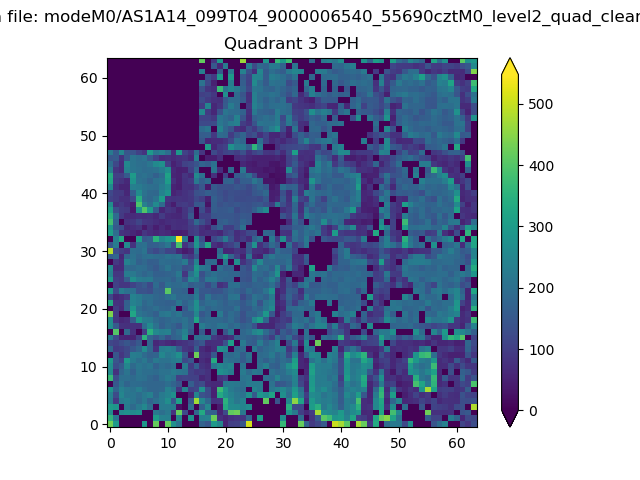 |
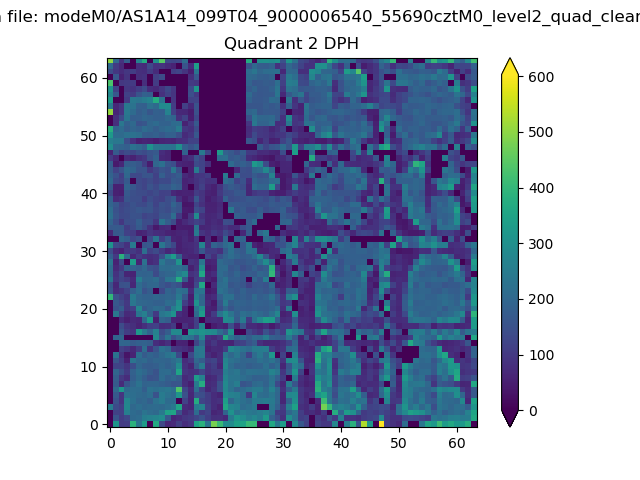 |
Quadrant C |
| Plot type | Count rate plots | Images |
|---|---|---|
| Comparison with Poisson distribution Blue bars denote a histogram of data divided into 1 sec bins. Red curve is a Poisson curve with rate = median count rate of data. |
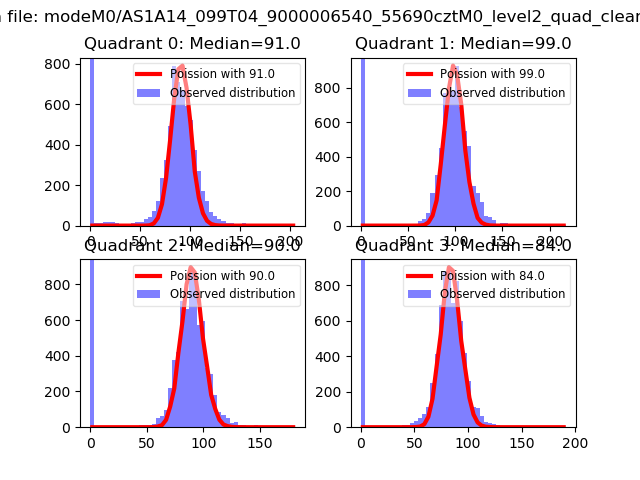 |
 |
| Quadrant-wise count rates Data is divided into 100 sec bins |
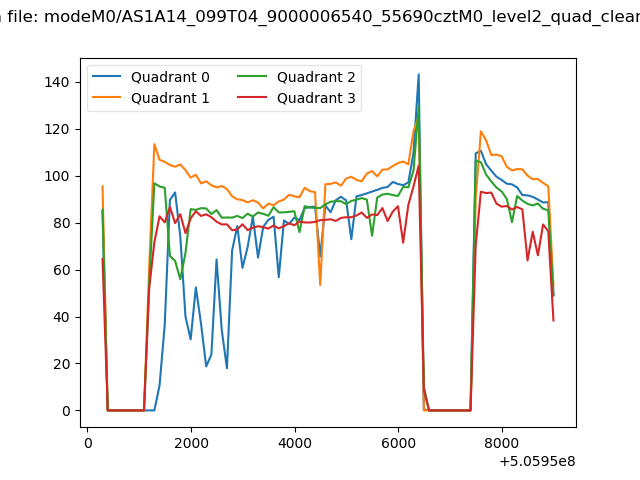 |
|
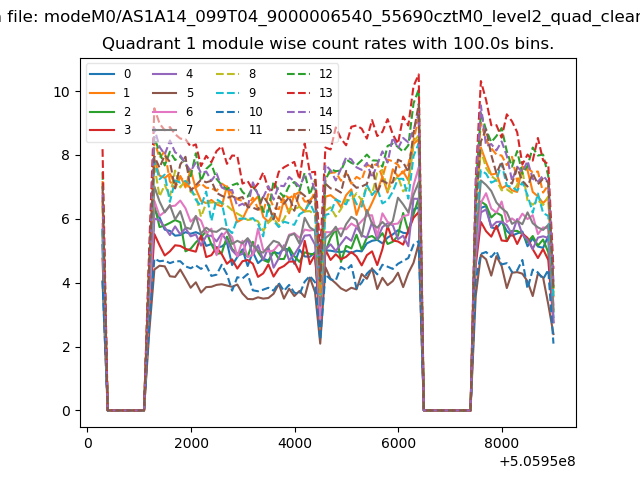
| Module-wise count rates for Quadrant A Data is divided into 100 sec bins |
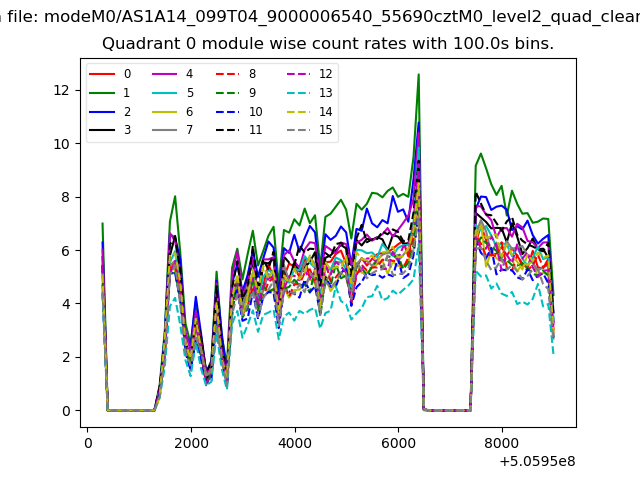 |
 |
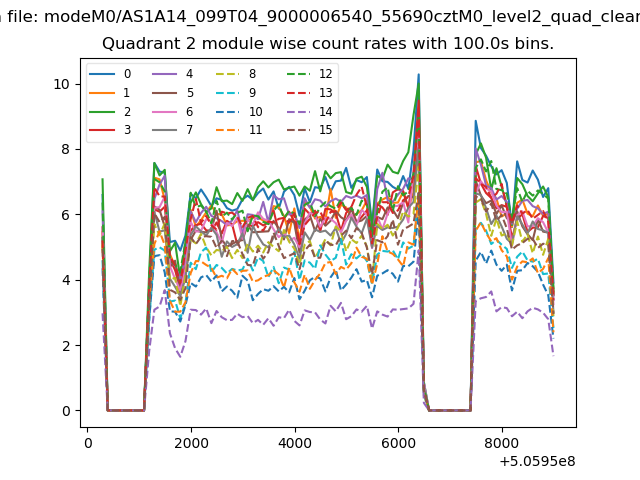
| Module-wise count rates for Quadrant B Data is divided into 100 sec bins |
 |
 |
| Module-wise count rates for Quadrant C Data is divided into 100 sec bins |
 |
 |
| Module-wise count rates for Quadrant D Data is divided into 100 sec bins |
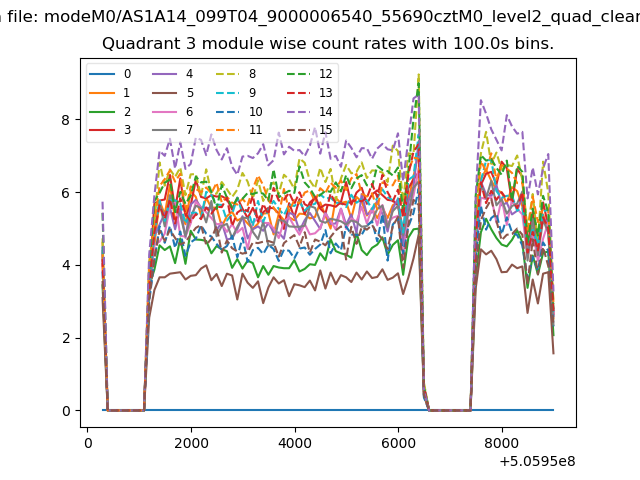 |
 |
| Parameter | Plot |
|---|---|
| CZT HV Monitor | 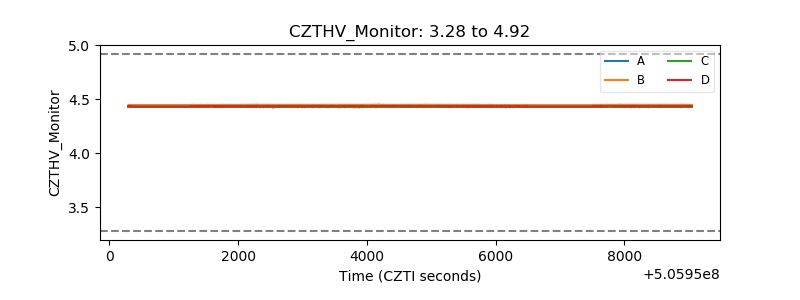 |
| D_VDD | 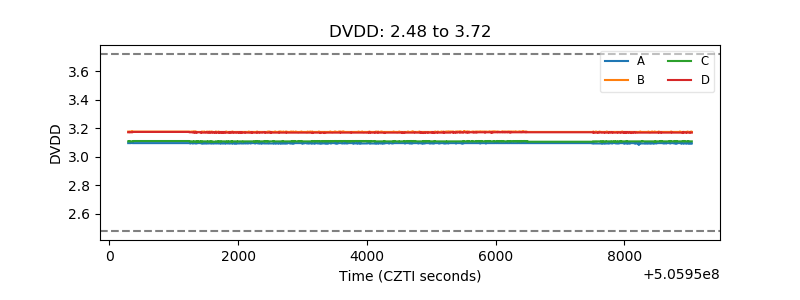 |
| Temperature 1 | 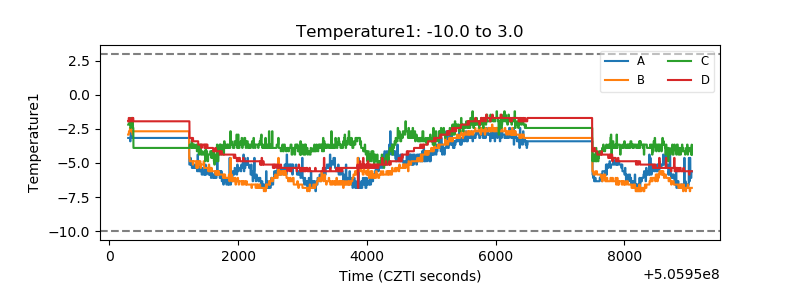 |
| Veto HV Monitor | 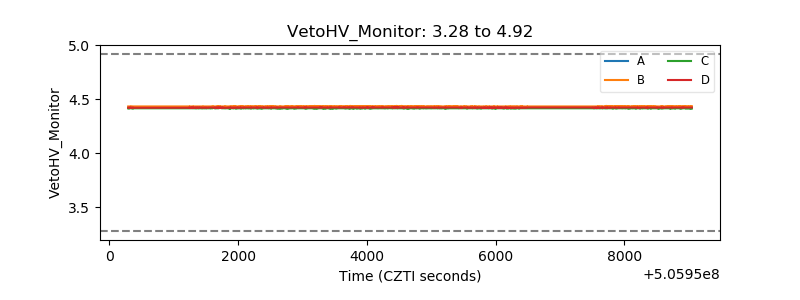 |
| Veto LLD | 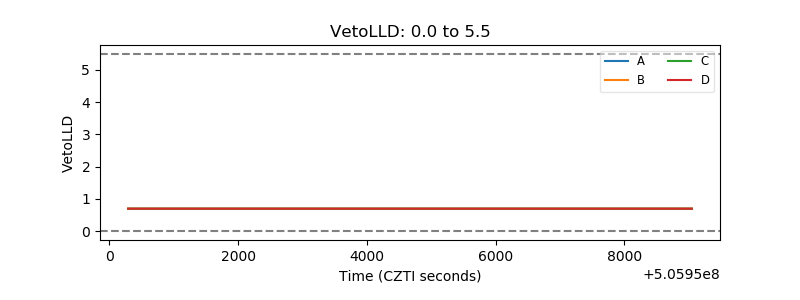 |
| Alpha Counter | 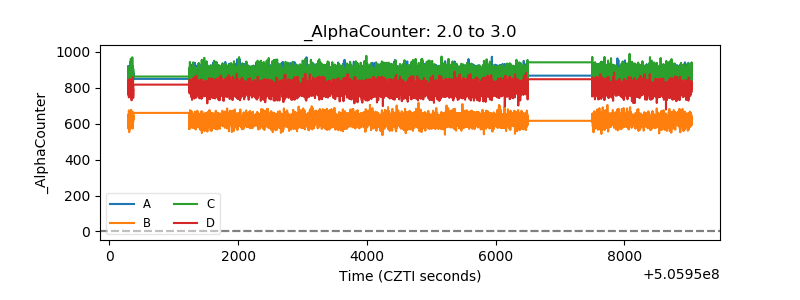 |
| _CPM_Rate | 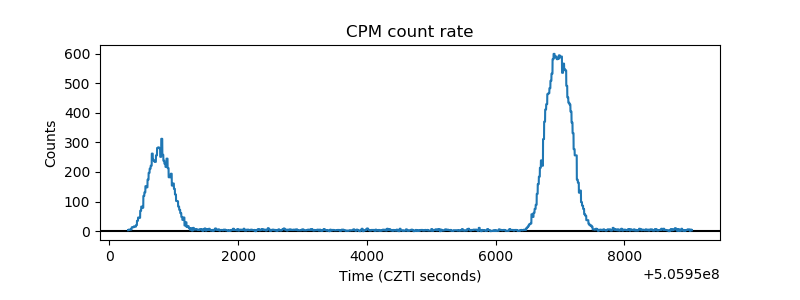 |
| CZT Counter | 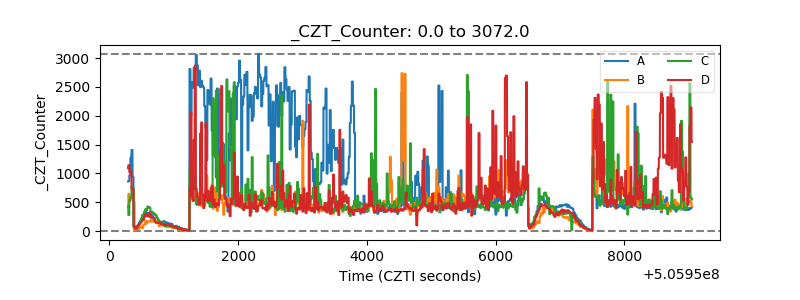 |
| +2.5 Volts monitor | 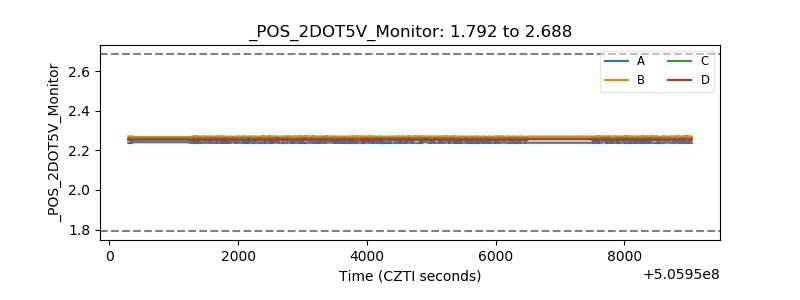 |
| +5 Volts monitor | 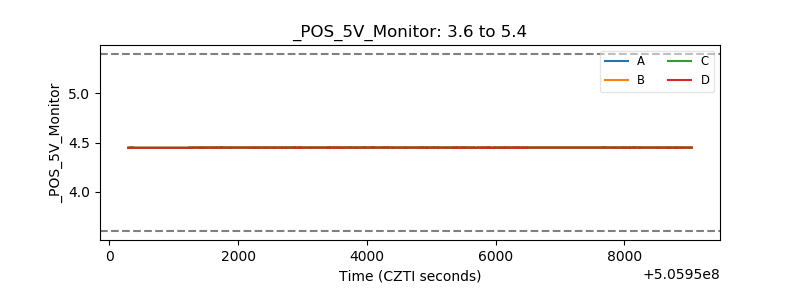 |
| _ROLL_ROT | 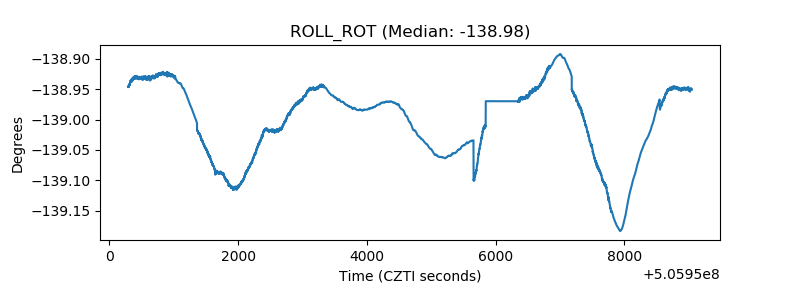 |
| _Roll_DEC | 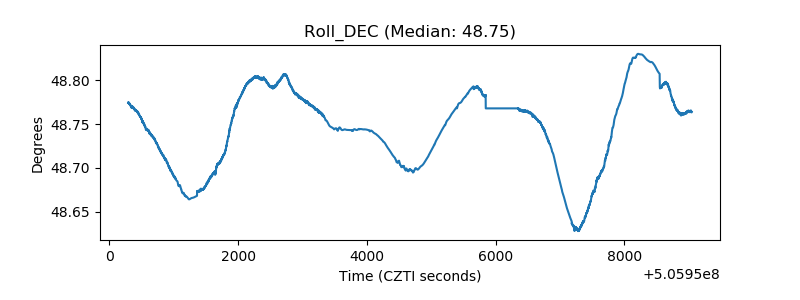 |
| _Roll_RA | 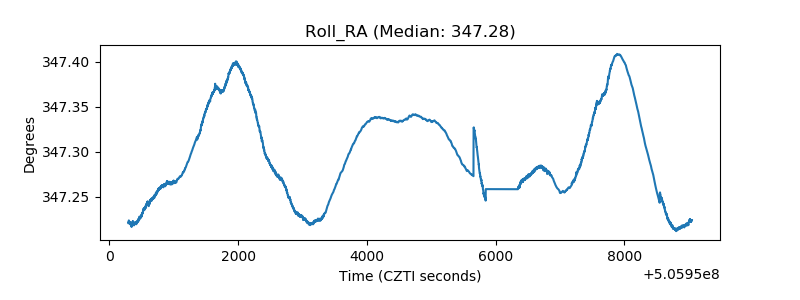 |
| Veto Counter | 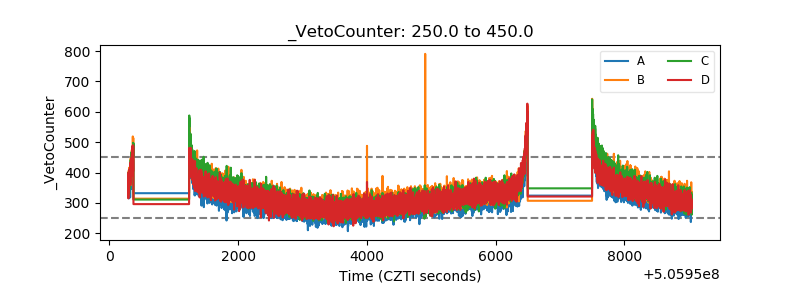 |