| Param | Original file | Final file |
|---|---|---|
| Filename | modeM0/AS1A14_099T04_9000006540_55691cztM0_level2.fits | modeM0/AS1A14_099T04_9000006540_55691cztM0_level2_quad_clean.evt |
| Size (bytes) | 511,660,800 | 97,295,040 |
| Size | 488.0 MB | 92.8 MB |
| Events in quadrant A | 5,168,830 | 608,697 |
| Events in quadrant B | 3,896,632 | 683,557 |
| Events in quadrant C | 3,828,448 | 625,514 |
| Events in quadrant D | 5,524,499 | 559,898 |
| Mode M0 | |||
|---|---|---|---|
| Quadrant | BADHDUFLAG | Total packets | Discarded packets |
| A | 0 | 20205 | 2 |
| B | 0 | 16246 | 2 |
| C | 0 | 16165 | 2 |
| D | 0 | 21142 | 2 |
| Mode M9 | |||
|---|---|---|---|
| Quadrant | BADHDUFLAG | Total packets | Discarded packets |
| A | 0 | 21 | 0 |
| B | 0 | 21 | 0 |
| C | 0 | 21 | 0 |
| D | 0 | 21 | 0 |
| Mode SS | |||
|---|---|---|---|
| Quadrant | BADHDUFLAG | Total packets | Discarded packets |
| A | 0 | 138 | 0 |
| B | 0 | 138 | 0 |
| C | 0 | 138 | 0 |
| D | 0 | 138 | 0 |
| Quadrant | Total seconds | Saturated seconds | Saturation percentage |
|---|---|---|---|
| A | 6719 | 488 | 7.262986% |
| B | 6719 | 170 | 2.530138% |
| C | 6720 | 112 | 1.666667% |
| D | 6719 | 493 | 7.337401% |
Noise dominated data is calculated using 1-second bins in cleaned event files. If a bin has >2000 counts, and if more than 50% of those come from <1% of pixels, then it is considered to be noise-dominated and hence unusable.
| Quadrant | # 1 sec bins | Bins with >0 counts | Bins with >2000 counts | High rate bins dominated by noise | Noise dominated (total time) | Noise dominated (detector-on time) | Marked lightcurve |
|---|---|---|---|---|---|---|---|
| A | 8804 | 6719 | 394 | 394 | 4.48% | 5.86% | 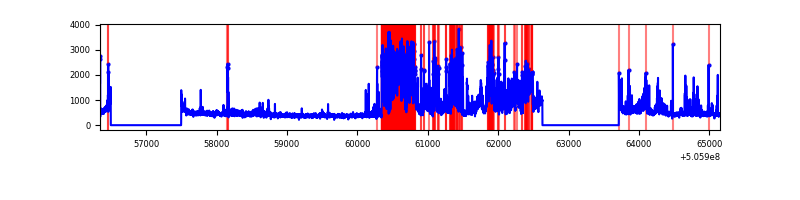 |
| B | 8804 | 6721 | 66 | 66 | 0.75% | 0.98% | 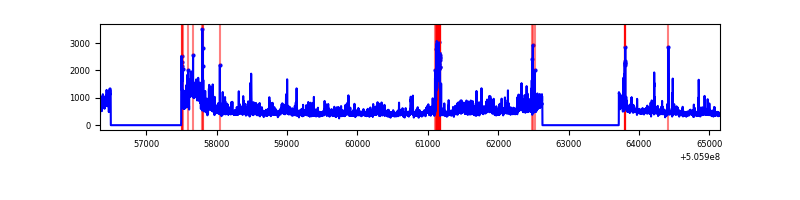 |
| C | 8805 | 6722 | 91 | 91 | 1.03% | 1.35% | 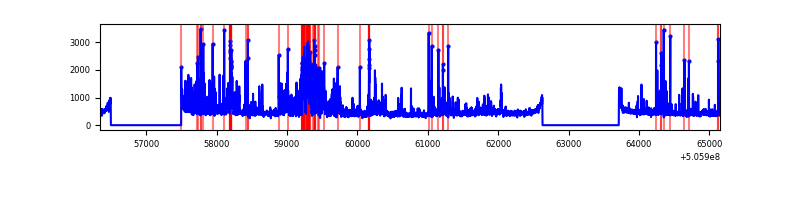 |
| D | 8804 | 6721 | 490 | 490 | 5.57% | 7.29% | 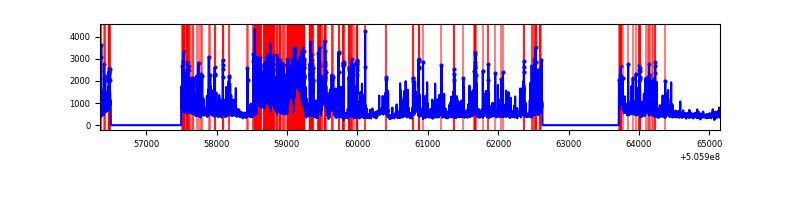 |
Top three noisy pixels from each quadrant. If the there are fewer than three noisy pixels in the level2.evt file, extra rows are filled as -1
| Pixel properties | Quadrant properties | ||||||
|---|---|---|---|---|---|---|---|
| Quadrant | DetID | PixID | Counts | Sigma | Mean | Median | Sigma |
| A | 7 | 64 | 1490690 | 8549.06 | 704 | 687 | 174.3 |
| A | 12 | 115 | 708575 | 4061.59 | 704 | 687 | 174.3 |
| A | 8 | 249 | 79236 | 450.68 | 704 | 687 | 174.3 |
| B | 5 | 236 | 605920 | 3938.69 | 709 | 683 | 153.7 |
| B | 4 | 206 | 204170 | 1324.23 | 709 | 683 | 153.7 |
| B | 5 | 172 | 169691 | 1099.85 | 709 | 683 | 153.7 |
| C | 9 | 38 | 571415 | 2935.2 | 703 | 697 | 194.4 |
| C | 15 | 147 | 247455 | 1269.08 | 703 | 697 | 194.4 |
| C | 6 | 223 | 88106 | 449.54 | 703 | 697 | 194.4 |
| D | 11 | 129 | 1311978 | 6784.92 | 680 | 647 | 193.3 |
| D | 8 | 245 | 814156 | 4209.15 | 680 | 647 | 193.3 |
| D | 10 | 181 | 499707 | 2582.17 | 680 | 647 | 193.3 |
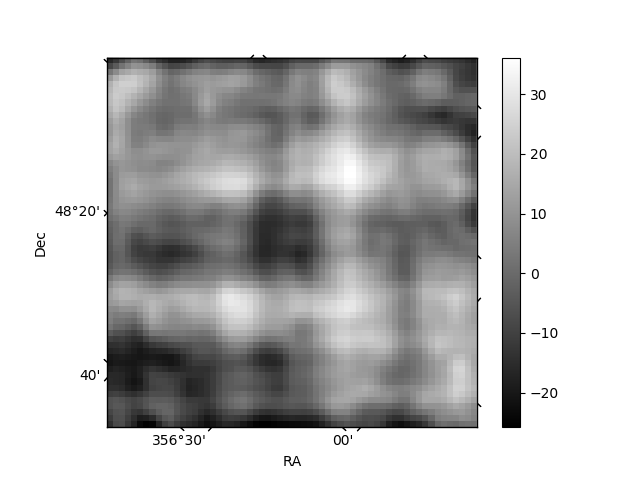
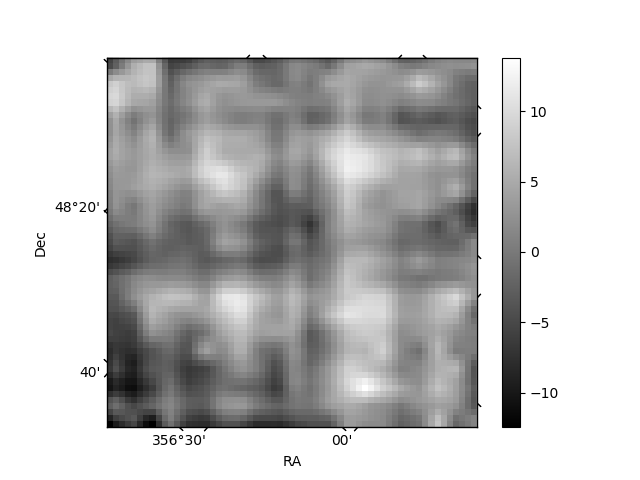
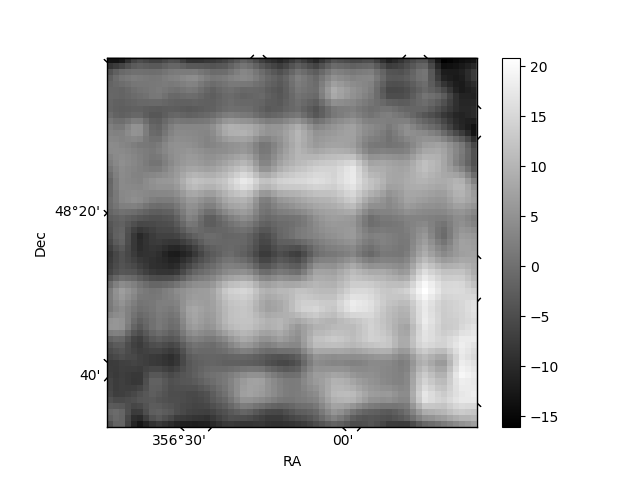
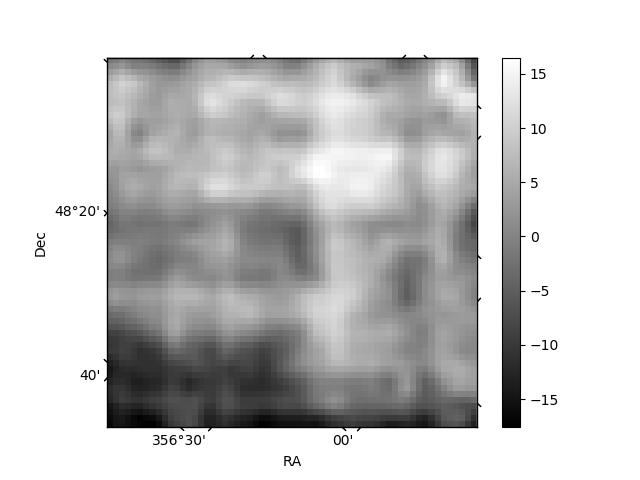
Histogram calculated using DETX and DETY for each event in the final _common_clean file
| Quadrant A | 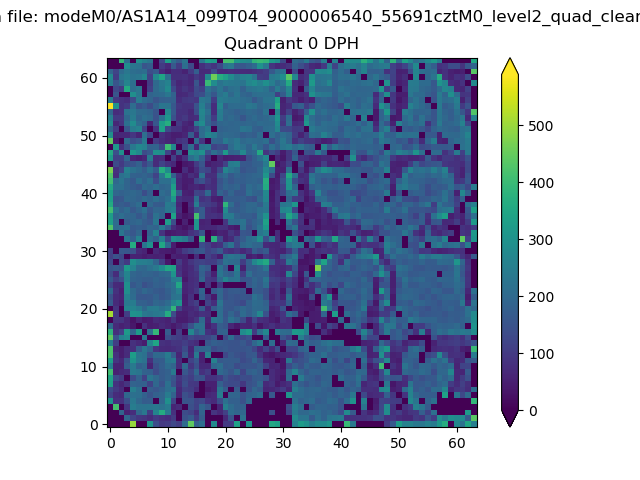 |
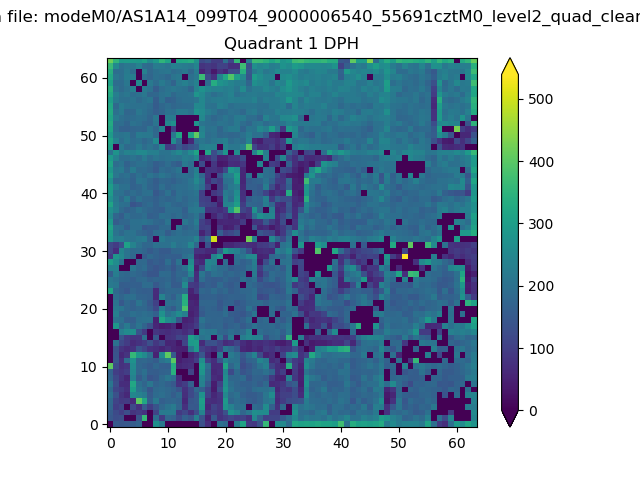 |
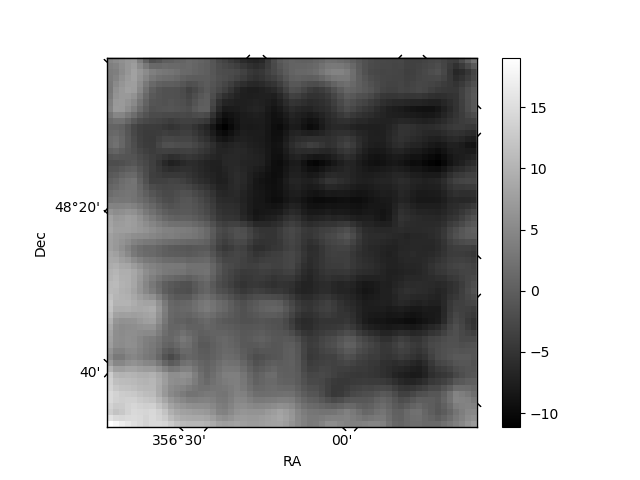
Quadrant B |
|---|---|---|---|
| Quadrant D | 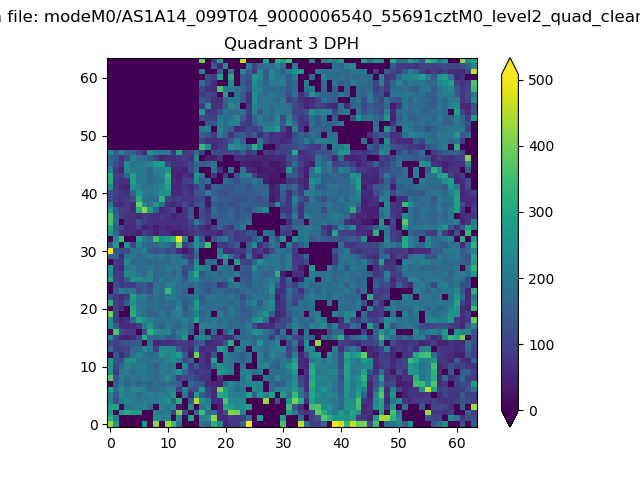 |
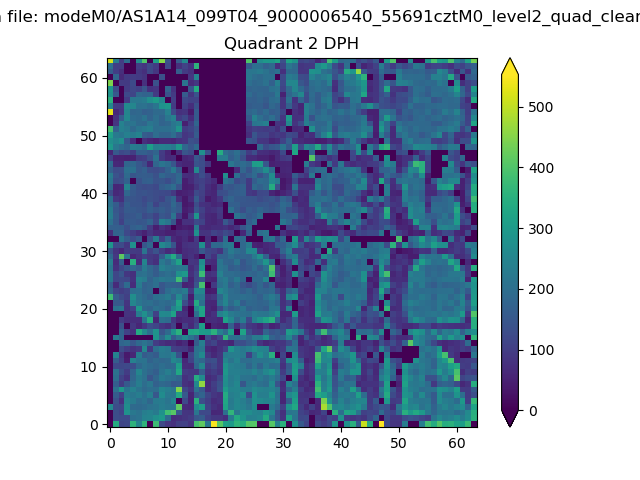 |
Quadrant C |
| Plot type | Count rate plots | Images |
|---|---|---|
| Comparison with Poisson distribution Blue bars denote a histogram of data divided into 1 sec bins. Red curve is a Poisson curve with rate = median count rate of data. |
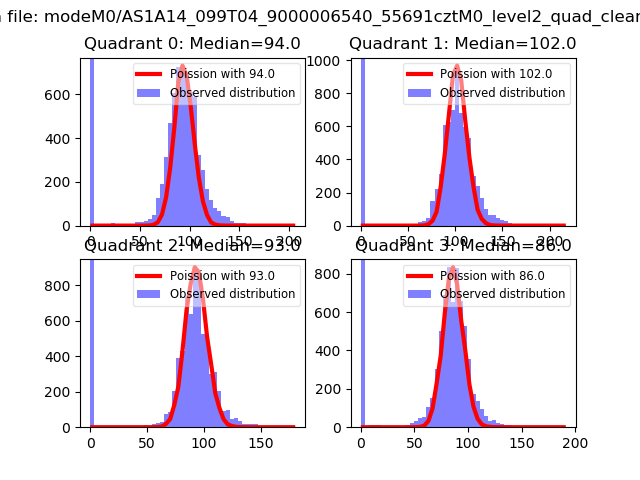 |
 |
| Quadrant-wise count rates Data is divided into 100 sec bins |
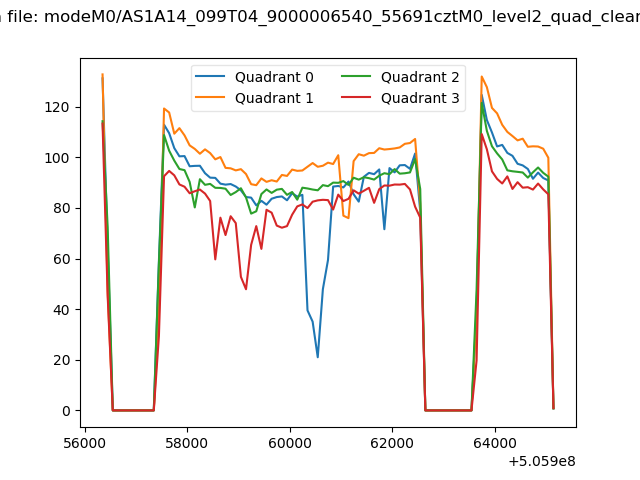 |
|
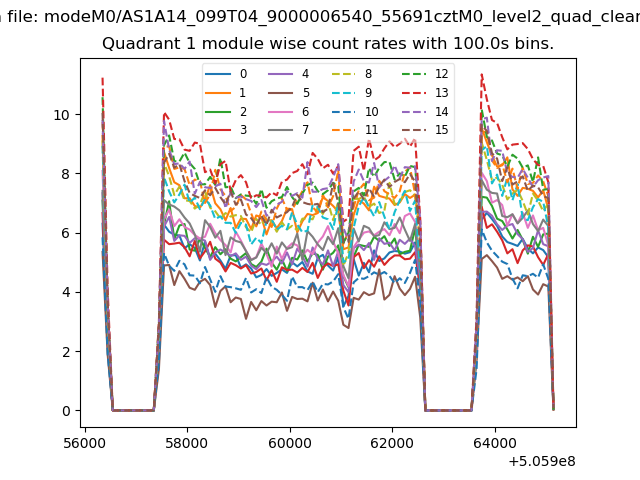
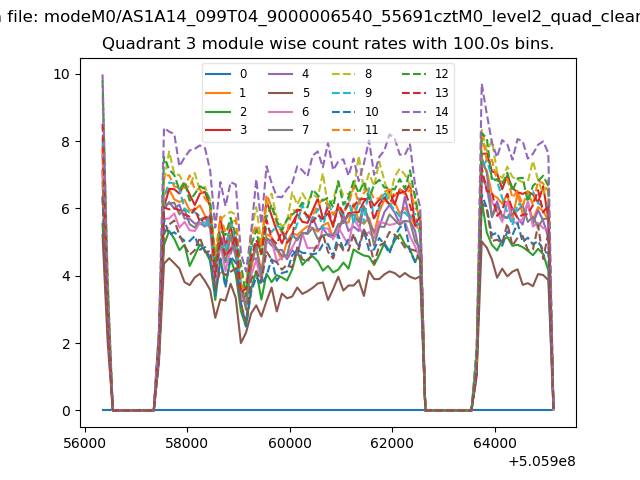
| Module-wise count rates for Quadrant A Data is divided into 100 sec bins |
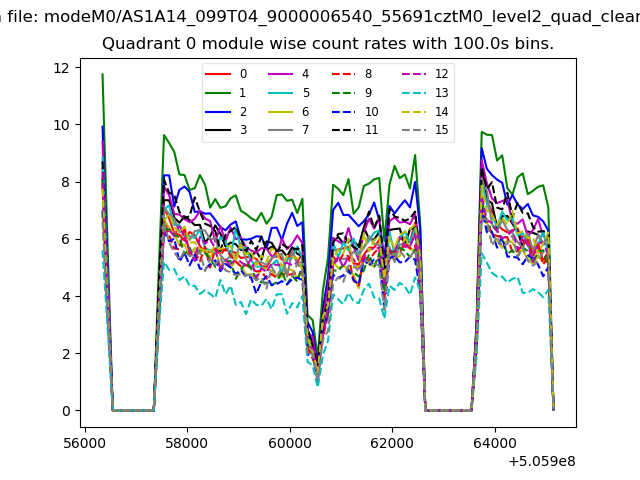 |
 |
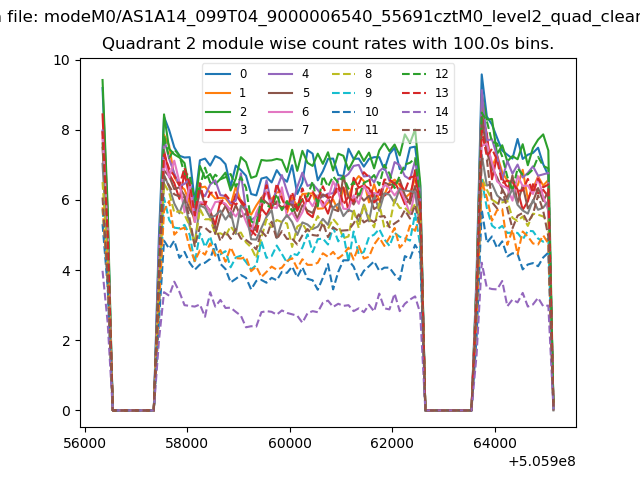
| Module-wise count rates for Quadrant B Data is divided into 100 sec bins |
 |
 |
| Module-wise count rates for Quadrant C Data is divided into 100 sec bins |
 |
 |
| Module-wise count rates for Quadrant D Data is divided into 100 sec bins |
 |
 |
| Parameter | Plot |
|---|---|
| CZT HV Monitor | 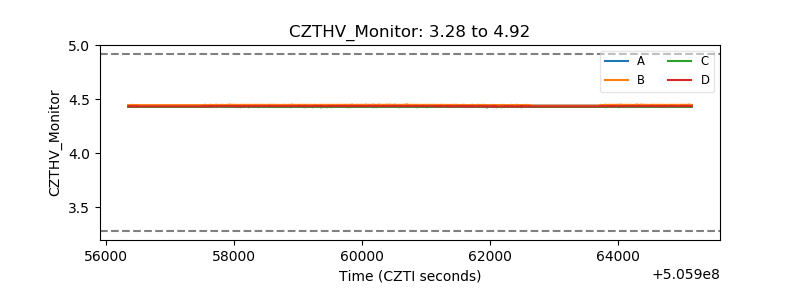 |
| D_VDD | 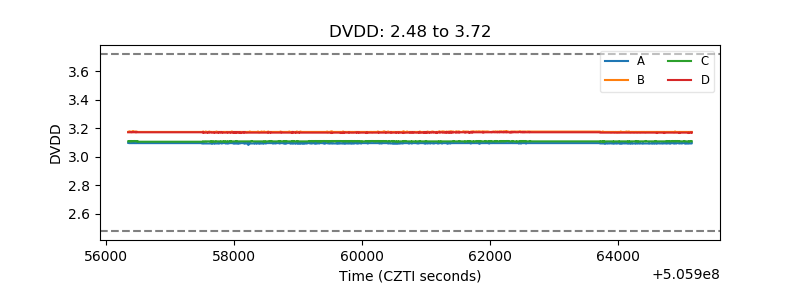 |
| Temperature 1 | 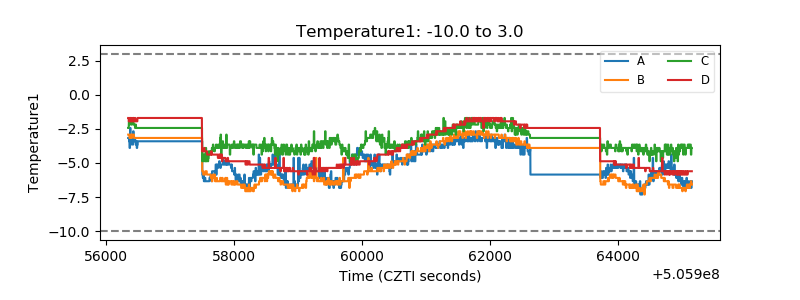 |
| Veto HV Monitor | 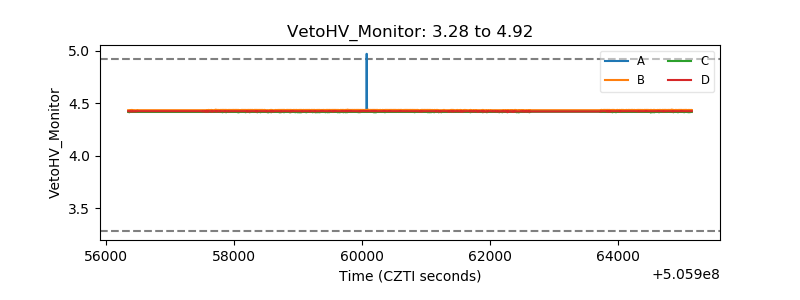 |
| Veto LLD | 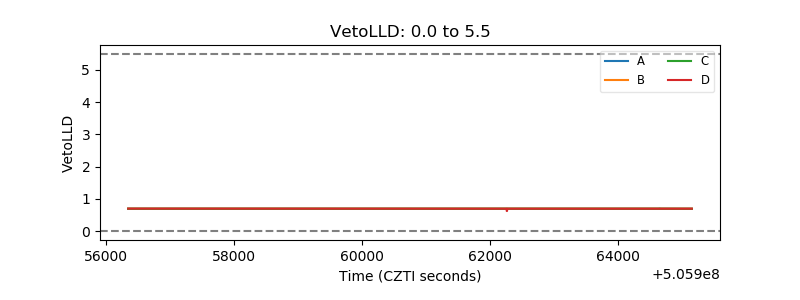 |
| Alpha Counter | 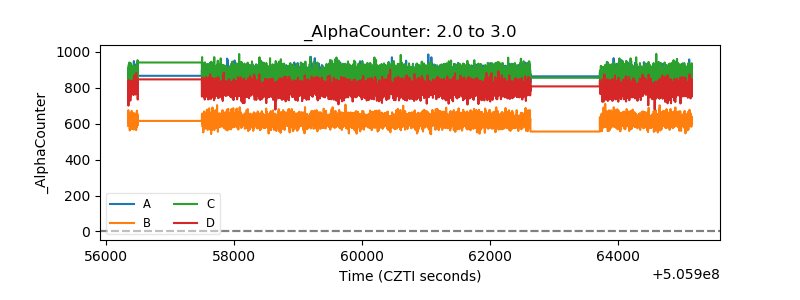 |
| _CPM_Rate | 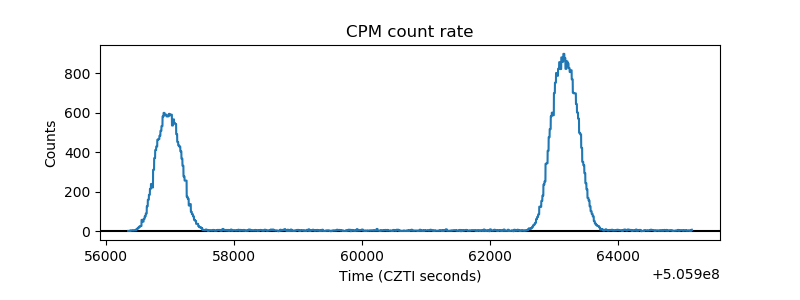 |
| CZT Counter | 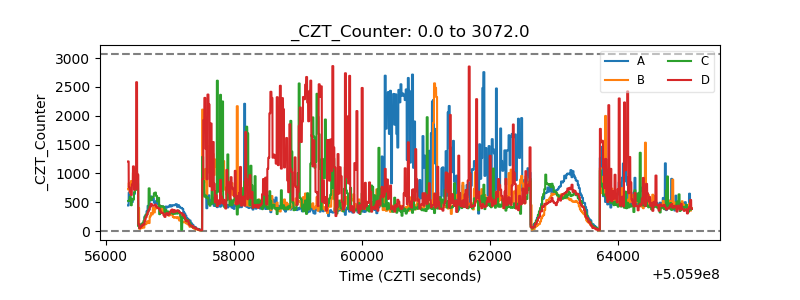 |
| +2.5 Volts monitor |  |
| +5 Volts monitor |  |
| _ROLL_ROT | 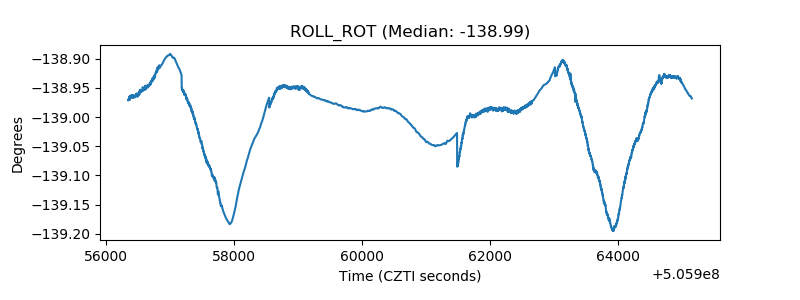 |
| _Roll_DEC | 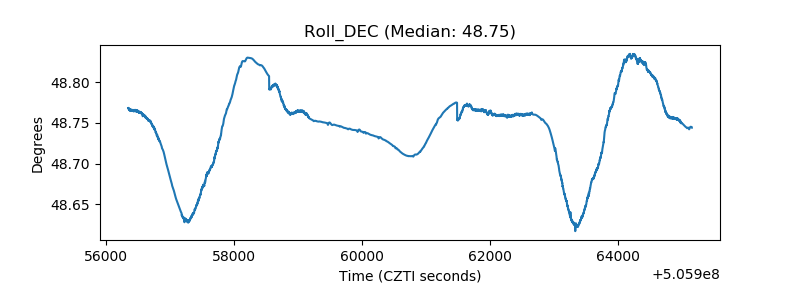 |
| _Roll_RA | 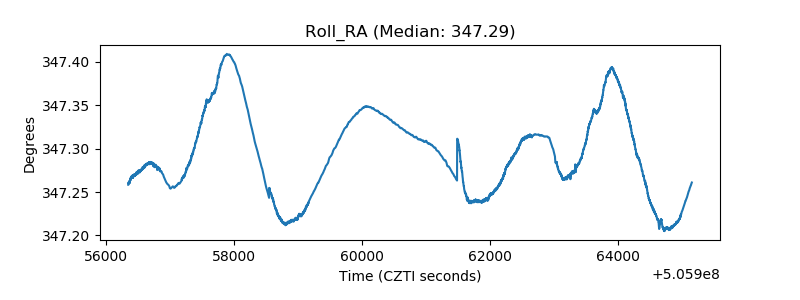 |
| Veto Counter | 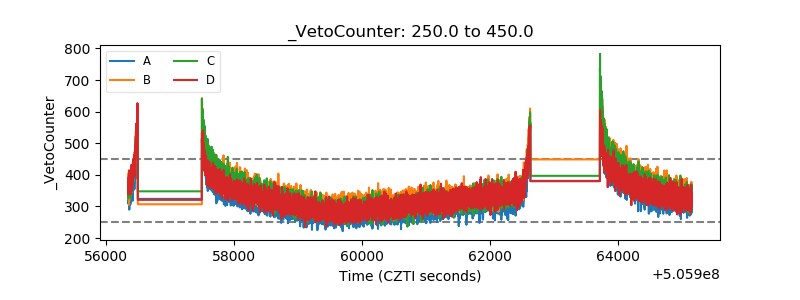 |