| Param | Original file | Final file |
|---|---|---|
| Filename | modeM0/AS1A14_099T04_9000006540_55692cztM0_level2.fits | modeM0/AS1A14_099T04_9000006540_55692cztM0_level2_quad_clean.evt |
| Size (bytes) | 448,718,400 | 101,468,160 |
| Size | 427.9 MB | 96.8 MB |
| Events in quadrant A | 4,265,589 | 652,773 |
| Events in quadrant B | 4,181,357 | 700,412 |
| Events in quadrant C | 3,838,205 | 643,419 |
| Events in quadrant D | 3,794,172 | 600,355 |
| Mode M0 | |||
|---|---|---|---|
| Quadrant | BADHDUFLAG | Total packets | Discarded packets |
| A | 0 | 17496 | 2 |
| B | 0 | 17129 | 2 |
| C | 0 | 16437 | 2 |
| D | 0 | 16297 | 2 |
| Mode M9 | |||
|---|---|---|---|
| Quadrant | BADHDUFLAG | Total packets | Discarded packets |
| A | 0 | 22 | 0 |
| B | 0 | 22 | 0 |
| C | 0 | 22 | 0 |
| D | 0 | 22 | 0 |
| Mode SS | |||
|---|---|---|---|
| Quadrant | BADHDUFLAG | Total packets | Discarded packets |
| A | 0 | 140 | 0 |
| B | 0 | 140 | 0 |
| C | 0 | 140 | 0 |
| D | 0 | 140 | 0 |
| Quadrant | Total seconds | Saturated seconds | Saturation percentage |
|---|---|---|---|
| A | 6825 | 257 | 3.765568% |
| B | 6825 | 305 | 4.468864% |
| C | 6826 | 216 | 3.164372% |
| D | 6826 | 160 | 2.343979% |
Noise dominated data is calculated using 1-second bins in cleaned event files. If a bin has >2000 counts, and if more than 50% of those come from <1% of pixels, then it is considered to be noise-dominated and hence unusable.
| Quadrant | # 1 sec bins | Bins with >0 counts | Bins with >2000 counts | High rate bins dominated by noise | Noise dominated (total time) | Noise dominated (detector-on time) | Marked lightcurve |
|---|---|---|---|---|---|---|---|
| A | 9025 | 6826 | 159 | 159 | 1.76% | 2.33% | 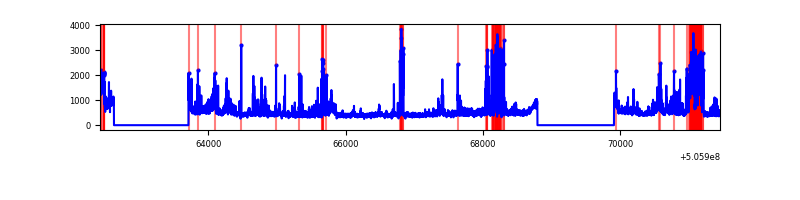 |
| B | 9025 | 6826 | 126 | 126 | 1.40% | 1.85% | 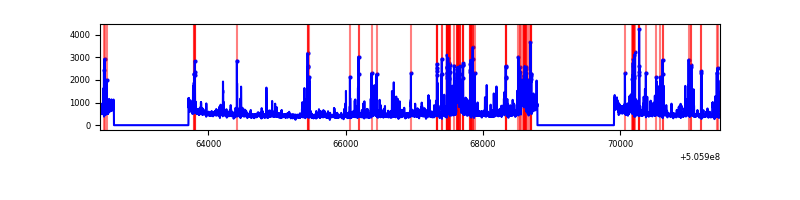 |
| C | 9026 | 6828 | 165 | 165 | 1.83% | 2.42% | 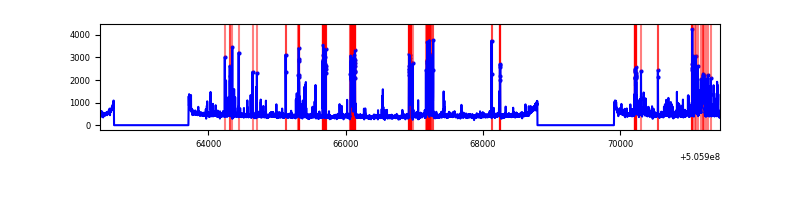 |
| D | 9026 | 6828 | 84 | 84 | 0.93% | 1.23% | 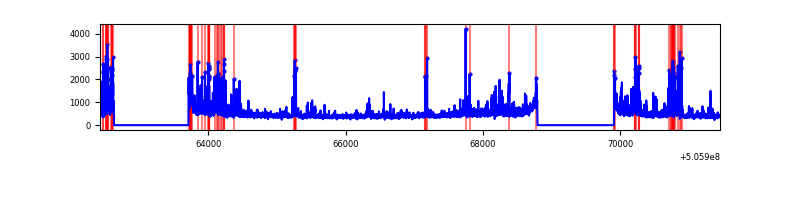 |
Top three noisy pixels from each quadrant. If the there are fewer than three noisy pixels in the level2.evt file, extra rows are filled as -1
| Pixel properties | Quadrant properties | ||||||
|---|---|---|---|---|---|---|---|
| Quadrant | DetID | PixID | Counts | Sigma | Mean | Median | Sigma |
| A | 12 | 115 | 699195 | 3840.37 | 742 | 722 | 181.9 |
| A | 3 | 95 | 354772 | 1946.65 | 742 | 722 | 181.9 |
| A | 7 | 64 | 120797 | 660.2 | 742 | 722 | 181.9 |
| B | 5 | 236 | 816923 | 5189.29 | 733 | 705 | 157.3 |
| B | 5 | 172 | 153738 | 972.94 | 733 | 705 | 157.3 |
| B | 7 | 252 | 119202 | 753.37 | 733 | 705 | 157.3 |
| C | 6 | 223 | 380340 | 1873.77 | 728 | 718 | 202.6 |
| C | 9 | 38 | 262041 | 1289.86 | 728 | 718 | 202.6 |
| C | 10 | 19 | 126071 | 618.72 | 728 | 718 | 202.6 |
| D | 11 | 129 | 662202 | 3232.46 | 718 | 683 | 204.6 |
| D | 7 | 129 | 116815 | 567.47 | 718 | 683 | 204.6 |
| D | 10 | 181 | 67893 | 328.42 | 718 | 683 | 204.6 |
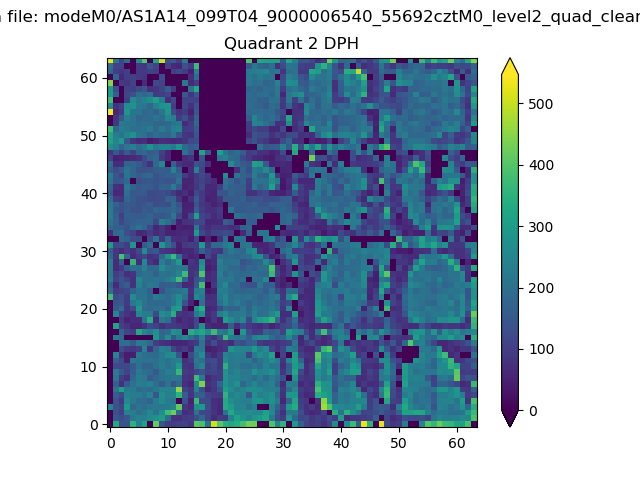
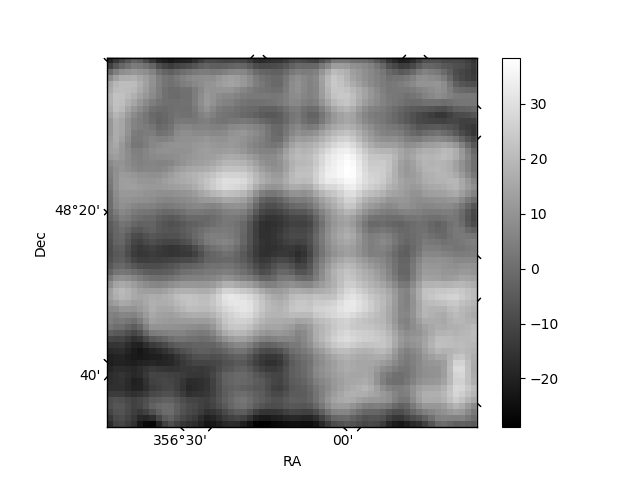
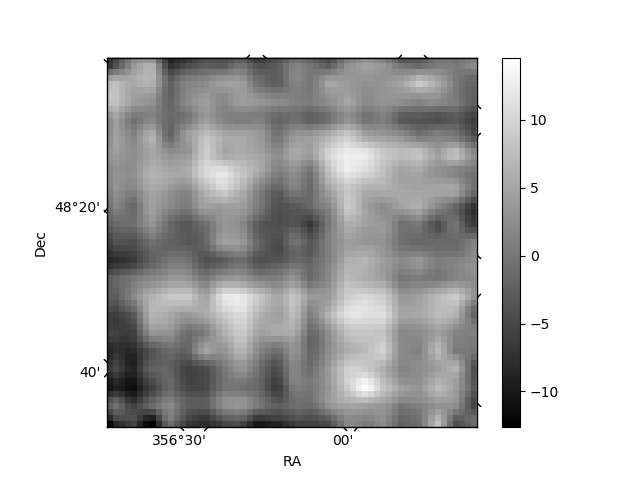
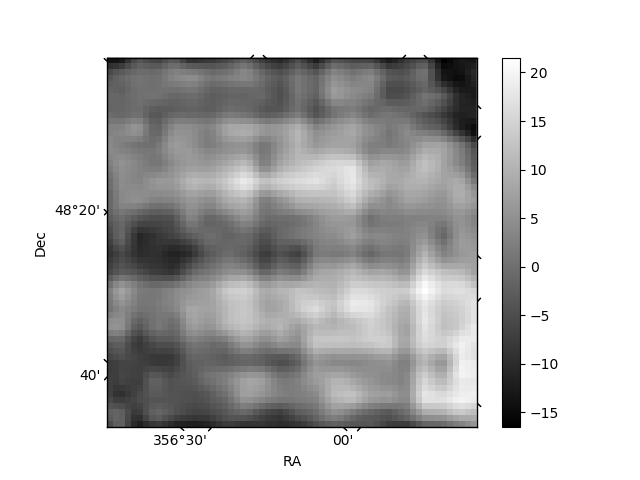
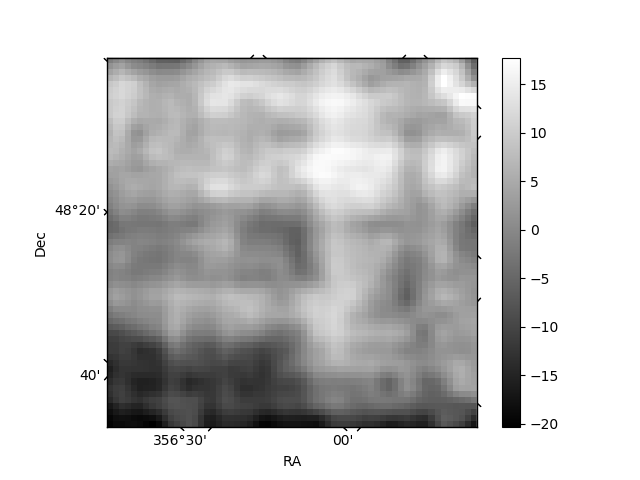
Histogram calculated using DETX and DETY for each event in the final _common_clean file
| Quadrant A | 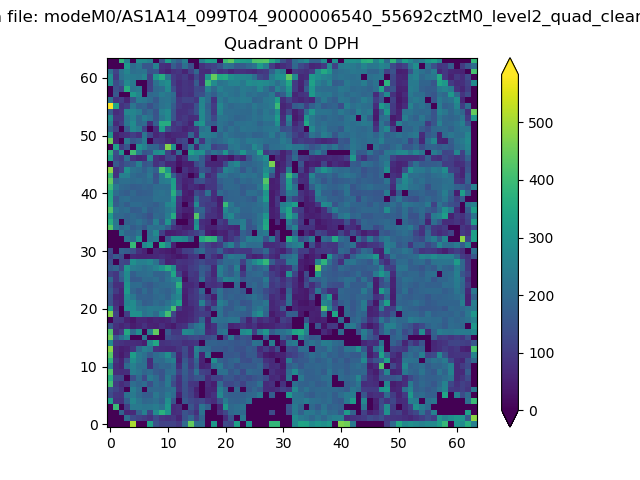 |
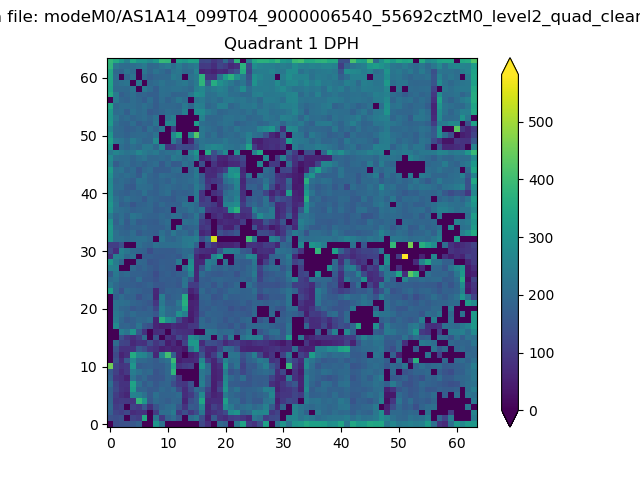 |
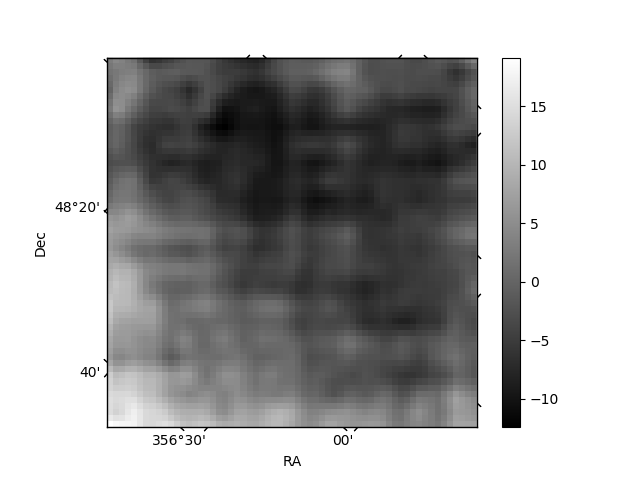
Quadrant B |
|---|---|---|---|
| Quadrant D | 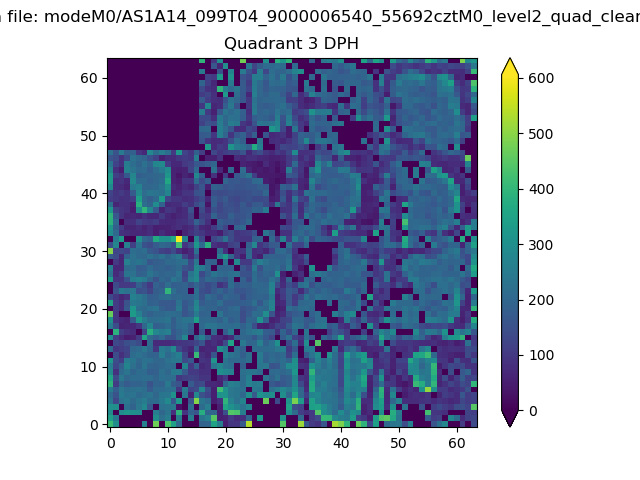 |
 |
Quadrant C |
| Plot type | Count rate plots | Images |
|---|---|---|
| Comparison with Poisson distribution Blue bars denote a histogram of data divided into 1 sec bins. Red curve is a Poisson curve with rate = median count rate of data. |
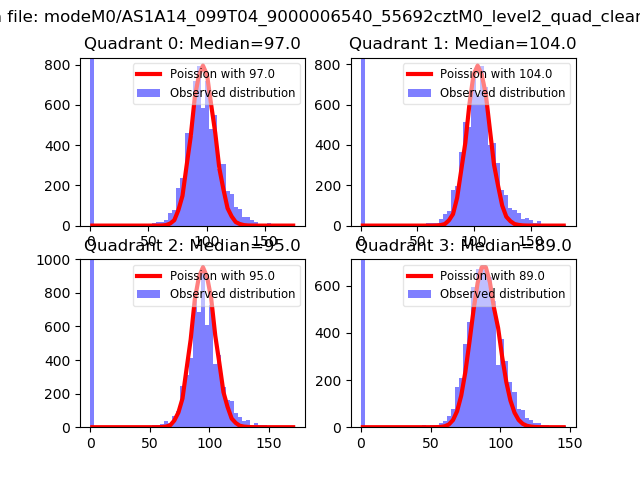 |
 |
| Quadrant-wise count rates Data is divided into 100 sec bins |
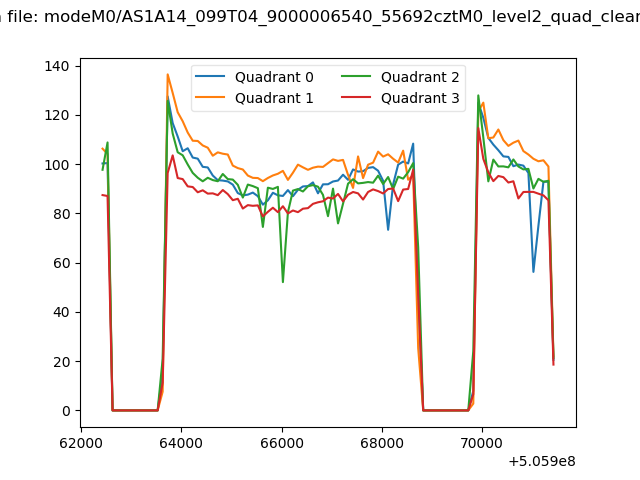 |
|
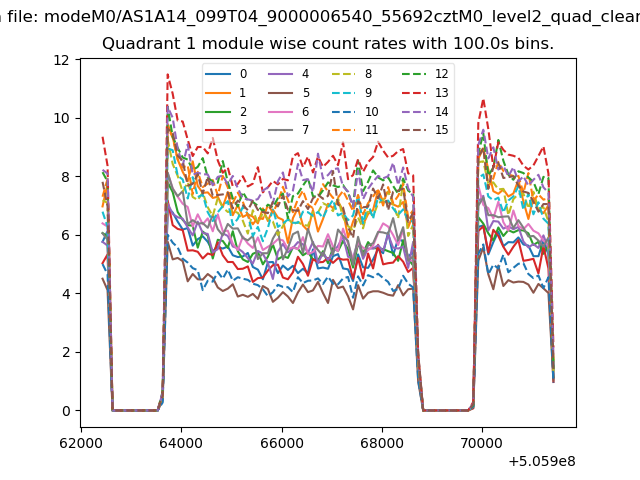
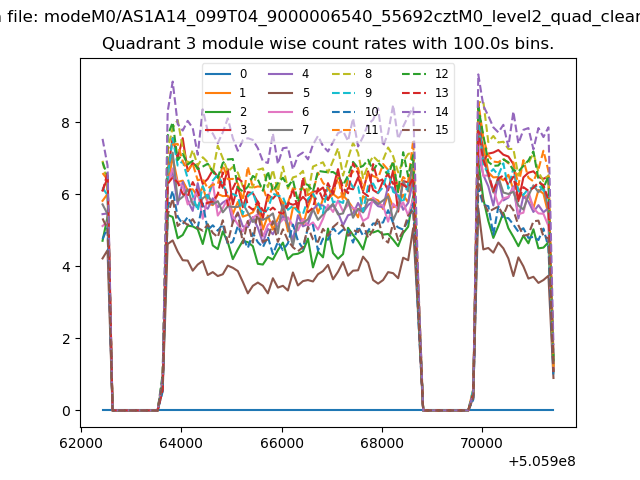
| Module-wise count rates for Quadrant A Data is divided into 100 sec bins |
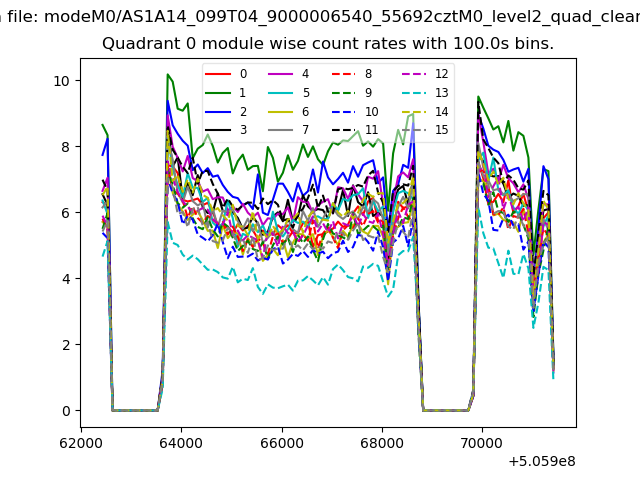 |
 |
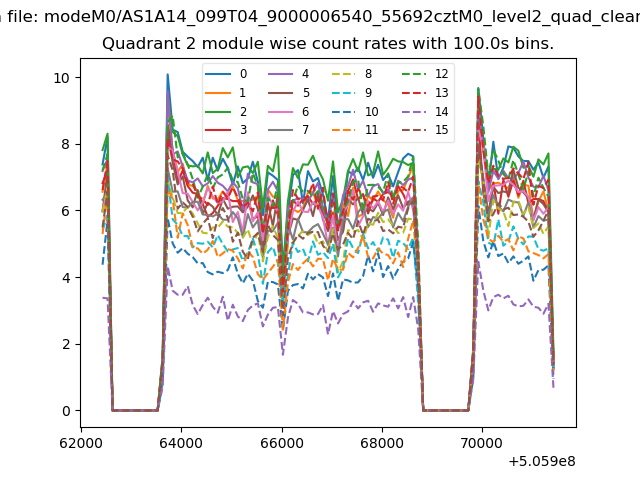
| Module-wise count rates for Quadrant B Data is divided into 100 sec bins |
 |
 |
| Module-wise count rates for Quadrant C Data is divided into 100 sec bins |
 |
 |
| Module-wise count rates for Quadrant D Data is divided into 100 sec bins |
 |
 |
| Parameter | Plot |
|---|---|
| CZT HV Monitor | 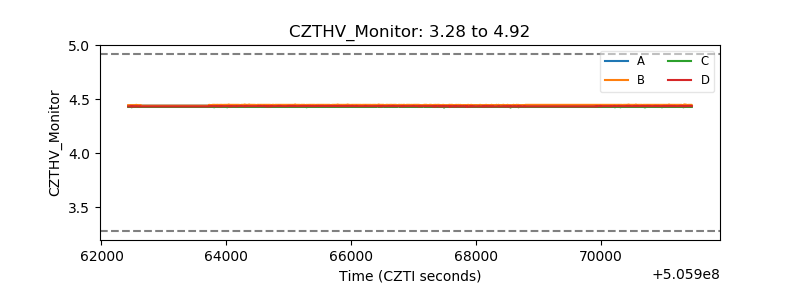 |
| D_VDD | 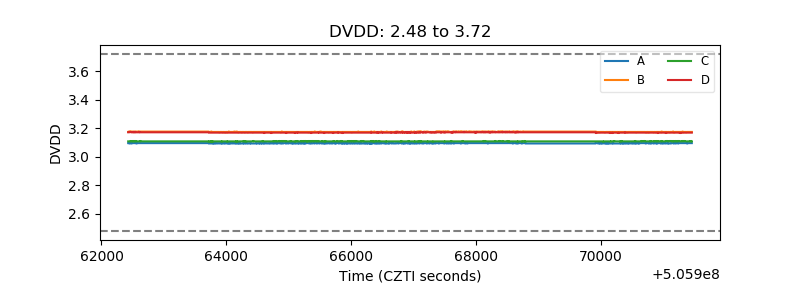 |
| Temperature 1 | 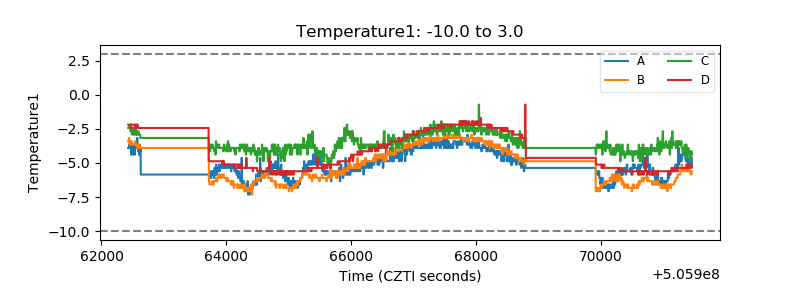 |
| Veto HV Monitor | 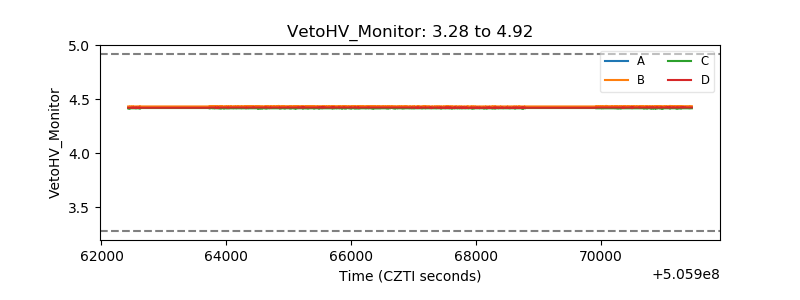 |
| Veto LLD | 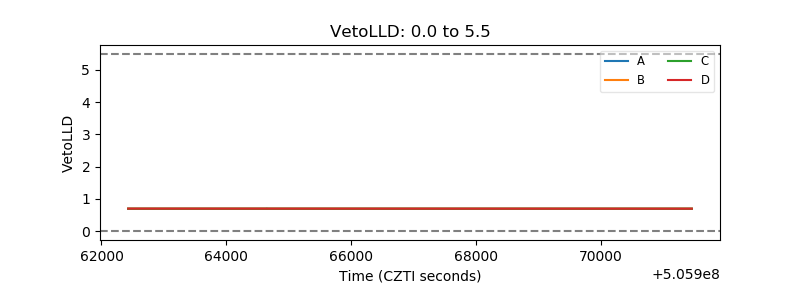 |
| Alpha Counter | 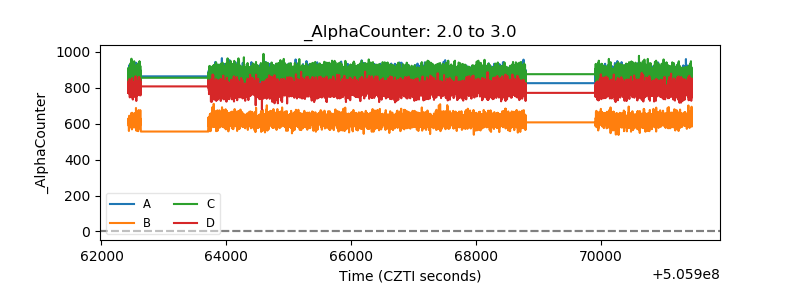 |
| _CPM_Rate | 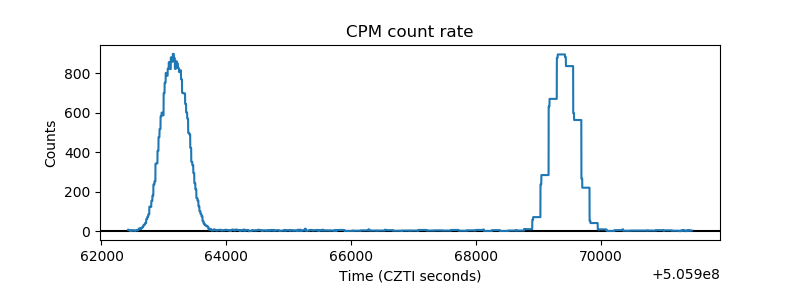 |
| CZT Counter | 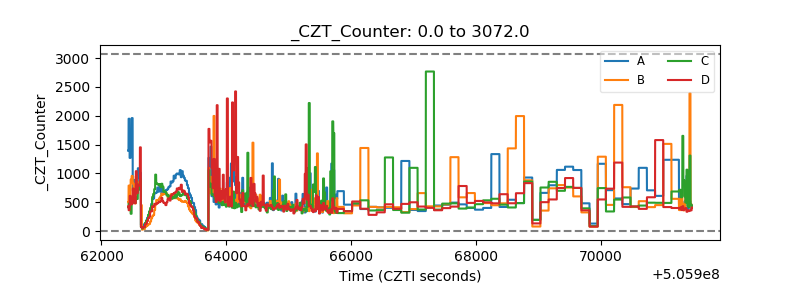 |
| +2.5 Volts monitor |  |
| +5 Volts monitor |  |
| _ROLL_ROT | 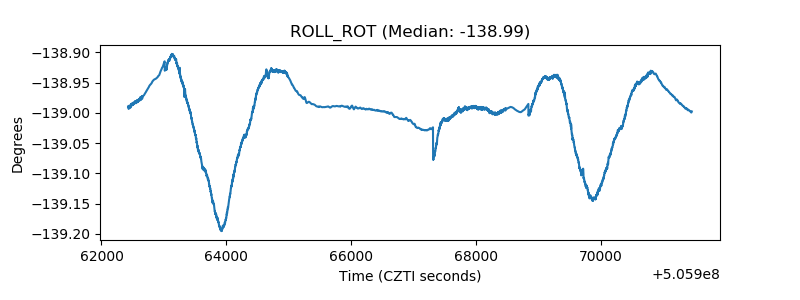 |
| _Roll_DEC | 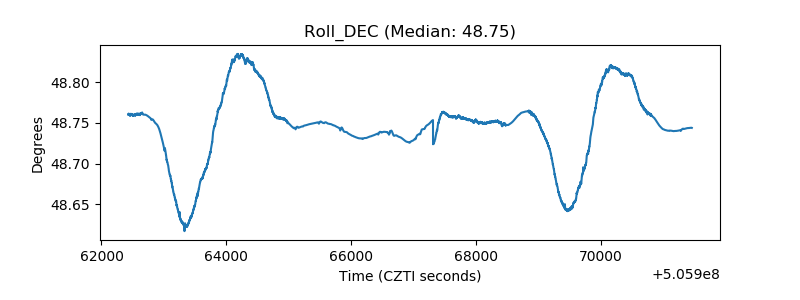 |
| _Roll_RA | 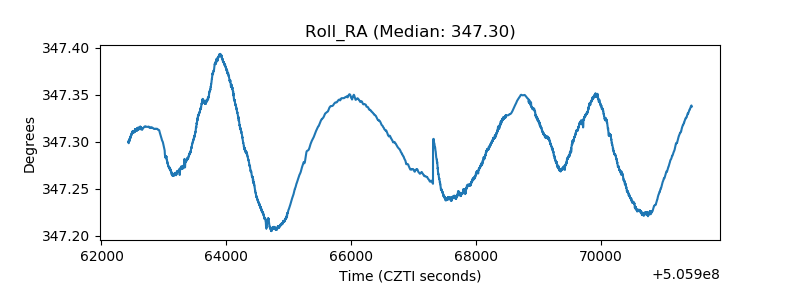 |
| Veto Counter | 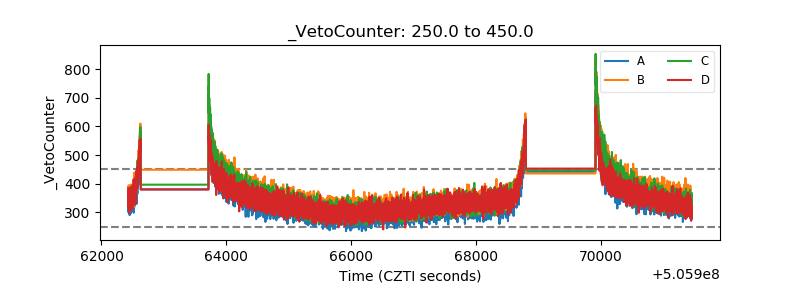 |