| Param | Original file | Final file |
|---|---|---|
| Filename | modeM0/AS1A14_099T04_9000006540_55693cztM0_level2.fits | modeM0/AS1A14_099T04_9000006540_55693cztM0_level2_quad_clean.evt |
| Size (bytes) | 447,742,080 | 95,950,080 |
| Size | 427.0 MB | 91.5 MB |
| Events in quadrant A | 3,790,136 | 619,920 |
| Events in quadrant B | 3,599,635 | 676,537 |
| Events in quadrant C | 3,718,252 | 620,399 |
| Events in quadrant D | 4,960,651 | 535,357 |
| Mode M0 | |||
|---|---|---|---|
| Quadrant | BADHDUFLAG | Total packets | Discarded packets |
| A | 0 | 15992 | 3 |
| B | 0 | 15339 | 2 |
| C | 0 | 15659 | 2 |
| D | 0 | 19444 | 2 |
| Mode M9 | |||
|---|---|---|---|
| Quadrant | BADHDUFLAG | Total packets | Discarded packets |
| A | 0 | 19 | 0 |
| B | 0 | 19 | 0 |
| C | 0 | 20 | 0 |
| D | 0 | 20 | 0 |
| Mode SS | |||
|---|---|---|---|
| Quadrant | BADHDUFLAG | Total packets | Discarded packets |
| A | 0 | 132 | 0 |
| B | 0 | 132 | 0 |
| C | 0 | 132 | 0 |
| D | 0 | 132 | 0 |
| Quadrant | Total seconds | Saturated seconds | Saturation percentage |
|---|---|---|---|
| A | 6499 | 256 | 3.939068% |
| B | 6499 | 205 | 3.154331% |
| C | 6499 | 86 | 1.323281% |
| D | 6499 | 587 | 9.032159% |
Noise dominated data is calculated using 1-second bins in cleaned event files. If a bin has >2000 counts, and if more than 50% of those come from <1% of pixels, then it is considered to be noise-dominated and hence unusable.
| Quadrant | # 1 sec bins | Bins with >0 counts | Bins with >2000 counts | High rate bins dominated by noise | Noise dominated (total time) | Noise dominated (detector-on time) | Marked lightcurve |
|---|---|---|---|---|---|---|---|
| A | 7664 | 6500 | 186 | 186 | 2.43% | 2.86% | 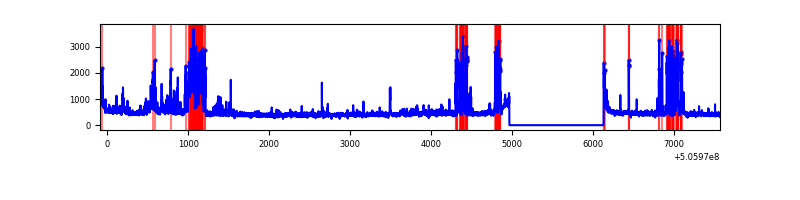 |
| B | 7664 | 6499 | 71 | 71 | 0.93% | 1.09% | 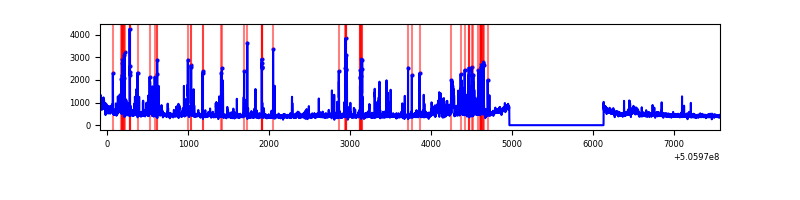 |
| C | 7664 | 6500 | 59 | 59 | 0.77% | 0.91% | 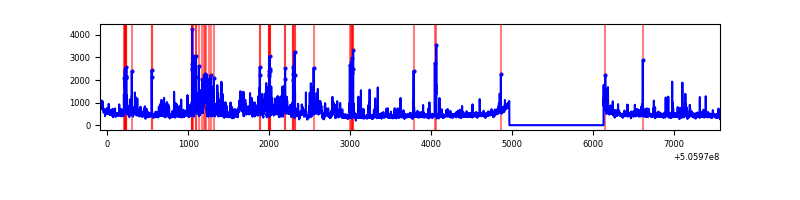 |
| D | 7664 | 6500 | 514 | 514 | 6.71% | 7.91% | 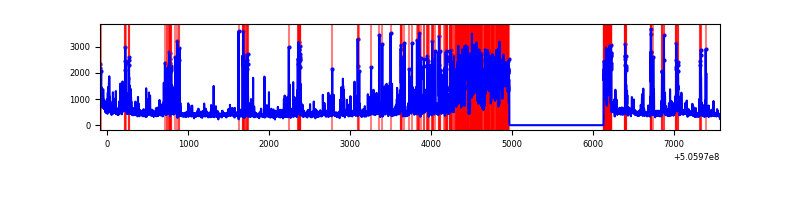 |
Top three noisy pixels from each quadrant. If the there are fewer than three noisy pixels in the level2.evt file, extra rows are filled as -1
| Pixel properties | Quadrant properties | ||||||
|---|---|---|---|---|---|---|---|
| Quadrant | DetID | PixID | Counts | Sigma | Mean | Median | Sigma |
| A | 12 | 115 | 479740 | 2797.26 | 701 | 682 | 171.3 |
| A | 0 | 8 | 405066 | 2361.23 | 701 | 682 | 171.3 |
| A | 8 | 249 | 41829 | 240.26 | 701 | 682 | 171.3 |
| B | 5 | 236 | 601888 | 4012.37 | 694 | 668 | 149.8 |
| B | 7 | 252 | 122628 | 813.93 | 694 | 668 | 149.8 |
| B | 4 | 206 | 40455 | 265.53 | 694 | 668 | 149.8 |
| C | 9 | 38 | 568871 | 3005.02 | 688 | 683 | 189.1 |
| C | 13 | 3 | 155422 | 818.38 | 688 | 683 | 189.1 |
| C | 15 | 147 | 95350 | 500.67 | 688 | 683 | 189.1 |
| D | 11 | 129 | 2123152 | 11425.87 | 652 | 623 | 185.8 |
| D | 2 | 62 | 111964 | 599.36 | 652 | 623 | 185.8 |
| D | 7 | 129 | 68851 | 367.28 | 652 | 623 | 185.8 |
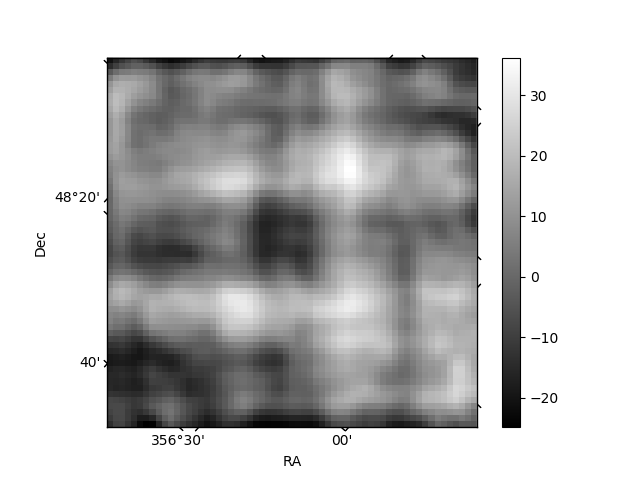
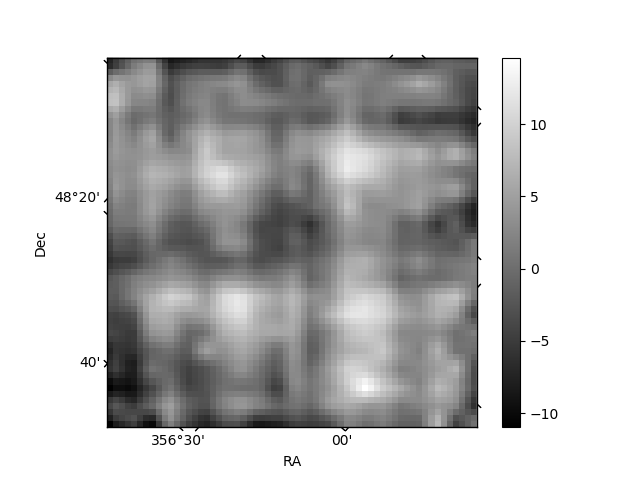
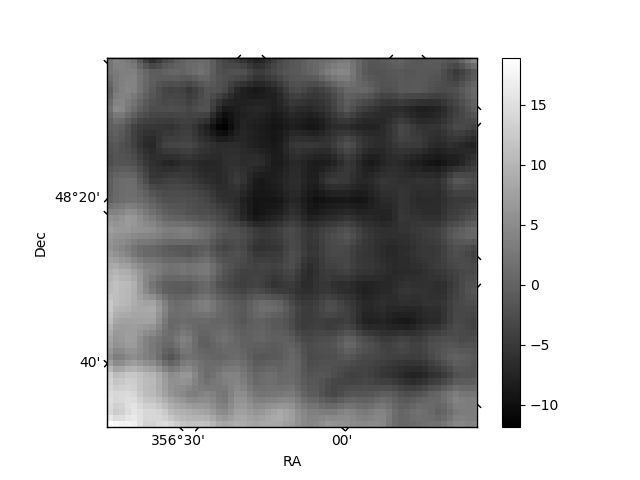
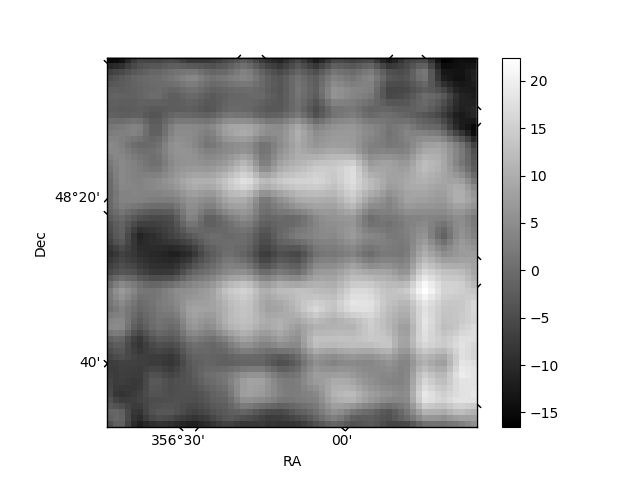
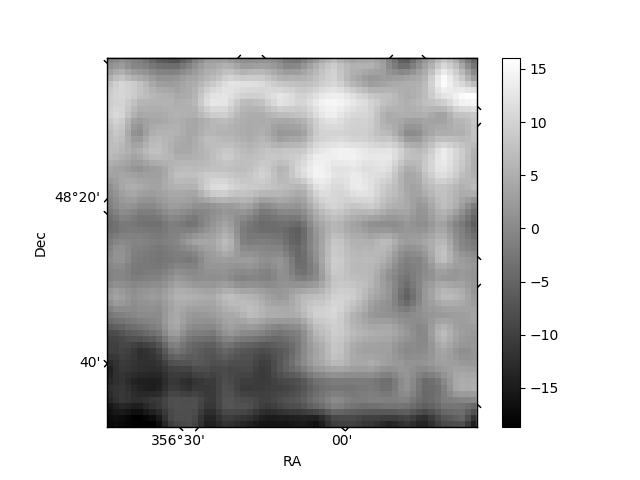
Histogram calculated using DETX and DETY for each event in the final _common_clean file
| Quadrant A | 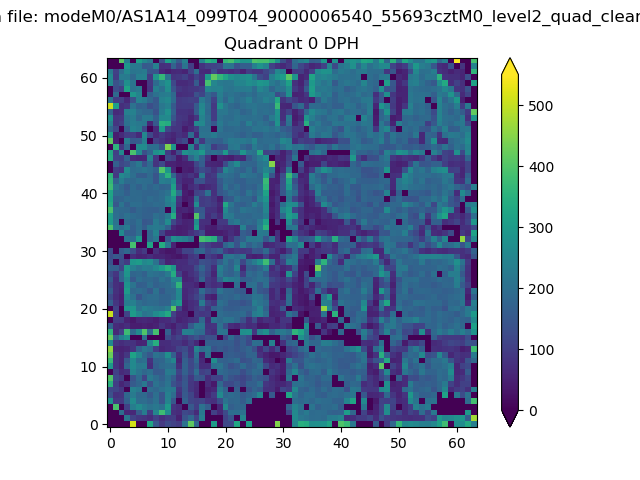 |
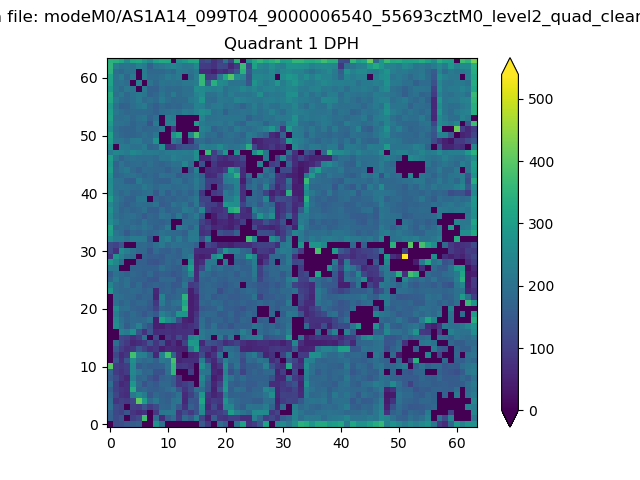 |
Quadrant B |
|---|---|---|---|
| Quadrant D | 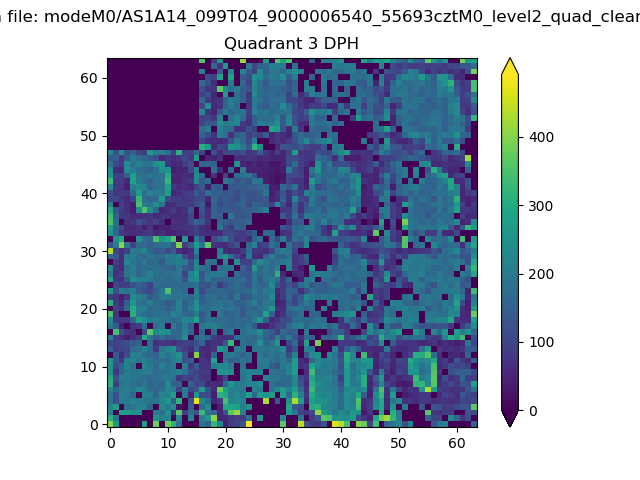 |
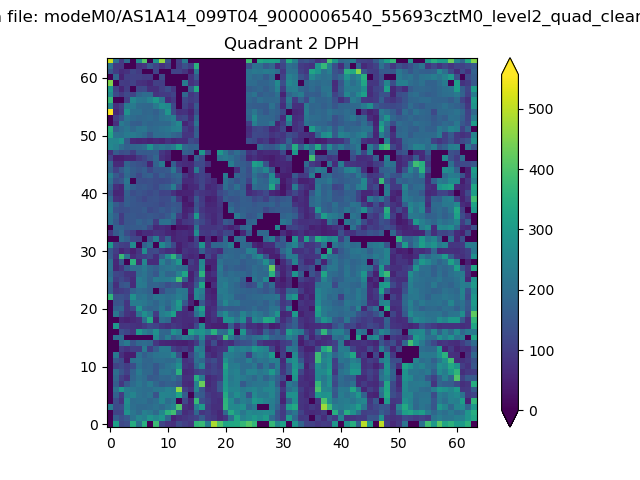 |
Quadrant C |
| Plot type | Count rate plots | Images |
|---|---|---|
| Comparison with Poisson distribution Blue bars denote a histogram of data divided into 1 sec bins. Red curve is a Poisson curve with rate = median count rate of data. |
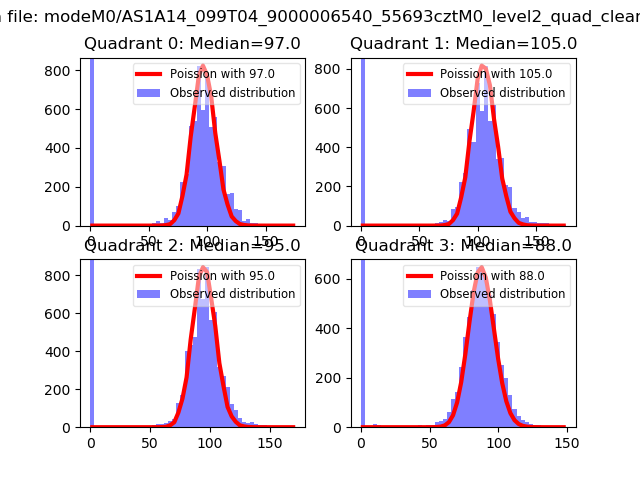 |
 |
| Quadrant-wise count rates Data is divided into 100 sec bins |
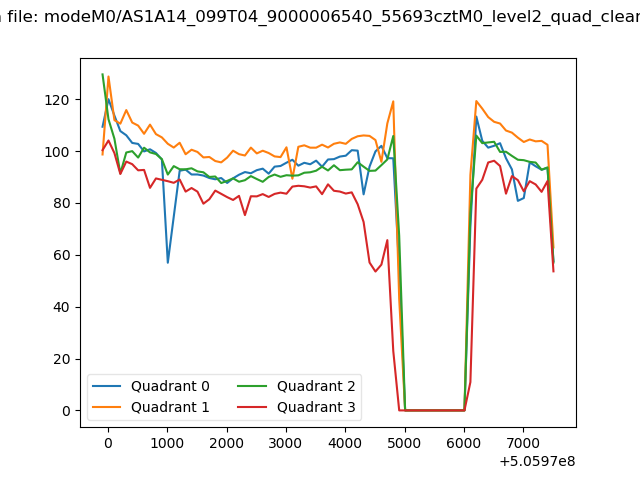 |
|
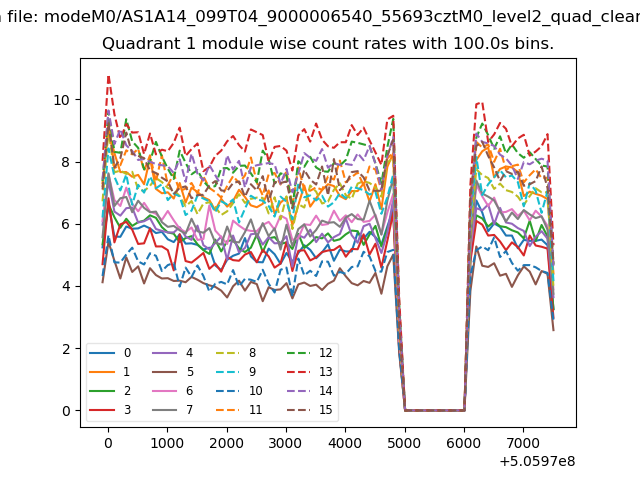
| Module-wise count rates for Quadrant A Data is divided into 100 sec bins |
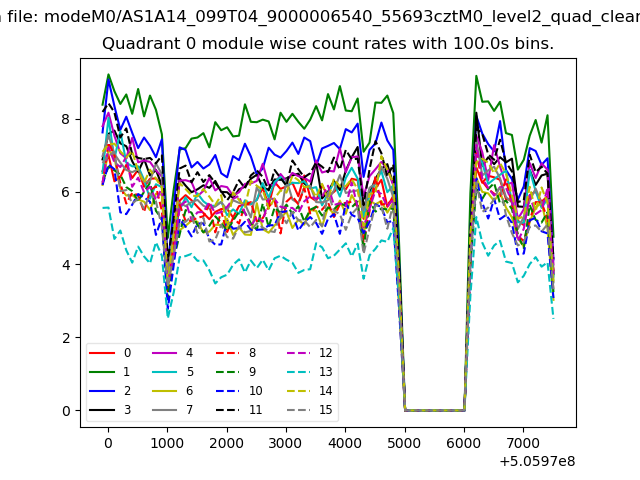 |
 |
| Module-wise count rates for Quadrant B Data is divided into 100 sec bins |
 |
 |
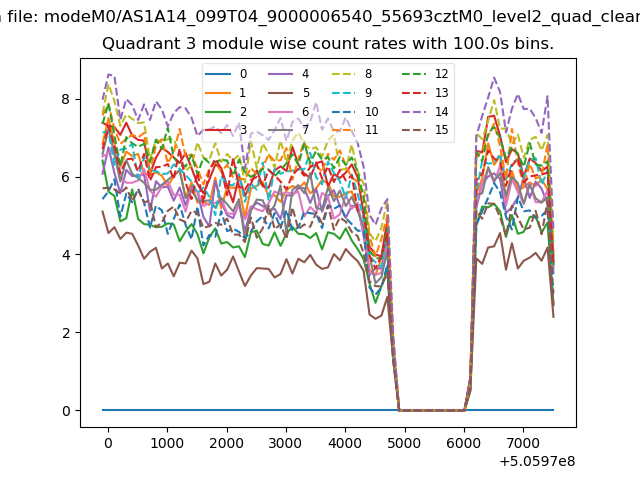
| Module-wise count rates for Quadrant C Data is divided into 100 sec bins |
 |
 |
| Module-wise count rates for Quadrant D Data is divided into 100 sec bins |
 |
 |
| Parameter | Plot |
|---|---|
| CZT HV Monitor | 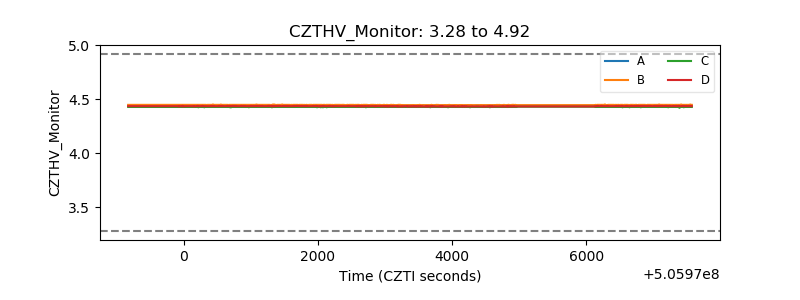 |
| D_VDD | 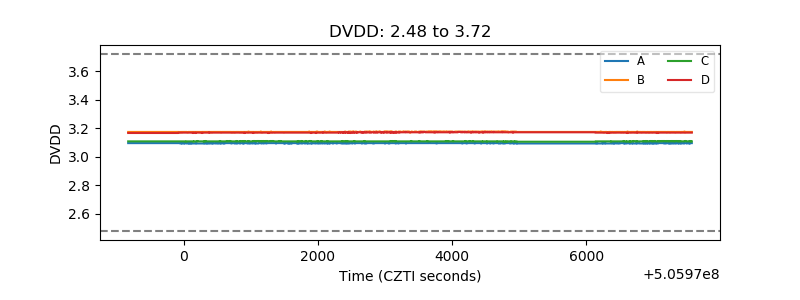 |
| Temperature 1 | 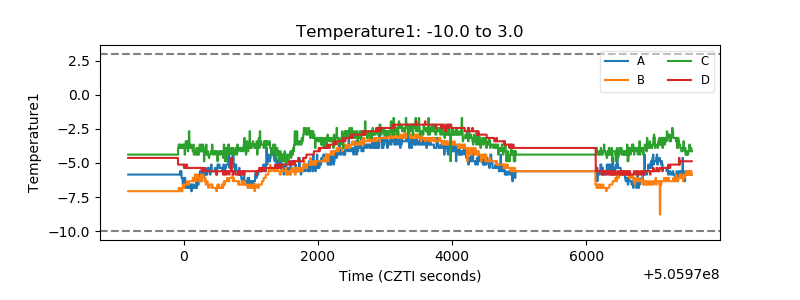 |
| Veto HV Monitor | 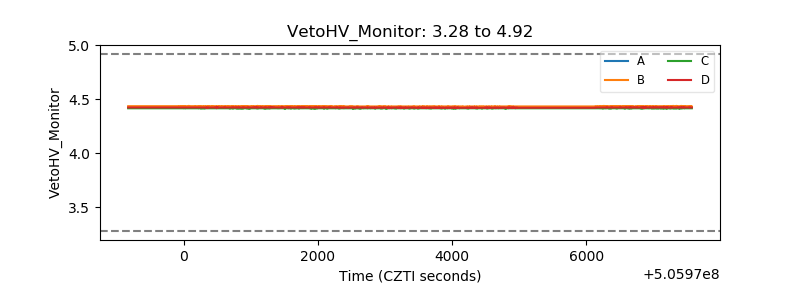 |
| Veto LLD | 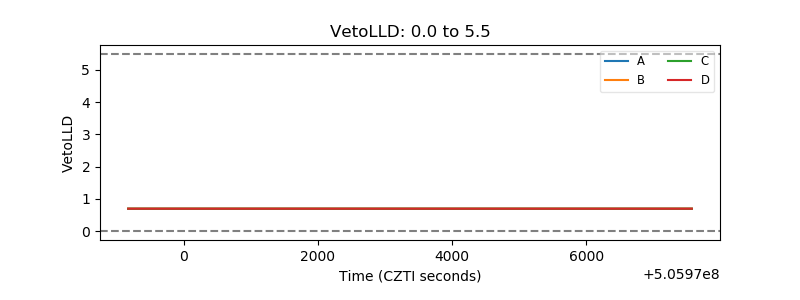 |
| Alpha Counter | 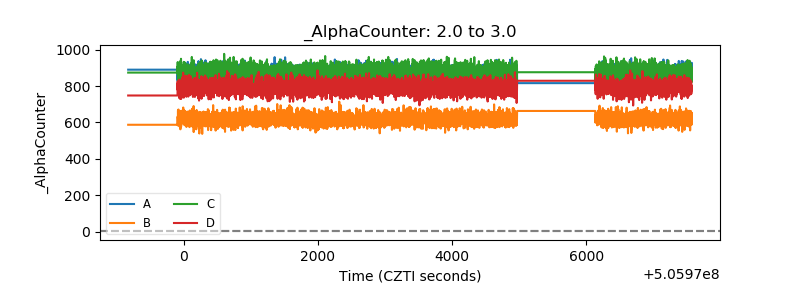 |
| _CPM_Rate | 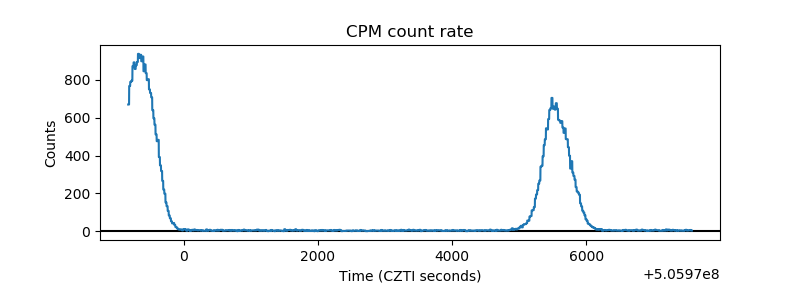 |
| CZT Counter | 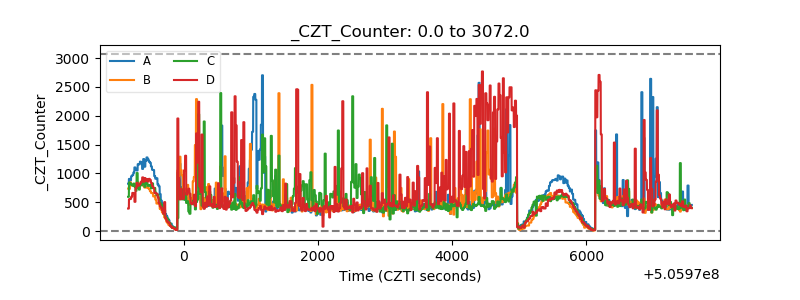 |
| +2.5 Volts monitor |  |
| +5 Volts monitor |  |
| _ROLL_ROT | 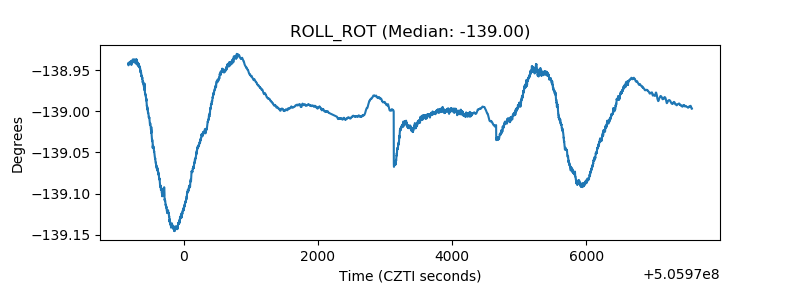 |
| _Roll_DEC | 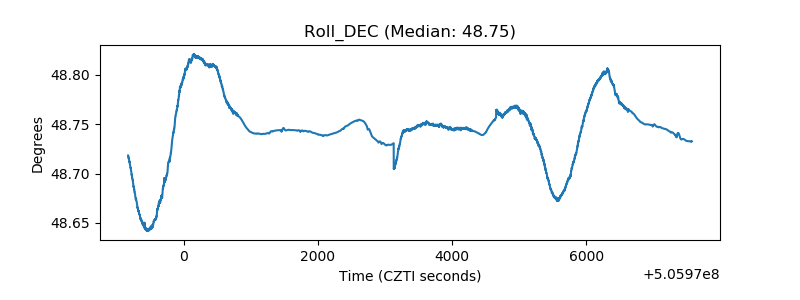 |
| _Roll_RA | 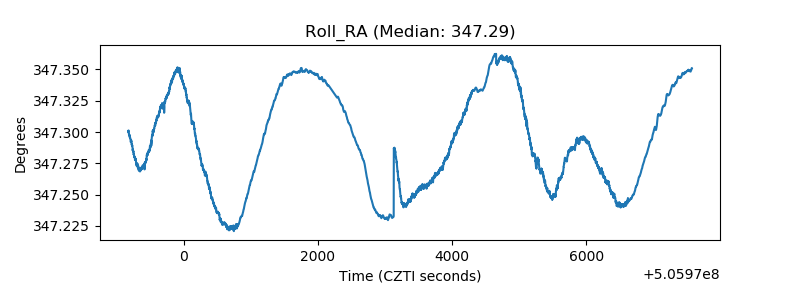 |
| Veto Counter | 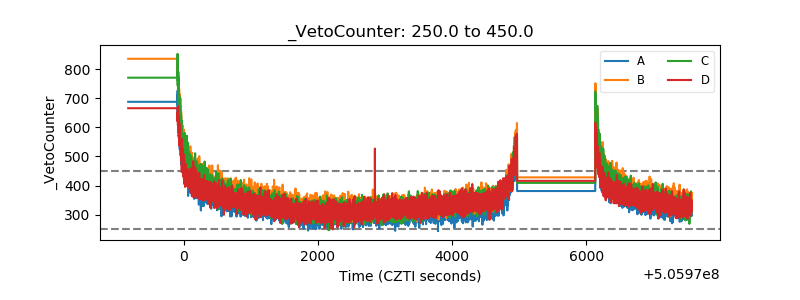 |