| Param | Original file | Final file |
|---|---|---|
| Filename | modeM0/AS1A14_099T04_9000006540_55695cztM0_level2.fits | modeM0/AS1A14_099T04_9000006540_55695cztM0_level2_quad_clean.evt |
| Size (bytes) | 548,559,360 | 90,190,080 |
| Size | 523.1 MB | 86.0 MB |
| Events in quadrant A | 4,159,265 | 580,978 |
| Events in quadrant B | 2,981,934 | 657,880 |
| Events in quadrant C | 6,958,449 | 518,737 |
| Events in quadrant D | 5,694,230 | 513,682 |
| Mode M0 | |||
|---|---|---|---|
| Quadrant | BADHDUFLAG | Total packets | Discarded packets |
| A | 0 | 17299 | 1 |
| B | 0 | 13702 | 1 |
| C | 0 | 25505 | 1 |
| D | 0 | 21593 | 1 |
| Mode M9 | |||
|---|---|---|---|
| Quadrant | BADHDUFLAG | Total packets | Discarded packets |
| A | 0 | 9 | 0 |
| B | 0 | 9 | 0 |
| C | 0 | 9 | 0 |
| D | 0 | 9 | 0 |
| Mode SS | |||
|---|---|---|---|
| Quadrant | BADHDUFLAG | Total packets | Discarded packets |
| A | 0 | 134 | 0 |
| B | 0 | 134 | 0 |
| C | 0 | 134 | 0 |
| D | 0 | 134 | 0 |
| Quadrant | Total seconds | Saturated seconds | Saturation percentage |
|---|---|---|---|
| A | 6591 | 462 | 7.009558% |
| B | 6591 | 131 | 1.987559% |
| C | 6591 | 1130 | 17.144591% |
| D | 6592 | 708 | 10.740291% |
Noise dominated data is calculated using 1-second bins in cleaned event files. If a bin has >2000 counts, and if more than 50% of those come from <1% of pixels, then it is considered to be noise-dominated and hence unusable.
| Quadrant | # 1 sec bins | Bins with >0 counts | Bins with >2000 counts | High rate bins dominated by noise | Noise dominated (total time) | Noise dominated (detector-on time) | Marked lightcurve |
|---|---|---|---|---|---|---|---|
| A | 7456 | 6592 | 349 | 349 | 4.68% | 5.29% | 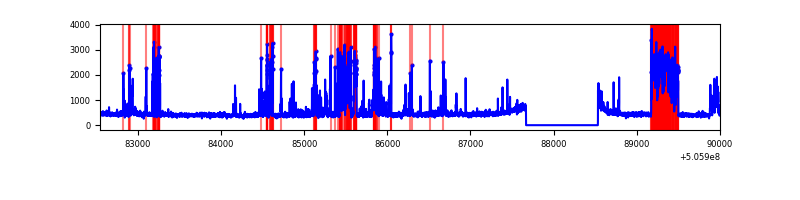 |
| B | 7456 | 6592 | 11 | 11 | 0.15% | 0.17% | 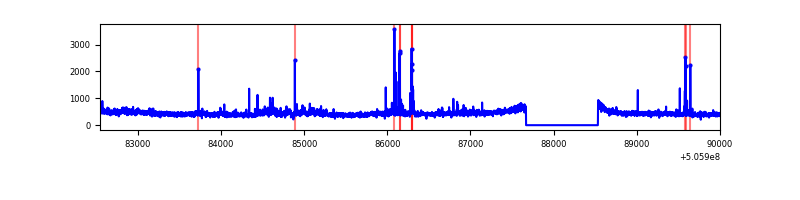 |
| C | 7456 | 6591 | 1238 | 1238 | 16.60% | 18.78% | 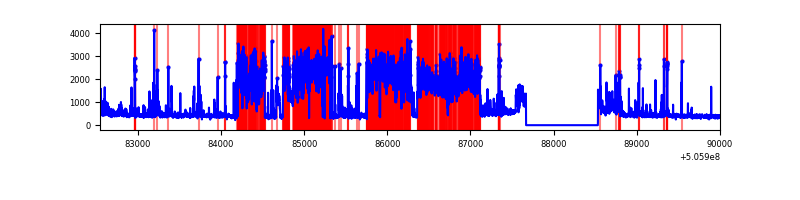 |
| D | 7457 | 6592 | 628 | 628 | 8.42% | 9.53% | 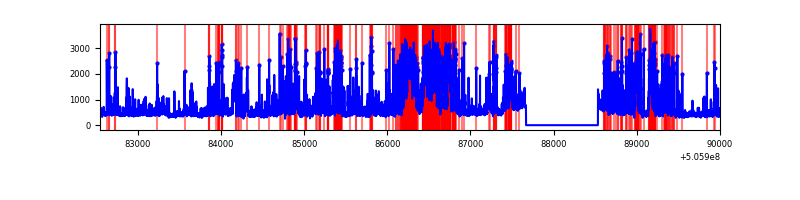 |
Top three noisy pixels from each quadrant. If the there are fewer than three noisy pixels in the level2.evt file, extra rows are filled as -1
| Pixel properties | Quadrant properties | ||||||
|---|---|---|---|---|---|---|---|
| Quadrant | DetID | PixID | Counts | Sigma | Mean | Median | Sigma |
| A | 12 | 115 | 683943 | 4071.22 | 682 | 666 | 167.8 |
| A | 7 | 64 | 347213 | 2064.86 | 682 | 666 | 167.8 |
| A | 0 | 8 | 244053 | 1450.19 | 682 | 666 | 167.8 |
| B | 4 | 206 | 141042 | 950.66 | 683 | 656 | 147.7 |
| B | 7 | 252 | 46687 | 311.71 | 683 | 656 | 147.7 |
| B | 4 | 190 | 29853 | 197.71 | 683 | 656 | 147.7 |
| C | 9 | 38 | 3956352 | 22442.24 | 643 | 638 | 176.3 |
| C | 13 | 3 | 123920 | 699.42 | 643 | 638 | 176.3 |
| C | 12 | 249 | 106934 | 603.06 | 643 | 638 | 176.3 |
| D | 11 | 129 | 3070486 | 16699.37 | 647 | 618 | 183.8 |
| D | 7 | 129 | 45166 | 242.33 | 647 | 618 | 183.8 |
| D | 5 | 173 | 43944 | 235.68 | 647 | 618 | 183.8 |
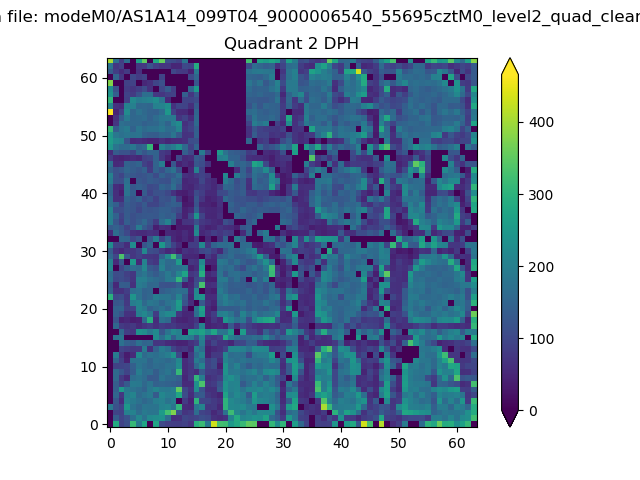
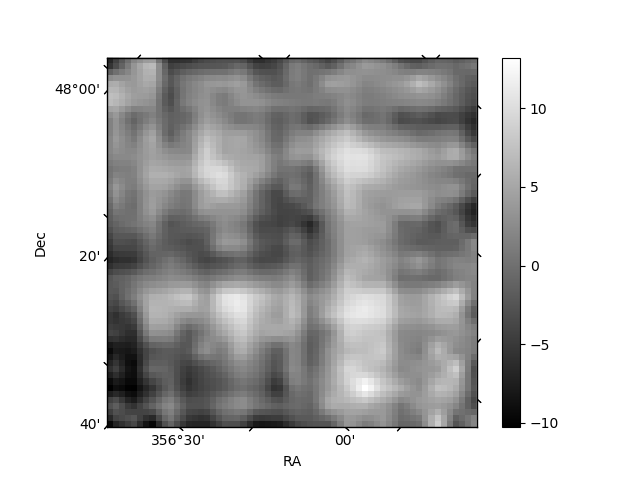
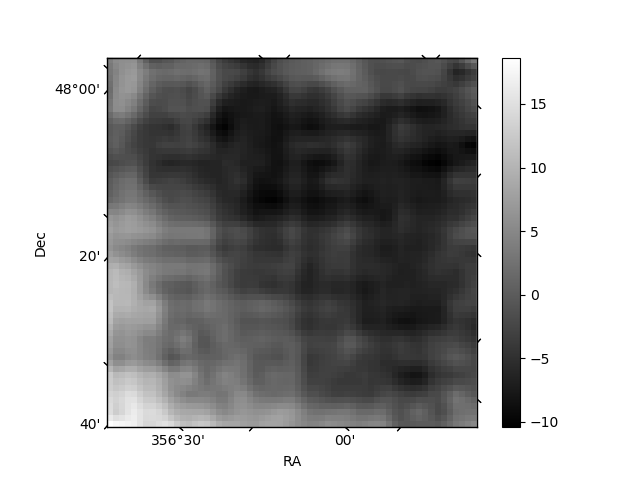
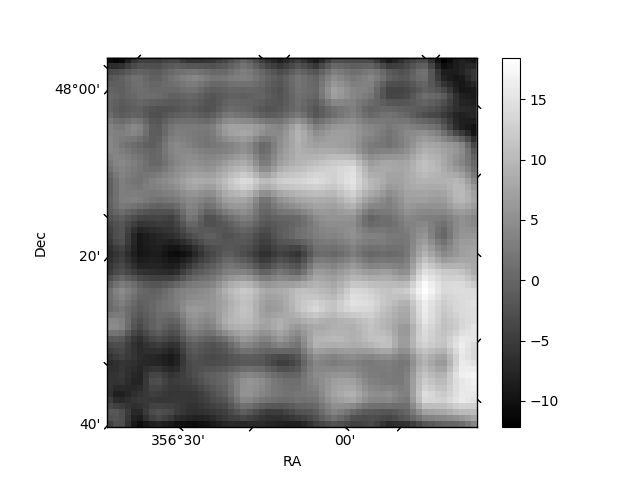
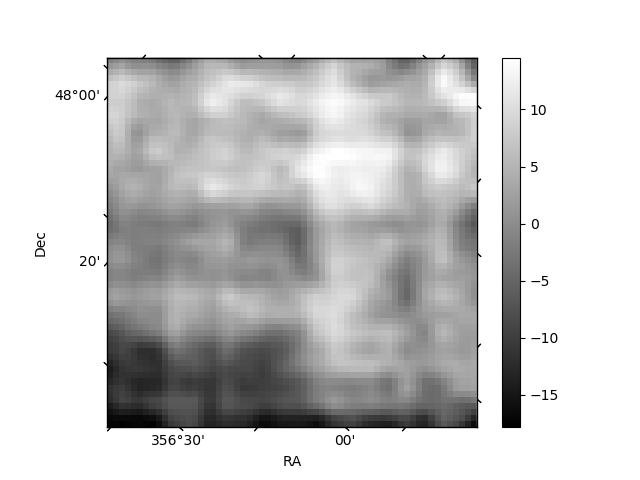
Histogram calculated using DETX and DETY for each event in the final _common_clean file
| Quadrant A | 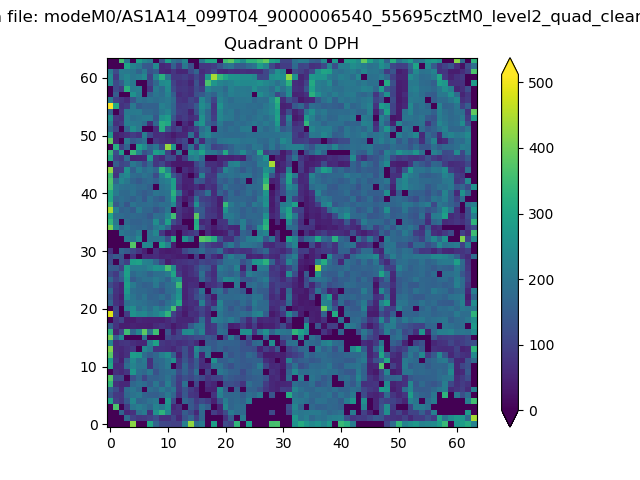 |
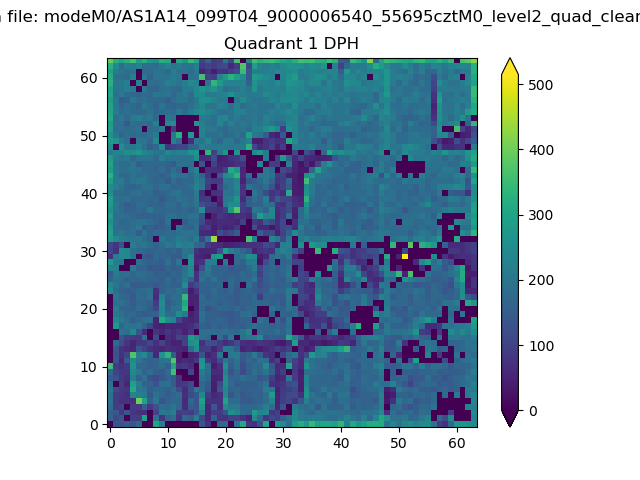 |
Quadrant B |
|---|---|---|---|
| Quadrant D | 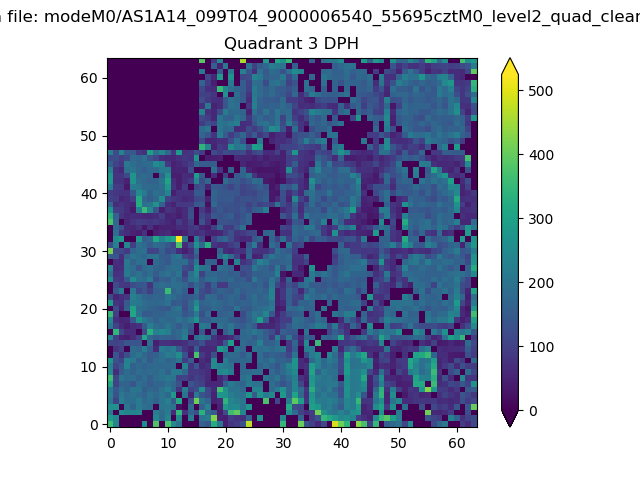 |
 |
Quadrant C |
| Plot type | Count rate plots | Images |
|---|---|---|
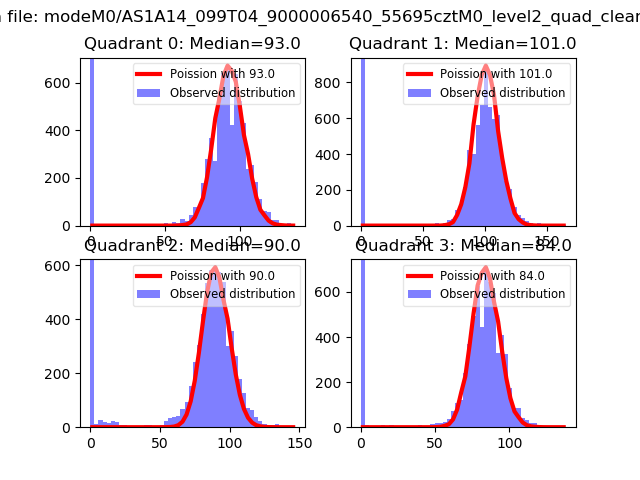
| Comparison with Poisson distribution Blue bars denote a histogram of data divided into 1 sec bins. Red curve is a Poisson curve with rate = median count rate of data. |
 |
 |
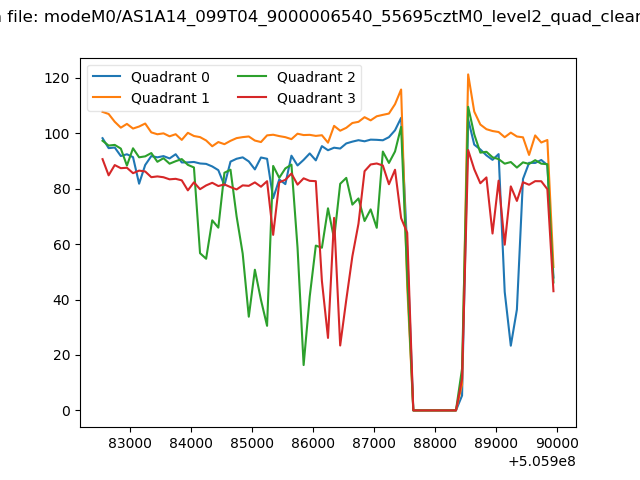
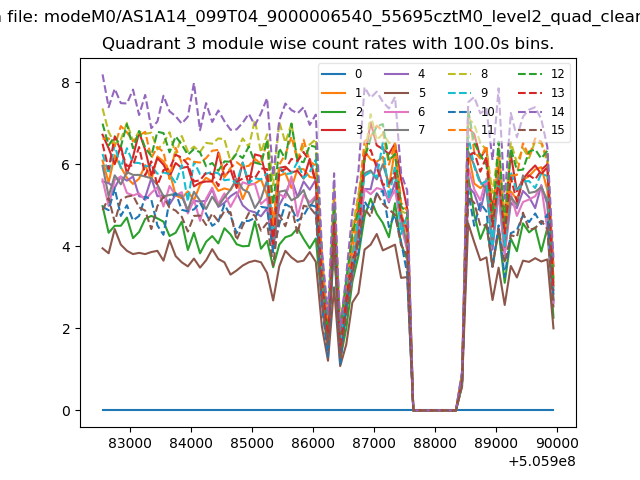
| Quadrant-wise count rates Data is divided into 100 sec bins |
 |
|
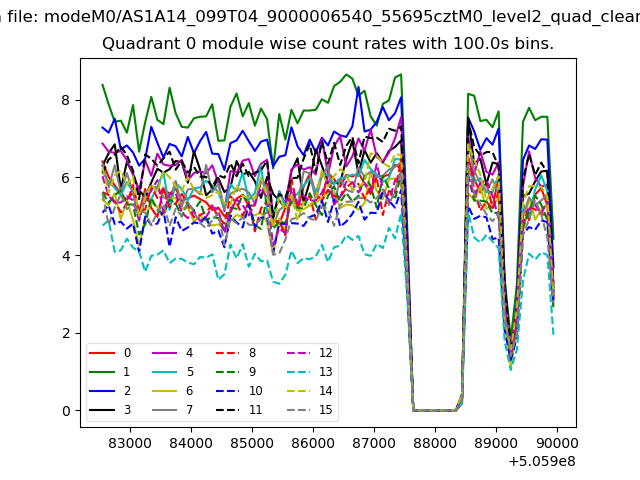
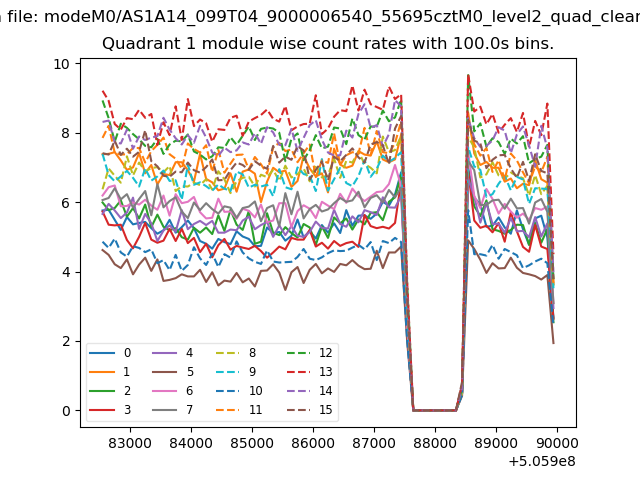
| Module-wise count rates for Quadrant A Data is divided into 100 sec bins |
 |
 |
| Module-wise count rates for Quadrant B Data is divided into 100 sec bins |
 |
 |
| Module-wise count rates for Quadrant C Data is divided into 100 sec bins |
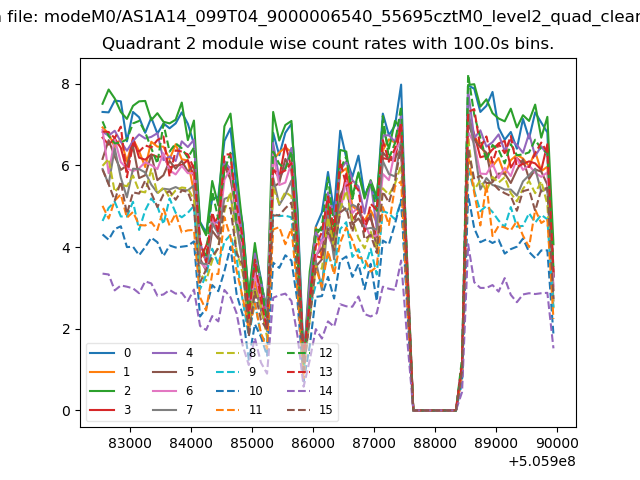 |
 |
| Module-wise count rates for Quadrant D Data is divided into 100 sec bins |
 |
 |
| Parameter | Plot |
|---|---|
| CZT HV Monitor |  |
| D_VDD | 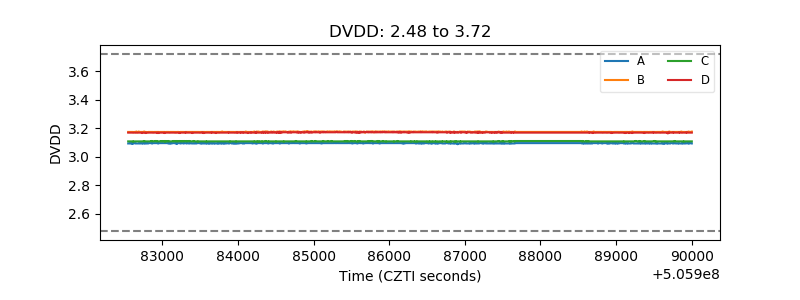 |
| Temperature 1 | 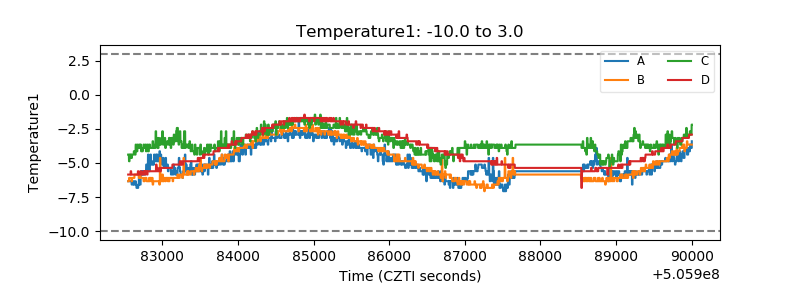 |
| Veto HV Monitor | 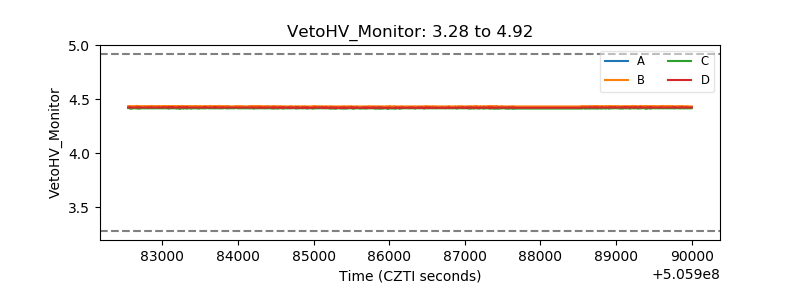 |
| Veto LLD | 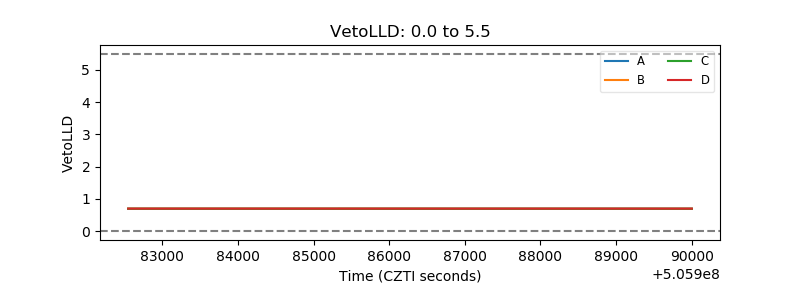 |
| Alpha Counter | 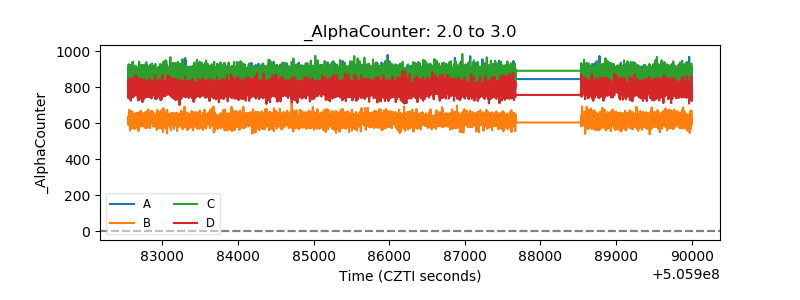 |
| _CPM_Rate | 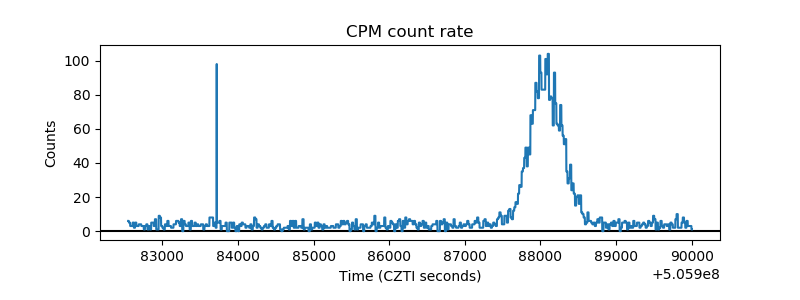 |
| CZT Counter | 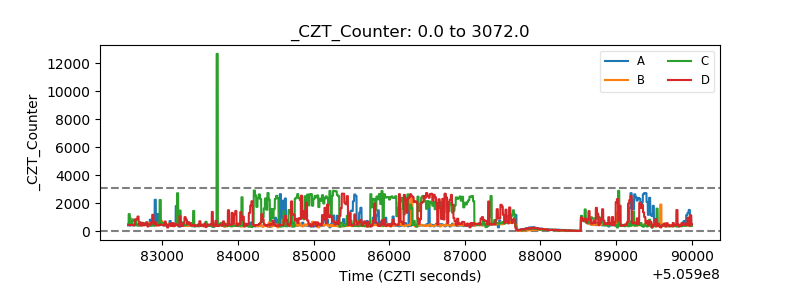 |
| +2.5 Volts monitor |  |
| +5 Volts monitor |  |
| _ROLL_ROT | 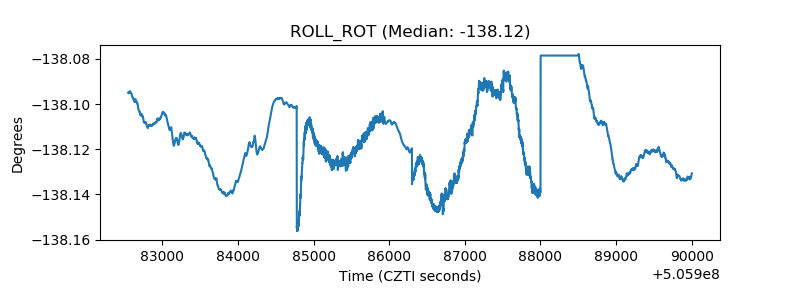 |
| _Roll_DEC | 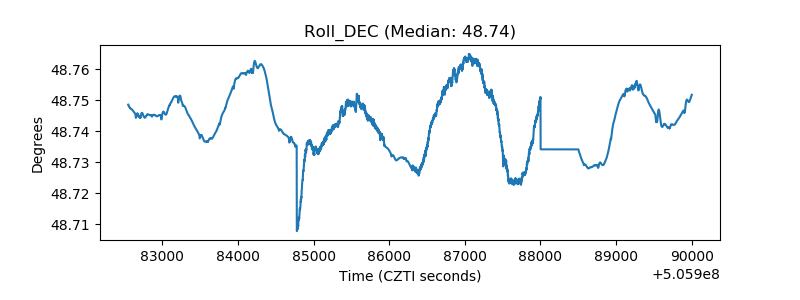 |
| _Roll_RA | 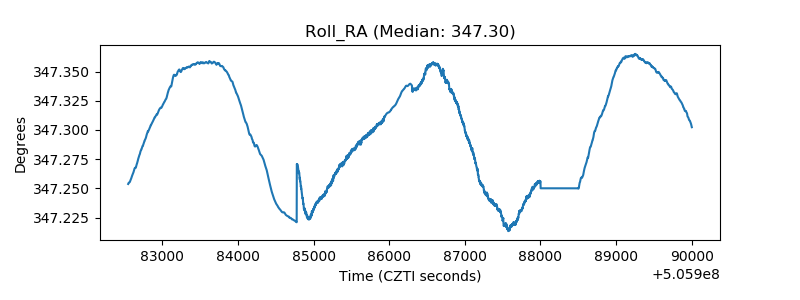 |
| Veto Counter | 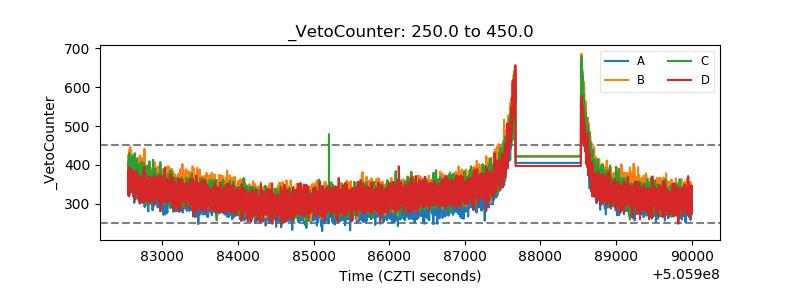 |